BTCUSD.P — Wick Above High ≠ Bullish Break of Structure📌 BTCUSD.P — Wick Above High ≠ Bullish Break of Structure
Timeframe: 15m
Market: BTC Perpetual (Bybit)
🧠 Key Observation
Price did not break structure bullishly here.
Although BTC wicked above the prior high, there was no full-bodied close above the previous high’s wick. That distinction matters.
A wick alone shows reach.
Structure requires acceptance.
🔍 What This Means
The prior high was tested and liquidity was taken
Buyers failed to secure a close above resistance
Price immediately stalled rather than expanding
This behavior is consistent with a liquidity sweep, not a confirmed bullish shift in market structure.
⚠️ Why Early Longs Are Dangerous Here
Entering long on the first touch or wick break:
Assumes continuation before confirmation
Exposes the trade to a sweep-and-reverse scenario
Treats intent as fact
In this context, an early long can easily become exit liquidity.
✅ What a Real Bullish Break Would Require
For this to qualify as a valid Bullish BoS:
A decisive candle body close above the previous high’s wick
Follow-through or acceptance above the level
No immediate reclaim back below resistance
Until then, structure remains unbroken.
🧭 Execution Guidance
Patience > prediction
Let the market prove acceptance
If price reclaims the level with strength, bias can flip
If price rejects, the sweep thesis gains validity
Structure is not about being early.
It’s about being right after confirmation.
🧾 Final Thought
Wicks hunt liquidity.
Bodies establish control.
Knowing the difference keeps you solvent.
❗ Disclaimer
Educational purposes only.
Not financial advice.
Market-structure

MNQ (15m) POI Map — Why These Levels Matter and how to use themMNQ (15m) POI Map — Why These Levels Matter (and how I’m using them)
I don’t like “winging it” once the market starts moving fast. So before the session (or during quieter pre-market hours), I mark **Points of Interest (POIs)** that I expect price to **react from**—either as support/resistance, liquidity targets, or “decision zones” where bias can flip.
These POIs are not magic lines. They’re **locations where order flow has already proven itself**, and where I want to be *ready* instead of *surprised*.
---
## How I chose these POIs (my filter)
Each POI on this chart was mapped using 3 things:
1. **Structure (15m swings / pivots)**
Where price previously *broke structure* or *rejected hard*.
2. **Liquidity (obvious targets)**
Equal highs/lows, clean swing points, and “everyone sees it” areas where stops sit.
3. **Reaction history (clean reactions)**
Levels that have already caused a noticeable bounce, stall, or reversal = worth respecting again.
---
## The Levels (Bull POIs)
### **BULL POI #1 — 25,810.50**
This is my **first decision level** in the current zone. It’s the closest “line in the sand” where:
* Holding above it keeps bullish continuation alive
* Losing it opens the door for a rotation back into the lower POIs
**How I use it:**
If we tag this area and **hold/accept above** (strong bodies, wicks getting bought, reclaim after a sweep), I’m looking for longs targeting the next POI up.
---
### **BULL POI #2 — 25,874.25**
This one is a **higher pivot / reaction zone**—the type of level where price often:
* pauses to consolidate
* rejects for a pullback
* or breaks through and turns into support
**How I use it:**
If price is trending up, this is a logical **first major target** and a spot to either scale profit or look for a clean break-and-retest to continue.
---
### **BULL POI #3 — 25,927.00**
This is a **liquidity + swing area**. It’s the kind of level that’s attractive for:
* stop runs above prior highs
* profit-taking
* reversal setups if momentum stalls
**How I use it:**
I treat this as a “reaction expected” level. If we arrive with weak momentum, I’m cautious chasing longs into it.
---
### **BULL POI #4 — 25,949.25**
This is my **upper extreme POI**—usually a bigger “decision area” where:
* late longs get trapped if momentum dies
* reversals can form (especially after a sweep)
* or we get continuation if the tape is strong
**How I use it:**
I’m more likely to **take profit into this** than initiate fresh longs unless the market is clearly in expansion.
---
## The Levels (Bear POIs)
### **BEAR POI #1 — ~25,754 zone (25,754.25 on my map)**
This is my **bearish trigger / pivot**. If price loses Bull POI #1 and continues lower, this becomes the next major “prove it” level.
**How I use it:**
If we break down into this area and **reject** (heavy wicks, failed reclaim), I’ll look for continuation shorts toward the next bear POIs.
---
### **BEAR POI #2 — 25,649.75**
This is a deeper **demand/reaction pocket**—a level I expect price to *respect* or at least *pause* at.
**How I use it:**
This is a common “bounce zone.” If shorts are in profit, I’m scaling here. If we sweep it and reclaim, I’m watching for reversal setups.
---
### **BEAR POI #3 — 25,622.25**
This is the **lower extreme / liquidity pool** level—where panic moves can exhaust and snap back.
**How I use it:**
I’m not trying to short *into* this level late. This is where I expect **either**:
* a final flush and reversal attempt
**or**
* a strong breakdown continuation (if the day is truly risk-off)
---
## The whole point of mapping POIs
These levels give me a simple plan:
* **Hold above Bull POI #1 → bullish bias stays active**
* **Lose Bull POI #1 → expect rotation to Bear POI #1**
* **Each POI is either a target, a reaction zone, or a bias flip zone**
I’m not predicting. I’m preparing.
---
## Execution Rules (what I wait for at a POI)
At any POI, I want confirmation like:
* **Sweep + reclaim** (liquidity grab then strong close back through)
* **Break + retest** (clean structure change)
* **Rejection candles** (wicks + follow-through away from the level)
* **Acceptance** (multiple closes above/below = level flips)
Then I manage risk using a simple concept:
**Invalidation goes just beyond the POI. Targets are the next POI.**
---
### If you’re using my tool stack:
These POIs pair well with:
* **ORB direction/bias**
* **VWAP/EMA context**
* **Reversal confirmations** (only when the POI + context agree)
---
**Not financial advice. Futures are high risk—size accordingly and protect your downside.**
If you want, I can turn this into a cleaner “TradingView publish-ready” format with a tighter intro + bullet layout, and add your usual TRADESWITHB call-to-action at the end.

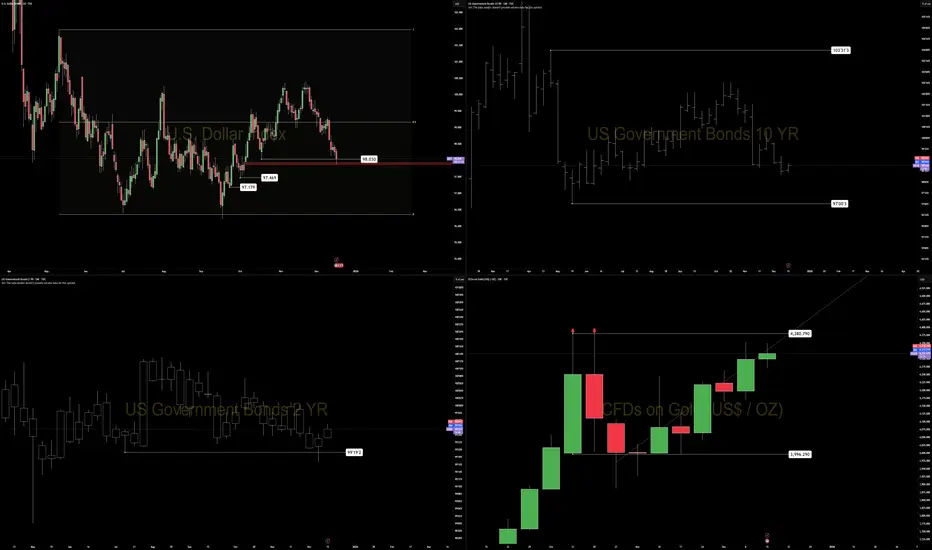
DXY — Daily Structure at a Decision PointThe dollar has completed a prior volume imbalance fill at 97.853 and is now trading against the lower boundary of the daily range.
Participation is low, consistent with late-December conditions. In this environment, daily closes matter more than intraday movement.
Key level: 98.030
This is the prior daily range low.
A daily close below 98.030 shifts the daily bias bearish
Without that close, downside pressure remains internal to the range
The move into imbalance without expansion suggests position resolution, not trend initiation. This is typical of year-end exposure reduction, rather than new macro positioning.
Cross-market context:
Gold is pressing into a double-high area without expansion.
Bonds are showing loss of momentum at the front end.
Risk assets remain supported but lack acceleration.
If structure breaks, the next natural downside references sit at 97.469 and 97.179.
Until a close confirms, this remains a confirmation environment, not a forecasting one.
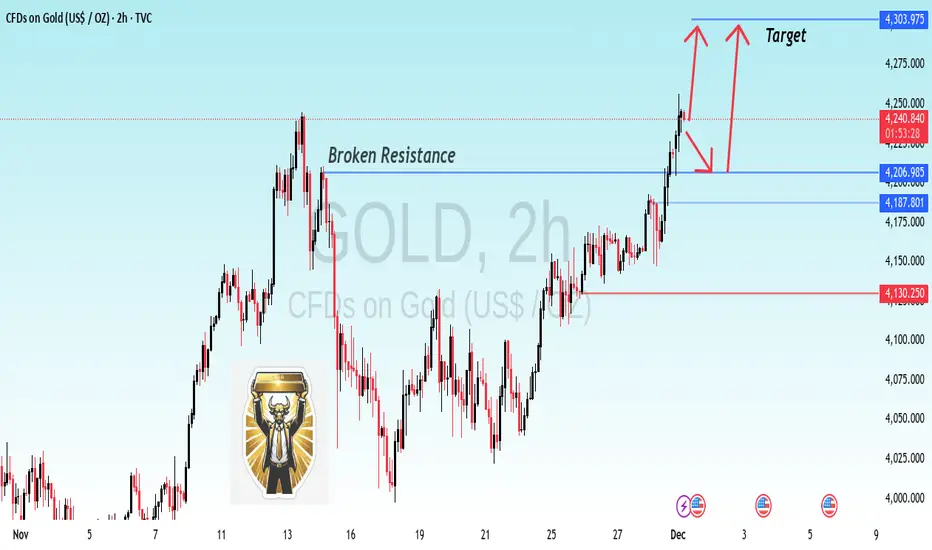
GOLD Breakout Confirmation Bulls trakin ControlUPDATE: Previous GOLD Idea Hit 100% Exactly as Expected! | JT_CHARTsMaster
The last analysis played out perfectly — GOLD followed the exact structure, respected the levels, and completed the move with full accuracy.
Thank you to everyone who supported the previous idea!
---
📌 Current Analysis (2H Timeframe)
Gold has broken the key resistance zone, and price is now retesting the breakout area.
After this clean retest, the market is showing signs of bullish continuation.
Key Points:
✔ Previous resistance now acting as support
✔ Break–retest–continuation structure is active
✔ Market is holding above the breakout zone
✔ Bullish momentum is building toward the next targets
---
📈 Expected Move
As long as gold stays above the breakout level, the probability of a move toward the next targets remains strong.
I’ve highlighted the expected upward move on the chart with arrows for clarity.
---
🙏 Thanks for Your Support
Your boosts, comments, and likes motivate me to share more accurate analyses like this.
👉 If you found this helpful, please Boost the idea and leave a comment — it really helps!
— JT_CHARTsMaster
A slight pullback to around 112,000 is expected before a bullishThere is a double top on the daily timeframe. It could pull back to the previous support level that I mentioned in the chart. Moreover, there is a healthy trendline support that can help BTC price bounce.

AUDJPY Market Forecast – Level 3 Completion & Potential ResetThis chart illustrates a classic Market Maker 3-Level Rise Pattern:
Level 1: Initiated after a consolidation phase, marked by a clear shift in structure.
Level 2: Continued bullish expansion with stronger impulsive candles.
Level 3: Price reaches an overextended zone with signs of slowing momentum, indicating a potential distribution or retracement phase.
Key Forecast:
A retracement is expected toward the 93.297 zone, which aligns with:
Possible reaccumulating point before continuation
This move may serve as a manipulation trap to grab liquidity below recent lows before pushing higher. If price reacts strongly at 93.297 with bullish structure, a long setup targeting new highs (~94.40+) is favored.

Wyckoff Cycle - Practical Example (SUI)Dear TradingView community and fellow traders,
I am Richard, also known as theSignalyst.
I find the SUI daily chart to be intriguing as it appears to be following the famous Wyckoff Cycle.
I would like to apply Richard Wyckoff's four market stages/phases to this chart for analysis as a practical example.
1️⃣ Accumulation
SUI rejected the $0.50 round number and entered an accumulation phase, consolidating for several months.
2️⃣ MarkUp
After breaking above the accumulation range at $1, SUI kicked off the markup phase.
3️⃣ Distribution
SUI found resistance at the $5.50 round number, with the lower bound of its range near $4—forming a wide distribution phase.
4️⃣ MarkDown
Once SUI broke below the $4 major low and exited the distribution zone, it transitioned into the markdown phase.
🔄🔄🔄🔄🔄⬇️
1️⃣ Accumulation
After finding support around the $2 round number, SUI hovered within a range, forming another accumulation phase.
2️⃣ MarkUp
We're here 🙂 This week, SUI broke above the $2.80 major high and the accumulation range—signaling the beginning of a new markup phase.
❓ What's next?
Will SUI continue to trade higher from here, or will this cycle play out differently?
I hope you find this post useful, and I would appreciate your likes and support.
Which scenario do you think is more likely to happen first? and why?
📚 Always follow your trading plan regarding entry, risk management, and trade management.
Good luck!
All Strategies Are Good; If Managed Properly!
~Richard

TSLA EarningsNASDAQ:TSLA
Daily key level acting as support for the 4H reject on the heels of earnings.
Trade smart.
Trade management.

[EDU-Bite Sized Mini Series]Understanding Forex Market StructureHello fellow traders , my regular and new friends!
Welcome and thanks for dropping by my post.
Let's begin with our topic today!
The forex market, being decentralized and over-the-counter (OTC), operates differently from traditional centralized exchanges. To navigate it effectively, traders need to comprehend its unique structure.
Market structure refers to the arrangement of price action within a given market, encompassing key elements such as trends, support and resistance levels, and price behavior.
1. Trends:
Trends are one of the fundamental aspects of market structure. They depict the overall direction of price movement over time. Traders often classify trends as bullish (upward), bearish (downward), or ranging (sideways). Understanding the prevailing trend helps traders align their strategies accordingly.
2. Support and Resistance Levels:
Support and resistance levels (or known as supply and demand levels/zones) are areas where price tends to stall, reverse, or exhibit significant buying or selling pressures. These levels/areas form the building blocks of market structure and are crucial for identifying potential entry and exit points. Support represents levels where buying interest outweighs selling pressure, preventing prices from falling further. Conversely, resistance denotes areas where selling pressure surpasses buying interest, hindering further upward movement. If you have cluster of candle's tail in a area/levels, likely it would be supply/demand liquidity pocket
3. Price Behavior:
Price behavior within market structure provides valuable insights into market sentiment and participant dynamics. Patterns such as higher highs and higher lows in an uptrend, or lower highs and lower lows in a downtrend, signify the strength or weakness of a trend. Additionally, the manner in which price interacts with support and resistance levels can indicate potential reversals or continuations.
4. Market Phases:
Understanding different phases of the market, such as accumulation, markup, distribution, and markdown, aids in deciphering market structure. Each phase reflects the behavior of market participants and their collective impact on price action. Recognizing these phases enables traders to anticipate potential shifts in market direction and adjust their strategies accordingly.
Conclusion:
In summary, comprehending forex market structure is essential for effective trading. By analyzing trends, identifying key support and resistance levels, observing price behavior, and recognizing market phases, traders can make informed decisions and navigate the forex market with confidence.
Do check out my recorded video (in trading ideas) for the week to have more explanation in place.
Do Like and Boost if you have learnt something and enjoyed the content, thank you!
-- Get the right tools and an experienced Guide, you WILL navigate your way out of this "Dangerous Jungle"! --
*********************************************************************
Disclaimers:
The analysis shared through this channel are purely for educational and entertainment purposes only. They are by no means professional advice for individual/s to enter trades for investment or trading purposes.
*********************************************************************

MANTAUSDTi using market ST so we have ascending ch we think market can move the downside until 90R let us see the result

BTC - Market Structure 101 📚 Keeping It SimpleHello TradingView Family / Fellow Traders,
📊 I find the BTC H1 chart interesting as it has been respecting the market structure cleanly inside the rising channel recently.
📈 As the price approaches the lower bound of the channel, the bulls are taking control for an impulse after breaking above the last high in blue and the 21 EMA.
📉 Conversely , as the price nears the upper bound of the channel, the bears take charge for a correction after breaking below the last low in green and the 21 EMA.
Today, BTC rejected the upper bound and broke below the green low and 21 EMA, signaling that the bears are currently in control.
📉 The bears are expected to maintain control, and we anticipate a movement towards the lower bound of the channel.
📈 However , a shift in momentum could occur if the bulls regain control by breaking above the red channel and reaching 38,100. In such a scenario, we would anticipate a bullish continuation towards the upper bound of the rising channel.
What are your thoughts? Do you believe BTC will continue to adhere to this simple market structure?
📚 Always follow your trading plan regarding entry, risk management, and trade management.
Good luck!
All Strategies Are Good; If Managed Properly!
~Richard Nasr

ETH - One More CheckPoint 📍Hello TradingView Family / Fellow Traders. This is Richard, also known as theSignalyst.
📈 As per our last analysis (attached on the chart), ETH rejected the 1550.0 support and traded higher.
Currently, ETH is sitting around a strong supply marked in orange.
📈 For the bulls to remain in control, we need a break above 1885.0
📉 Meanwhile, if the gray zone 1738.0 is broken downward, expect the bearish impulse to start.
📚 Always follow your trading plan regarding entry, risk management, and trade management.
Good luck!
All Strategies Are Good; If Managed Properly!
~Rich

Harmonic + OB + IMB + OTE: Failed1. I used the Previous OTE ZONE as my entry area when it has already been tapped a few times...
2. I did not plot a fib ret on the latest swing low/high for some reason despite there being a ChoCh present.
One thing to note about this though, is that the FIBRET is Reversed. Seeing the non-reversed version meant there was no OB + OTE confluence anywhere.
Maybe that's why I didn't bother with it.
Here's the thing though.. and what is probably a crucial information that I wouldn't have learned if I didn't lose this trade:
Putting fibret on reverse, meant it confluenced with the FVG.
So what I've learned:
1. OTE + FVG MIGHT JUST BE AS VIABLE AS OTE + OB.
2.Try out both reversed and non-reversed versions of fib ret. There might be a confluence you are not seeing.
ALSO, VERY IMPORTANT NOTE:
If price left your entry point, and reached target take profit (liquidity, fvg, s/r levels, etc) first...
Close the trade.
Reaching the target take profit means the market maker move is done.
It means the intention has been fulfilled, and it's time to make a new price action setup.
So the next time it reaches your target entry point, the price has a higher chance of not bouncing, because price is already moving with different intent.
CANCEL COMPLETED TRADES.
SAVE YOUR CAPITAL.
DON'T GIVE IT UP EASILY.

BTC Long-Term Outlook/Analysis + Life GoalsI've charted this since last year, maybe since May, idk.
It shows two possible directions depending on what structure breaks.
Well, it broke Market Structure towards the upside, and has been following the price path that I laid out almost to a T/tee/tea(whatever).
So yeah. It just might follow it, or it might not and just straight up dumps on the higher timeframe, but that's unlikely?
Like, what could cause a worldwide massive sell off that would plummet the BTC price?
Well, of course, if the people and organizations that hold the massive BTC wallets would just randomly sell off their holdings. That would crash BTC.
But why would they do that?
So, in the end, my point is, if you think about it...
The dollar and current worldwide economy is crashing... so where do they turn to?
Bitcoin.
Not gold, not USD, but Bitcoin.
I think gold is also a "stablecoin", something you can rely on to hold value.
I think, going forward, I would like to keep accumulating bitcoin and gold, when I have the money to accumulate.
My goal in my financial life would be, to keep accumulating cash daily(through business, work, and trading), and keep DCA'ing into Bitcoin and Gold regardless of the market.

Market Structure + Orderblock + Fibonacci Retracement = FailedMarket Structure + Orderblock + Fibonacci Retracement = Failed
Here's why:
Trendlines, S/R Levels, Chart & Candlestick Patterns are still relevant.
Trade could have worked. It passed all the other criteria (market structure downtrend + bearish fib ret ote zone + bearish ob).
It was just a right trade at the wrong level.

P2P | DXY - Long Term AnalysisGreetings to all who can decode this message lol thank you for tapping in with the content!
This look into #DXY has not changed much from my last few videos, just some minor tweaks. I explain a few things on why I am #bullish on the #dollar and how I plan to #trade opposing pairs like Euro/USD or NASDAQ100.
So yeah gang, not too much to get descriptive over because everything is explained in the video. Enjoy the rest of your week, trade well, and keep crushing it for 2023!

EURAUD-POSSIBLE BREAK OF CHANNELPrice was moving in a Descending channel but currently price has broken the channel from 1HTF perspective, looking for valid Retest of the structure before going long.
My Target is to 1.58560
Feel free to.share your thought with me

btc analysis market structurebitcoin market structure looking clean, waiting for the next move to hop in

BTC Market Structure Changing - What to watch for
Understanding price action and market structure is one of the most valuable concepts in terms of keeping your head straight in this market. Bitcoin recently printing a couple signs of changing market structure and I wanted to share because sometimes this stuff is almost too simple that people overlook it.
The chart above is showing that after the enormous BTC drop in November, we started to print some higher highs and higher lows. In other terms, the 4hr chart was showing a bullish uptrend. This uptrend is shown by the orange line on the chart. All of this is great and wonderful, but this is where things start to change.
About a week ago, BTC price action pushed through this uptrend and closed a strong bearish candle. This was our first sign that something in the structure/trend is changing. This is an important thing, so I'll repeat it; The price action breaking through the orange trend line DOES NOT mean the market is reversing but it's a great warning sign that it's time to pay attention and be cautious with trades. This price action continued to drop far enough that we have already printed a lower low, which is also marked on the chart. And yet again, this does not mean that the market is reversed and going down, but that it's time to pay close attention to the price action coming up.
So the question is what's next? That is impossible to predict perfectly, but I'd like to share what is incredibly possible using similar market structure and ideas:
If the market structure is actually changing like the warning signs have been saying, then it's fair to expect a lower high to be printed as the market moves in waves. The question is simply where to expect a lower high. It can occur anywhere, but what I have marked on the chart is what I would consider to be a highly likely area for a lower high. This would be retesting a level of strong resistance for BTC. This also overlaps nicely with the Fibonacci golden pocket retracement that BTC loves to follow. That's really all there is to it, just support and a couple Fibonacci levels. This may change as more data comes in the next couple weeks but this is on my radar right now.
Happy trading! And keep an eye out for a lower high in the near future!
Slight word of caution: Volume will likely be very low in the coming 2 weeks due to holidays so don't get caught up too much in the noisy data and price action that occurs between now and the new year

Wyckoff Market Structure This signal is called Up thrust After Distribution which indicate the end of the up trend and strong signal of down trend!!! don't miss out this signal

2 Simple modules to pass FTMO ChallengeThese are the two types of entry modules that can be used across any market to take low risk high rewards trade. Pay close attention to annotations made. First High / Low acts as a trap for early sellers or buyers as this point is used to create liquidity for the market makers. Market makers sweeps this liquidity and mitigates extreme POI like orderblocks etc. and thus finally the banks load their short orders/long orders to break the structure.
TRUE STRUCTURE MAPPING AVAILABLE ON OUR YT CHANNEL. DO WATCH THAT VIDEO TO KNOW HOW REALLY MARKET STRUCTURE IS REALLY MAPPED AND DON'T FORGET TO LIKE AND SUBSCRIBE TO OUR CHANNEL
Happy Trading
-Team Lamda

EURUSD (retracement) PhaseWaiting on a break and retest for a potential SELL over 200 pips. Please use Proper Risk Management

EURJPY LongA lot of the currency pairs I follow have been having a hard day in terms of finding any direction.
The USDJPY is starting to breakout of a consolidation period and the EURJPY having previously broke some structure has pulled back to my entry level.
