BTCUSDT: short 98888.8If we exclude random pumps and dumps, the market is currently suspended in uncertainty.
BINANCE:BTCUSDT.P neither breaks below the 100,678.0 support level nor bounces back from it — it simply grinds sideways.
A clear local level has formed at 98,888.0, from which BTC has bounced twice in the past two days.
Now, the price is gradually moving toward it again, indicating a short-biased sentiment.
This lack of clarity in BTC’s behavior keeps the entire crypto market frozen.
The only movements come from baseless pumps and dumps, emerging and ending at random points.
However, I believe clarity is approaching — BTC cannot stay in this tension forever.
It will either break upward or fall lower.
My analysis suggests the next move will be down, and that’s when we’ll see the real market move.
For now — we wait.
___
System first:
Every non-systematic profit is bad.
Every non-systematic loss is bad.
Every systematic profit is good.
Every systematic loss is part of the work.
Was this analysis helpful? Leave your thoughts in the comments and follow to see more.
Marketanalysis

Markets are flashing MAJOR warning signs…Markets are flashing MAJOR warning signs… NASDAQ:QQQ AMEX:SPY
In this video, we will look at the 21 ema on the Daily charts to review the move since April and where we could go from here.
If you have money in this market, you need to see this ASAP 👇

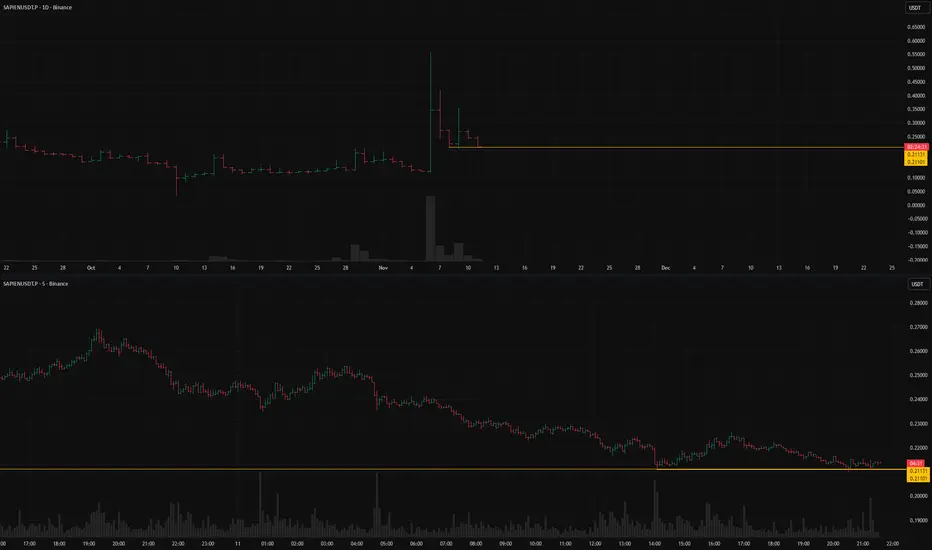
SAPIENUSDT.Pshort setup from daily support at 0.21101BINANCE:SAPIENUSDT.P is currently in a dump phase — a typical development after a strong pump.
The key level is 0.21131, which marked the previous drop’s stopping point.
This level has been confirmed multiple times, and the price is now approaching it gradually.
If low volatility persists and a valid entry point aligned with the trading system appears,
a short setup could be expected with potential continuation to the downside.
Key factors for this scenario:
Price void / low liquidity zone beyond level
Liquidity grab (false move against the trend)
Volatility contraction on approach
Immediate retest
Consolidation with price compression (squeeze)
Closing near the level
Closing near the bar's extreme
Was this analysis helpful? Leave your thoughts in the comments and follow to see more.
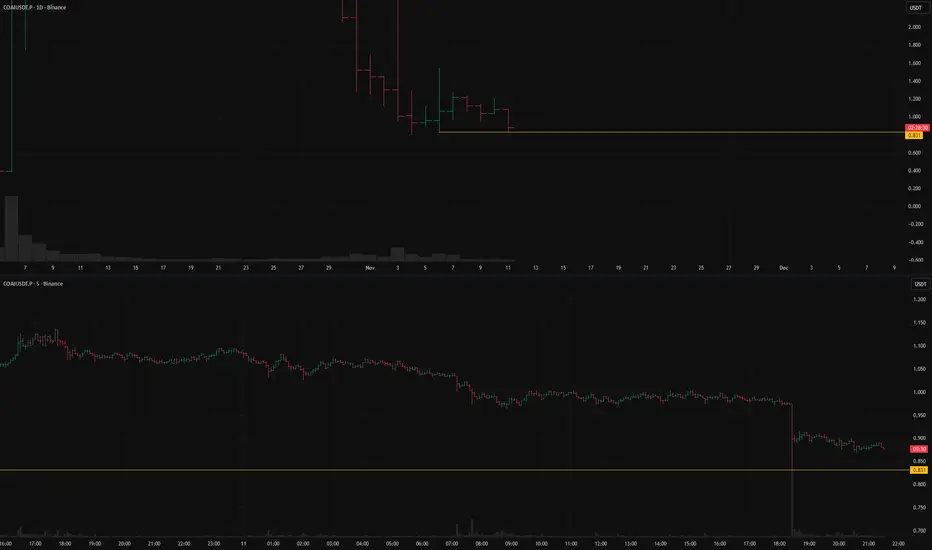
COAIUSDT.P: short setup from daily support at 0.831BINANCE:COAIUSDT.P is currently trading near its historical lows.
The setup looks ambiguous: on one hand, there are signals supporting a continuation of the short trend;
on the other, we might be seeing parabolic-style accumulation.
In any case, a local 5:1 move looks realistic in my view.
The chart stands out because on the lower timeframe, the price hit the support level almost to the tick,
a level formed a few days ago when the asset halted its drop and entered consolidation.
Such precise touches usually indicate a limit player positioned at the level —
and if that level gets broken, the asset could fall sharply.
I expect low volatility near the level,
and an additional confirmation would be a daily close below the current bar’s low or right at the level.
Key factors for this scenario:
Global & local trend alignment
Volatility contraction on approach
Price void / low liquidity zone beyond level
Momentum stall at the level
Immediate retest
No reaction after a false
Closing near the level
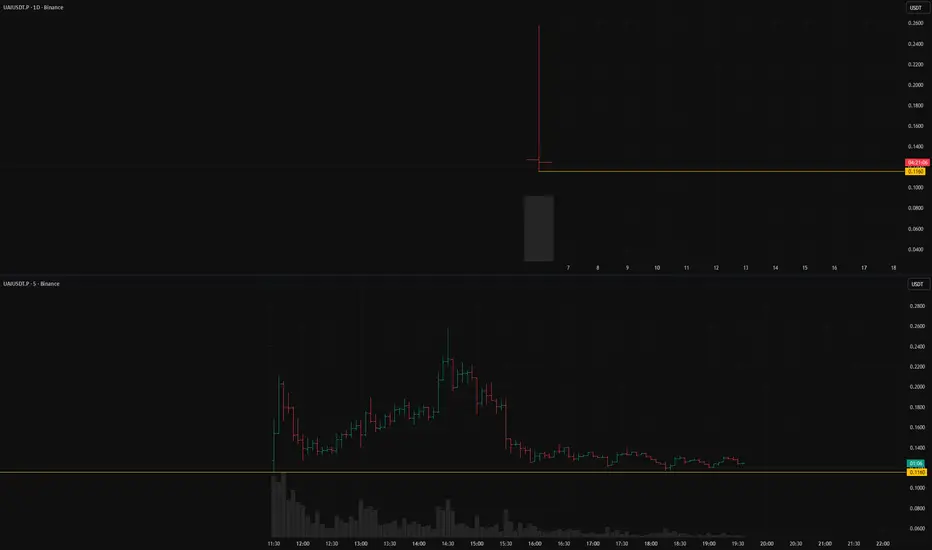
UAIUSDT.P: short setup from daily support at 0.1160UAIUSDT.P initially attempted to move higher after listing, but now the price is at the 0.116 support level.
This level is based solely on the initial listing price, making it critically important — a move below it could trigger an uncontrolled drop.
The asset is consolidating directly above the level, which often precedes a downward breakout.
This creates a potential short setup: low volatility, no signs of recovery, and no visible buying pressure.
The only possible bullish case is if the asset gets “rescued” once it dips below the listing price, though that seems unlikely.
I’d wait for the daily candle to close, and ideally — for the price to remain hovering just above the level tomorrow, showing no buyer strength.
Key factors for this scenario:
Global & local trend alignment
Price void / low liquidity zone beyond level
Volatility contraction on approach
Repeated precise tests of the level
Closing near the level
Closing near the bar's extreme
Factors that contradict this scenario:
Lack of consolidation
Was this analysis helpful? Leave your thoughts in the comments and follow to see more.
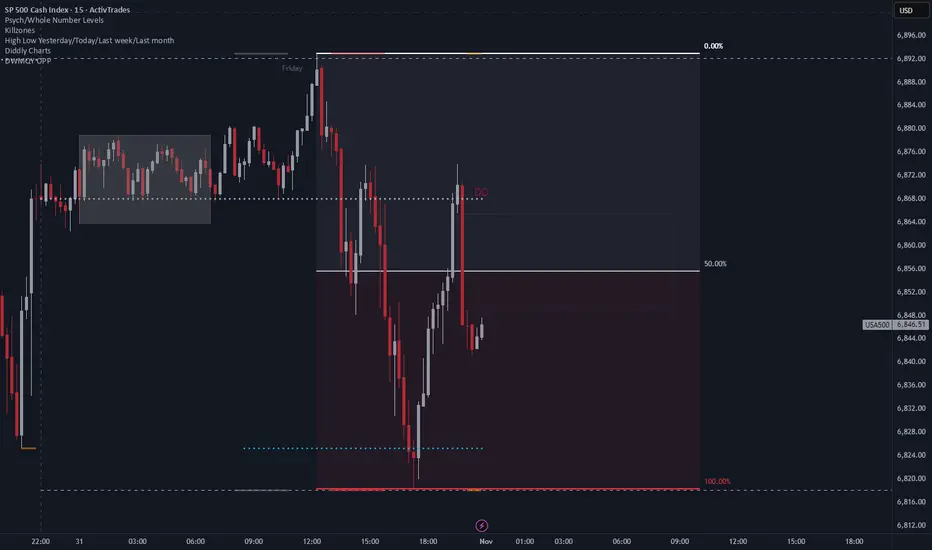
Intraday Range Expansion and Potential Repricing on the SPXFollowing a clean sweep of Friday’s high, price delivered a strong displacement to the downside, breaking short-term structure and rebalancing inefficiencies left behind. The subsequent rebound towards the daily open suggests a retracement into a premium area, potentially setting up for continuation lower if rejection holds around that zone.
If buyers fail to sustain price above the daily open, the market could aim for a full range fill back toward the previous low or discount zones below, maintaining the current bearish intraday order flow.
EUR/USD Elliott Wave Update: Wave (iv) Correction UnfoldingThis EUR/USD chart shows the market undergoing a complex corrective phase, labelled as wave (iv), likely forming a triangle pattern (a)-(b)-(c)-(d)-(e) after an impulsive rally. The correction is taking place within a well-defined base channel, suggesting consolidation before a potential breakout into wave (v) targeting higher levels near 1.19–1.20. As long as the channel holds, the Elliott Wave structure supports a bullish continuation once the correction completes.
Keep following for regular breakdowns as the bigger trend unfolds.

BTCUSDT — Full Report (Oct 31, 2025 09:30 UTC)1. Macro and Fundamental Facts
- US Fed (Oct 30): Rate cut by 25 bps to 3.75–4.00%. This policy easing supports risk assets.
- Quantitative Tightening: From Dec 1 the balance sheet runoff stops; the Fed will reinvest, increasing dollar liquidity.
- US GDP Q3 (preliminary): +3.1% QoQ, confirming a soft landing.
- PCE Inflation (Oct 31, 12:30 UTC): Expected moderate growth; may cause short-term volatility.
- BTC ETFs (US): Mixed flows; after mid-month outflows, moderate inflows observed (Farside). Institutional demand remains stable.
2. Market Statistics (CoinGecko, weekly)
- 7-day range: $108,604–$115,957
- Today's 24h range: $108,201–$113,567
- Mid-point: $112,280
- Range / mid ≈ 6.55%
- October ATH: $126,080 (Oct 6)
- Market has stabilized after the early-October peak around 125‑126k.
3. Sentiment & Forecasts
- Fear & Greed Index: 37 (Fear) → cautious mood.
- Polymarket probabilities for 2025: ≥$130k ≈53%, ≥$150k ≈15%, ≤$80k ≈10%; market volume ≈$38M.
- Social tone: discussion of Fed easing and a possible retest of the ATH.
4. Key Levels This Week
- Support S1: $108.0–$108.6k (lower bound of the 7-day range)
- Support S2: $106–$107k (October accumulation zones)
- Resistance R1: $113–$116k (upper bound of the 7-day range)
- Resistance R2: $118–$120k (gateway to retest $125k).
5. Microstructure (SSE, Binance BTCUSDT)
Snapshot time: 2025-10-31 08:57:51 UTC (real-time SSE feed; delay ~80 ms).
- Last price (LTP): $110,043.82
- Bid / Ask: $110,043.81 / $110,043.82 → balanced.
- Spread: $0.01 ≈ 0.91 m-bps (ultra tight).
- Bid sum (top-20): 0.46 BTC → thin support below.
- Ask sum (top-20): 11.55 BTC → dense overhead layer.
- Imbalance: −0.923 → seller dominance.
- Orders per second: 46 orders/s → active flow.
- Net flow: +0.58 → orders coming into the market; buyers active.
- Micro-price: $110,043.81 ≈ mid → neutral.
- Health score: 80/100 → good liquidity.
Observation: there is instant dominance in the ask side. Order flow is positive, but for price to rise, the cluster at $110,043–110,045 (~5 BTC) must be absorbed. The book below is thin; a downward spike could drop $30–50 without much resistance.
6. Probability Assessment (1-week horizon)
Model: normal distribution around the mid ($112,280) with σ ≈1.64%.
- Range scenario ($109–$114k): ≈60%
- Upward scenario (> $116k; requires inflows): ≈12%
- Downward scenario (< $108.5k; reaction to inflation or ETF outflows): ≈12%
- Tail events (<$106k or >$120k): ≈4–6% each.
Microstructure indicates ask-side dominance, so a short-term pullback within the range is slightly more likely than an immediate breakout.
7. Practical Observations (no advice)
- Spread <1 m-bps → optimal conditions for limit orders.
- Rise in orders/sec above 50 with imbalance moving toward zero → market ready for an impulse.
- Spread >3 m-bps → decreasing depth and higher liquidity risk premium.
- Monitor FGI and ETF flows: FGI >40 and two days of ETF inflows often coincide with a break out of the range.
- Watch Polymarket: an increase in the ≥$150k probability above 20% signals stronger long-term optimism.
8. TL;DR
- The Fed eased policy (−25 bps; QT stop from Dec 1).
- BTC trades between $108.6k and $116k; mid ≈$112k.
- Sentiment is cautious (Fear 37).
- Microstructure: LTP $110,043.82; spread $0.01; ask dominance (imbalance −0.92); 46 orders/s; net flow +0.58.
- Probabilities for the next week: range 60%, upside 12%, downside 12%, tails 4–6%.
- Conclusion: the market is stable within the range; the macro backdrop is softening. A breakout requires absorption of ask clusters and confirmation from ETF inflows.

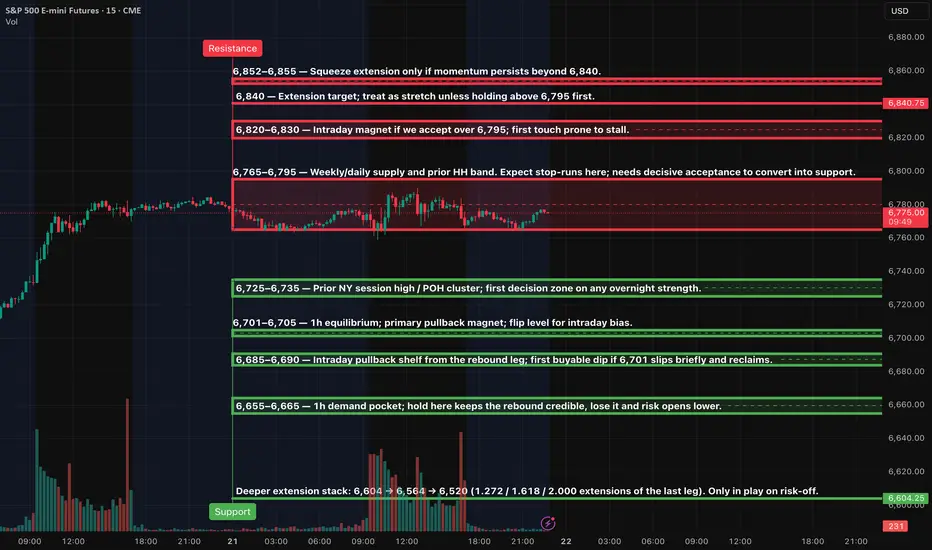
ES (SPX, SPY) Analysis, Key Levels, Setups for Wed (Oct 22)Key catalysts and schedule (ET): The federal shutdown continues, pausing most government statistics. There is no 8:30am tier-1 macro release expected. The energy markets will receive the EIA Weekly Petroleum Status Report at 10:30am. Of particular note, the Fed’s Michael Barr is scheduled to speak during the U.S. day, a potential market-moving event. Earnings reports from AT&T, Thermo Fisher, Boston Scientific, and Vertiv before the open, and IBM after the close, could also sway the index mood.
Key zones — resistance: The 6,765–6,795 zone, serving as the weekly/daily supply and prior high-high band, remains a crucial area of focus. It is the first ceiling to consider. The 6,820–6,830 zone becomes an intraday magnet if we manage to hold above 6,795. The 6,840 stretch target is a significant level that requires time above 6,795 first. The 6,852–6,855 zone is a potential squeeze extension, but only if momentum persists beyond 6,840.
Key zones — support: 6,725–6,735 is the prior NY session high / POH pocket and first decision area on any overnight strength that fades; 6,701–6,705 is the 1h equilibrium and flip line for intraday bias; 6,685–6,690 is the intraday pullback shelf and first buyable dip if 6,701 briefly slips and reclaims; 6,655–6,665 is the 1h demand pocket that keeps the rebound credible; 6,604 is the deeper extension stack that only comes into play on risk-off.
Overnight → NY forecast: baseline expectation is a range build under the 6,765–6,795 ceiling with stop-runs into the band and fades back toward 6,735 and 6,705; acceptance and sustained holding above 6,795 turns the tape constructive toward 6,820–6,830, with a paced push to 6,840 and only a momentum extension opening 6,852–6,855; loss of 6,701 during Asia/London that does not quickly reclaim tilts the path toward 6,690 and 6,665 before buyers try again; if 6,665 gives way decisively, risk opens to 6,604 where a larger bounce attempt is favored.
Setups (Level-KZ Protocol, 15m→5m→1m)
Short fade at the 6,765–6,795 band on the first clean test: enter on a 15m close back inside the band and a 5m re-close with a lower-high; place SL above 6,805–6,810; target 6,735 for TP1, 6,705 for TP2, 6,690 for TP3; if TP1 prints, close 70% and set the 30% runner to BE.
Long continuation only after real acceptance above 6,795: wait for a 15m full-body close above, then buy the 5m pullback that holds 6,795–6,800; SL 6,785; target 6,820–6,830 for TP1, 6,840 for TP2, 6,852–6,855 for TP3.
Quick-reclaim bounce at 6,701–6,705: if we sweep 6,701 and instantly reclaim on 1m/5m, buy the reclaim with SL 6,695; target 6,735 for TP1, 6,771–6,780 for TP2, 6,795 test for TP3.
Deeper flush-and-reverse at 6,655–6,665: buy only on confirmation (15m wick-rejection + 5m higher-low); SL 6,649; target 6,690 for TP1, 6,705 for TP2, 6,735 for TP3.
Bear continuation only if 6,701 is lost and holds below: sell the underside retest of 6,701–6,705; SL 6,712; target 6,690 for TP1, 6,665 for TP2, 6,604 extension for TP3 if momentum expands.
Bias and invalidation: The market currently exhibits a ' two-sided bias ', meaning it is neither bullish nor bearish, while we are trapped between 6,705 and 6,795. The tape turns constructive for extensions only after holding above 6,795 for multiple 15m closes. The intraday bias flips lower if we slip and cannot reclaim 6,701 on 15m closes. Invalidate any long if 6,665 breaks and holds; invalidate any short if we base above 6,830 and the first pullback defends 6,820.
Kill-zones and execution plan: Asia (20:00–00:00 ET) is optional and sized down; look for the 6,701 sweep/reclaim; London (02:00–05:00 ET) favors range probes into 6,735 or 6,705; NY AM (09:30–11:00 ET) is primary — fade the first touch of 6,795 if we gap under it, or buy the 6,795 pullback if we gap and hold above; manage lunch as maintenance only (12:00–13:00 ET); NY PM (13:30–16:00 ET) allows a final push toward 6,840 only if 6,820–6,830 converts to a floor.
Risk and management rules (applied to all plays): use a hard stop anchored to the relevant 15m wick ±0.25–0.50; take no partials before TP1; at TP1 close 70% and move the runner to BE; allow no more than two attempts per level per session; time-stop any trade that hasn’t hit TP1 or SL within 45–60 minutes.
BTC: Monthly FVG Retest Before New ATHCurrent Status: The price is around $104,447 and is currently in a strong corrective move after reaching a recent high.
All-Time High (ATH): The previous peak is marked near $126,311. This is the key long-term target.
Monthly Fair Value Gap (FVG): The blue box between approximately $95,000 and $98,000 is a "Monthly FVG". This area is expected to act as a magnet for the price to retrace to.
Projected Path: The analyst expects the price to drop further into the Monthly FVG (the $95k - $98k zone) before finding strong support. Following this test, a major rally is projected to push the price back up to hit the All-Time High near $126,311.
The main idea is a deep correction to a technical support level (FVG) followed by a bullish continuation to a new ATH.

Bitcoin (BTC/USD) Bearish Continuation After Liquidity GrabThe BTC/USD daily chart shows a bearish structure forming after a sharp rejection from the upper resistance area near $116,000–$117,000. The large red candle at the top indicates a strong liquidity sweep, where price briefly moved higher to collect buy-side liquidity before reversing downward.
Following this, a series of smaller candles suggest consolidation under the resistance zone, with a clear lower-high formation, signaling potential continuation to the downside. The blue-shaded box represents a premium zone (supply area) where sellers are expected to remain dominant.
The projected black arrow path on the chart shows an anticipated pullback toward the mid-level ($112,000–$113,000) before continuation of the bearish move targeting the $108,000–$109,000 zone — a potential demand or support area.
Summary:
Trend: Bearish continuation
Key resistance: $115,000–$117,000
Short-term pullback: $112,000–$113,000
Target zone: $108,000–$109,000
Market sentiment: Bearish after liquidity grab and lower-high formation

Gold Eyes New All-Time High
You said:
btcusd rinning 600+ pips in my direction . translate into german
ChatGPT said:
BTC/USD läuft mit über 600 Pips in meine Richtung.
You said:
translate it into spanish
ChatGPT said:
BTC/USD va con más de 600 pips a mi favor.
You said:
translate into russian
ChatGPT said:
BTC/USD движется в мою сторону более чем на 600 пунктов.
You said:
Ethusdt gone 350+bin my direction after touching fvg, nake ut professionals
ChatGPT said:
ETH/USDT moved 350+ pips in my direction after touching the FVG — a clean and professional move.
You said:
translate it into german
ChatGPT said:
ETH/USDT lief über 350 Pips in meine Richtung, nachdem es die FVG berührt hatte – eine saubere und professionelle Bewegung.
You said:
translate into russian
ChatGPT said:
ETH/USDT прошёл более 350 пунктов в мою сторону после касания зоны FVG — чёткое и профессиональное движение.
You said:
translate into spanish
ChatGPT said:
ETH/USDT se movió más de 350 pips a mi favor después de tocar la zona FVG — un movimiento limpio y profesional.
You said:
Uploaded image
analyze this chart describly and give suitable title
ChatGPT said:
🟡 Chart Analysis: Gold (XAU/USD) — Daily Timeframe
Overview:
This chart presents a bullish continuation setup for Gold (XAU/USD) on the daily timeframe. The market has recently shown strong upward momentum, forming several large bullish candles after a period of consolidation.
Key Observations:
Recent Momentum:
A strong bullish rally has pushed the price upward, indicating renewed buyer interest and institutional activity.
Retracement Zone:
The highlighted green area represents a potential retracement or re-entry zone. Price is expected to pull back into this area before resuming its upward trajectory.
Stop Loss Placement:
The red zone beneath the retracement area marks the stop-loss level around $4,026, strategically placed below recent swing lows for risk management.
Target Level:
The target zone is aligned with the All-Time High (ATH) around $4,200, which serves as a key psychological and technical resistance level.
Projection Path:
The chart’s white and black arrows illustrate an expected bullish impulse–retracement–continuation pattern, suggesting the price may briefly correct before surging to new highs.

Bitcoin Faces Sudden Shakeout After Weeks of CalmBitcoin Volatility Returns as Market Momentum Resets
Hello Traders,
The Bitcoin market experienced a sudden burst of volatility in the recent session, ending a period of relative calm. On the 4H timeframe (Binance), intense selling pressure drove prices from near $117,000 down to roughly $109,000 before stabilizing around the $112K region. The swift decline marked a clear shift in short-term momentum, showing that buyers are beginning to lose dominance as broader market sentiment cools.
This pullback unfolded against a backdrop of renewed global uncertainty. A series of trade-related policy headlines reignited risk aversion, while continued strength in the U.S. dollar added additional stress to crypto markets. Institutional flows briefly reversed, signaling reduced confidence in near-term upside potential. The result was a wave of forced liquidations, magnified by leverage, as traders rushed to adjust exposure during the drop.
Despite the intensity of the move, market conditions remain structurally healthy. On-chain data shows that long-term holders are largely unmoved, suggesting this phase is more of a short-term repricing than a major cycle reversal. Derivative markets, however, have cooled significantly — open interest has thinned, and funding rates have normalized, indicating a temporary reset in speculative participation.
In the coming days, Bitcoin’s behavior will likely depend on liquidity dynamics rather than new macro data. With upcoming U.S. economic reports delayed and the dollar holding firm, volatility may persist as traders respond to headlines and reposition ahead of the next policy developments.
For now, the market appears to be in a state of balance after rapid liquidation. Whether this forms a new accumulation base or precedes deeper correction will depend on how quickly momentum returns. The broader sentiment remains cautious but stable — a waiting phase, as the market tests its conviction once more.

EUR/USD – Bearish Continuation in MotionEUR/USD continues to display a bearish market structure, reflecting persistent downside pressure as the euro struggles to maintain stability against the U.S. dollar. Recent price action shows a period of consolidation followed by a liquidity grab near short-term highs, indicating that buyers are losing strength and the market is positioning for a potential continuation of the decline. The broader market tone suggests that sentiment remains cautious, with traders favoring the dollar due to its resilience amid global uncertainty and steady U.S. economic performance. The pair’s inability to establish higher highs further confirms weakness in bullish momentum. This behavior often signals distribution, where institutional players offload long positions before another leg downward. Short-term movements could still present small corrective bounces as the market seeks liquidity, but overall conditions favor sellers. Unless a strong shift in macro sentiment occurs, EUR/USD is likely to maintain its downward trajectory, targeting lower levels as the bearish momentum unfolds and traders continue aligning with dollar strength.

VeChain (VET) – Key Support Test & Long SetupVET is currently retesting a major support zone, presenting a solid opportunity for a long spot position ahead of what could be a Q4/year-end rally.
📉 Entry Zone: $0.0215 – $0.02245
📈 Targets:
• TP1: $0.026 – $0.028
• TP2: $0.03 – $0.0325
🛑 Stop Loss: Below $0.02

WEEKLY MARKET ANALYSIS-DXY, BTC,ETH, NAS100,SPX,XAU,XAGThis weekend's analysis will cover the Dollar Index, Bitcoin, Ethereum, NAS100, SPX500, Gold and Silver.
The DXY has found a strong support on both the monthly and daily charts. DXY has officially also broken it's weekly closing resistance level and I think a shift in momentum will propel DXY up higher in the next week towards a target zone of 99 to 99.600.
Bitcoin is still in a correction and currently paused on the weekly 21 EMA, I think it's consolidating sideways and will continue selling to the intended target of $102k in the coming week.
ETH nicely came to the previous resistance and seems to find some buyers there but there is no momentum or RSI strength to support an upward move, so I am bearish on ETH and think the price will fall some more into the target zone below $3,823.
NAS100 and SPX500 are also looking quite over stretch on it's Bollinger Bands and KC channels on the weekly charts, with weekly bearish candles suggesting a pullback in the equities is very likely in the next coming week.
Gold and Silver are in a strong uptrend and the uptrend will continue but I see profit taking on the charts. I expect some sideways consolidation and a minor pullback before the bullish continuation.
I thank you for listening to my publications and I wish you a great trading week. Cheers everybody!!

THE KOG REPORT THE KOG REPORT:
In last week’s KOG Report we said we would be looking for price to support at the beginning of the week, hopefully in to the red box, and then push upside into the higher red box. This move worked well for the long trade, however, it was at that region we ideally wanted to short back down into the lower liquidity pools. We didn’t get this move due to the red box breaking above, so we continued with the bias and the target levels and managed to complete some fantastic long trades, as well as an extremely decent short hitting Excalibur on the nose.
Not a bad week, even though the plan wasn’t as successful as tends to be.
So, what can we expect in the week ahead?
We had bullish Friday after the break out, but the last few hours you can see some profit taking in process. We’re now still above our bias level 3740-45 but the issue we have here is there is still no breach of the red box defence above, which again held strong late session on Friday. We’re also flagging which is another concern, so, for that reason, we’ll say, resistance above is the 3767-75 region, which if targeted and held during the early session can take us back into the order region 3750-40 which is where a potential opportunity may come to attempt the long trade upside to target that all time high again.
Please note, the 3795-3810 needs a strong daily close above it to go higher, so we won’t be looking to get trapped high in a potential move that can turn again! That for us is the level to watch if price attempts that level.
We have a lot of news this week including NFP, with tomorrow looking like it could be a ranging day playing those order regions.
It's the last few days of the month, so we'll have to play level to level intra-day and wait for the monthly close for a clearer picture. Right now, levels are level, boxes are boxes, we'll stick with the plan and move with the market where ever it goes.
RED BOX TARGETS:
Break above 3765 for 3773, 3777, 3785, 3796 and 3802 in extension of the move
Break below 3750 for 3744, 3740, 3732 and 3720 in extension of the move
Please do support us by hitting the like button, leaving a comment, and giving us a follow. We’ve been doing this for a long time now providing traders with in-depth free analysis on Gold, so your likes and comments are very much appreciated.
As always, trade safe.
KOG

Anant Raj Ltd. (Weekly)✅ Buy above: ₹685 (sustained breakout with volume)
🎯 Target: ₹729 / ₹800
🛑 Stoploss: ₹645
⚡ Key Level: Near 0.618 Fibonacci retracement + volume buildup.

Market Weekly Wrap – Nifty & S&P 500 AnalysisNifty had a tough week, closing at 24654, down 673 points (-2.7%) from last week’s close. This was exactly in line with the downtrend warning I’ve been sharing over the past 3-4 weeks.
Key Highlights:
Weekly Range: High 25331 – Low 24629
Two-Week Correction: Down 3.15% from the recent high of 25448
Key Support Levels: 24474 / 24500 – watch closely!
If Nifty holds 24474/24500, we could see a short-term bounce of 1–2% toward 24950/25000.
But below 24300, brace for a deeper correction — Nifty could retest 23185 support levels.
Investor Tip:
The old saying still applies: "Be greedy when others are fearful."
This is a great time to start deploying capital — either by picking fundamentally strong stocks or through SIP/MF/ETF routes. If the market dips further, you’ll get opportunities to average your positions at better prices.
Sector to Watch Next Week: METALS — this sector looks strong and can outperform if market sentiment turns positive.
My Nifty Range for Next Week: 25050 – 24250
A breakout or breakdown beyond this range could trigger fast, directional moves.
US Markets – S&P 500 Update:
S&P 500 closed at 6643, down just 20 points, holding strong near its key Fibonacci support at 6568.
Upside Levels: Needs to sustain above 6689 for targets at 6780 / 6930 / 6959
Downside Risk: Below 6568, watch for 6502 / 6454 / 6376
Pro Tip: Keep a trailing stop-loss (SL) at 6524 to lock in profits
📌 Key Takeaways:
✅ Market correction was expected – use this opportunity wisely
✅ Watch 24474 support for potential bounce
✅ Metal sector could lead gains next week
✅ S&P 500 holding key support, but keep SLs in place

Liquidity Shift Suggests Extended Bearish CycleThe market is showing a progressive decline after losing upward strength. Recent swings indicate a decisive bearish control, with successive shifts in structure confirming the downward pressure. Attempts to recover higher levels have been shallow, reflecting exhaustion on the buy side and stronger liquidity flow toward sellers.
Market behavior suggests that rallies are being used as opportunities to exit or reposition short rather than initiate sustained bullish momentum. This is consistent with the overall weakening tone across the chart, where volatility spikes have favored downward extensions.
Looking ahead, if the current pace of distribution continues, the market is likely to maintain a bearish trajectory with potential for deeper declines as liquidity seeks out lower price ranges.

Gold at Key Resistance: Watching 3745 Support vs 3780 Breakout (Gold (XAUUSD) is pressing into resistance near 3780 while holding strong above key support at 3745. The bigger picture remains bullish, but we are at an important decision point.
Macro Drivers
📉 US10Y nominal yield easing (4.10%) → supportive for gold.
💵 DXY drifting lower (97.2) → dollar weakness tailwind.
📈 Real yields (DFII10 at 1.78%) ticking slightly higher → mild headwind.
📊 GLD ETF still making new highs → strong institutional demand.
🛡️ VIX creeping up (16.6) → safe-haven premium adding support.
🔮 T5YIE flat (2.42%) → inflation expectations stable.
⚪ Silver (XAGUSD ~44) lagging slightly → not fully confirming gold’s strength.
Levels to Watch
• 🔺 Resistance: 3780 → 3810 → 3850
• 🔻 Support: 3745 → 3726 → 3680
Trade Scenarios
1. ✅ Breakout Buy: If 4H closes above 3780 with weak DXY + easing yields, target 3810 → 3850. Stop below 3745.
2. ✅ Pullback Buy: If price dips to 3745–3750 with GLD still rising, re-entry zone. Stop 3726, targets 3780 → 3810.
3. ⚠️ Avoid Longs: If DXY >98 + US10Y >4.25 + real yields rise, gold likely retests supports.
Bias remains bullish, supported by flows and a weak dollar, but near-term price action is stretched. I’m looking to either buy dips into 3745–3750 or wait for a confirmed breakout above 3780.
🔹 Sharing my driver-based setup so others can track gold beyond price alone. Feedback welcome. Let’s trade smarter together.

GOLD COME BACK BULLISH TREND AND HIT ZONE 3700 - 3705 ☄️ Gold Market Outlook 09/22 (Based on SMC) ☄️
📊Market Structure
🔤The overall structure is bullish after multiple bullish BOS.
🔤Every pullback has been absorbed at FVG demand zones, confirming strong buyer control.
🔤Current price is around 3692 after a fresh BOS, showing Smart Money is still pushing higher.
💡 Trade Plan
🔼Scenario 1 – Continuation Buy (Main Plan)
Entry Condition: Price retests 3685 – 3688 or 3675 – 3680 with a bullish CHoCH confirmation on M5/M15.
Reasoning: Overall bullish trend, demand zones consistently defended by Smart Money.
Entry: Buy at 3685-3688 or 3675-3680.
🔽Scenario 2 – Short-term Sell (Counter-trend)
Entry Condition: Price taps into 3700 – 3705 and shows bearish CHoCH on lower timeframes.
Reasoning: Supply zone + psychological resistance likely to trigger profit-taking.
Entry: 3702 – 3705.
🔼Scenario 3 – Breakout Buy (Confirming Buyer Strength)
Entry Condition: H1/H4 candle closes above 3705 with strong volume.
Reasoning: Clear breakout from key resistance + new bullish BOS confirmation.
Entry: Buy after a retest of 3700 – 3705.
➡️ Focus on buy setups (Scenarios 1 & 3) in line with the bullish trend.
The sell scenario is only valid for short-term scalping.

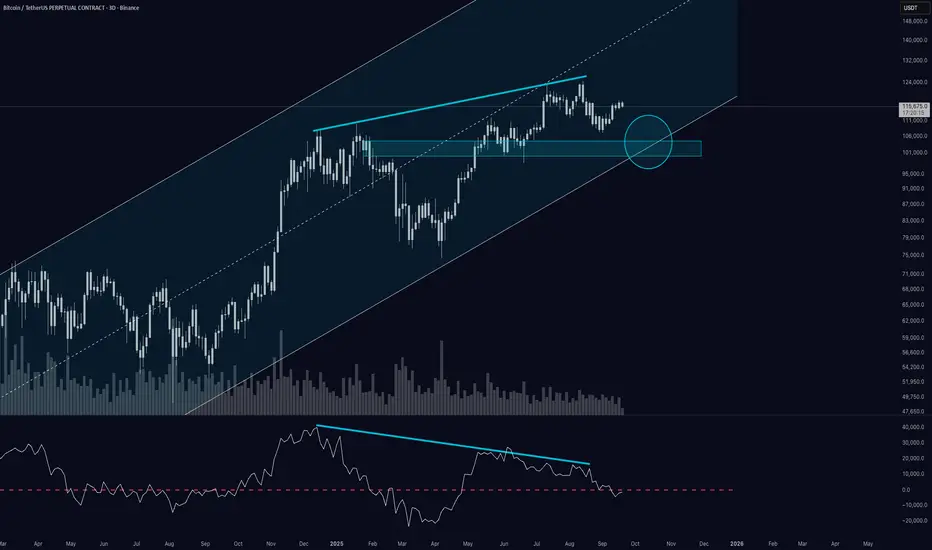
Is Bitcoin Losing Momentum?On the 3-day chart, Bitcoin continues to respect its long-term ascending channel, with both the upper and lower boundaries acting as clean structural guides.
🔹 Momentum: After months of strength, momentum has slipped below the 0-line and is currently retesting it – a key pivot that often defines whether trend continuation or correction follows.
🔹 Structure: The lower boundary of the channel lines up almost perfectly with the horizontal support zone built from previous highs (around 100k–103k). This confluence makes it a natural candidate for a pullback area.
🔹 Volume: A noteworthy observation is the declining volume profile during the most recent leg higher – a potential early warning that participation is fading.
If the 100k–103k support area holds , the long-term uptrend remains intact.
But a decisive breakdown could open the door to a deeper correction.
👉 What do you think – is Bitcoin gearing up for another strong bounce off the channel, or are we on the edge of a deeper retracement?
Let’s discuss in the comments.
Disclaimer: This is a market observation, not financial advice.