THE CRYPTO MARKET IS HEATING UP AGAIN!If you feel like crypto is “waking up” after a long period of silence, you’re not wrong. Recent signals suggest that the cryptocurrency market is entering a new active phase—where capital flow, market sentiment, and price structure are starting to align once again.
This article is not meant to hype FOMO. Instead, it aims to help you clearly understand what’s really happening—so you can approach the market with a calmer, more strategic mindset.
1️⃣ What’s making crypto “hot” again?
There are three main factors acting on the market at the same time:
🔹 1. Capital is rotating back into risk assets
As expectations around global interest rates ease, investors are gradually moving away from a defensive stance. Crypto—being highly sensitive to capital flows—reacts very quickly.
👉 Simply put:
Money starts searching for higher returns → crypto comes back into focus.
🔹 2. The technical structure is being “repaired”
After months of heavy volatility, many major coins have:
- Formed higher lows
- Broken out of prolonged accumulation zones
- Held price firmly above key support levels
These are signs that selling pressure is weakening and buyers are beginning to control the market’s rhythm.
🔹 3. Market sentiment has clearly shifted
Previously:
- Good news → weak price reaction
- Bad news → sharp sell-offs
Now:
- Bad news → price no longer drops deeply
- Good news → price reacts very quickly
👉 This is often an early signal of a new bullish cycle, when “sellers are exhausted.”
2️⃣ Is crypto really trending up—or is this just a bounce?
This is a question many traders are asking—and it’s the right one.
The difference lies in the nature of the price movement:
❌ Technical bounce: fast rallies that fail to hold structure → easily sold into
✅ New trend: rise → pullback → continuation, with higher lows over time
At the moment, many charts suggest the second scenario is gaining the upper hand—although the market has not entered an uncontrolled, euphoric rally yet.
👉 That’s a good thing. Sustainable trends usually begin with doubt, not extreme excitement.
3️⃣ What should investors & traders do right now?
🔸 For short-term traders
- Avoid chasing price after strong bullish candles
- Focus on pullbacks into structure
Manage risk tightly, as volatility is likely to increase
🔸 For mid-term investors
- Observe how price reacts during corrective phases
- No need to “catch the bottom”—just follow the trend
- Scale in gradually; avoid emotional all-in decisions
4️⃣ One very important thing to remember
💡 A heating market does not mean everyone will make money.
In fact, this phase often separates:
- Traders with a plan → steady growth
- Traders without discipline → costly mistakes
- Crypto always offers opportunities—but it only rewards those who are patient and systematic.
🔚 Conclusion
The crypto market is entering a new, energetic chapter.
Fear has eased—but blind optimism is not yet justified.
👉 Stay focused on:
- Capital flow
- Market structure
- And always put risk management ahead of profit
If you can do that, this cycle may turn out to be one of the best opportunities you’ve ever seen.
📌 If you found this article helpful, feel free to leave a 👍 or share your perspective in the comments. Markets are always better when we learn together.
Marketcycle

QQQ – Weekly Update | Breakout Being TestedThesis
QQQ remains in a late-stage bullish structure. Price is testing the upper boundary of a bullish wedge, with Wave 5 still the primary scenario while key supports hold.
Context
- Weekly timeframe
- Long-term bull trend intact
- Market approaching the final phase of the broader cycle
What I see
- Price tested the wedge breakout level twice this week
- Weekly close held right on the breakout line near $623
- 50-day MA has now been tested and appears to be flipping to support
- Structure remains compressive, not distributive
What matters now
- Breakout level needs to be clearly flipped to support to confirm continuation
- Market is not pricing near-term event risk (tariff ruling next week) as bearish
- As long as price holds above the $600 area, upside structure remains intact
Buy / Accumulation zone
- No aggressive adds at current levels
- Long-term accumulation remains near the $440 area (200WMA confluence)
Targets
- Primary Wave 5 reference: $720–$725 area (2.618 Fib)
Risk / Invalidation
- Loss of $600 and failure to hold the wedge breakout would shift the structure to consolidation

SPY – ATH into Heavy Macro Week | Trend Still IntactThesis
AMEX:SPY continues to trade in a mature but intact bullish cycle, pushing to new all-time highs despite a heavy macro and event-driven calendar.
Context
- Weekly timeframe
- CPI, PPI, Jobless Claims ahead
- Start of key earnings season
- Supreme Court ruling delayed into next week, adding uncertainty
What I see
- Market printed another ATH and closed the week at the highs
- Price remains well above rising trend support
- No visible distribution or topping structure yet
- Momentum remains strong despite known macro risks
What matters now
- As long as price holds above the rising channel, the trend remains bullish
- Last CPI print came in much cooler than expected
- A second consecutive soft CPI would confirm a disinflation trend and likely fuel further upside
- Market is clearly not pricing near-term stress
Buy / Accumulation zone
- This is not an area for aggressive new buying
- Focus shifts from adding risk to managing and cleaning the portfolio
- Selectively trimming positions that fully rode the last 5–6 years of the cycle
Targets
- Trend-following extension remains open toward higher Fib projections
- No confirmed cycle top yet
Risk / Invalidation
- A sustained loss of the rising channel would signal the need to reduce exposure
- Until then, price action favors holding, not anticipating a top

USDJPY H4 Pullback and Bullish Continuation Toward 157.7📝 Description
USDJPY on H4 is trading inside a bullish corrective leg after a strong impulse. Price has reacted cleanly from H4 BPR + FVG, holding above discount and showing signs of continuation rather than reversal. Structure remains bullish as long as price stays supported above the recent mitigation zone.
________________________________________
📈 Signal / Analysis
Primary Bias: Bullish continuation while above 156.00–156.10
Long Setup (Preferred):
• Entry (Buy): 156.3
• Stop Loss: Below 156
• TP1: 156.85
• TP2: 157.25
• TP3: 157.68 (HTF liquidity)
________________________________________
🎯 ICT & SMC Notes
• Strong bullish impulse followed by healthy pullback
• Price respecting H4 BPR + FVG confluence
• BSL resting above recent highs
• No bearish CHOCH on HTF
________________________________________
🧩 Summary
This looks like a classic pullback-for-continuation setup. As long as price holds above the mitigation zone, odds favor a push toward 157.2 and 157.7 liquidity. Shorts only make sense if structure breaks.
________________________________________
🌍 Fundamental Notes / Sentiment
USDJPY remains sensitive to US yields and BOJ expectations. Any delay in BOJ tightening or strength in US data can fuel further upside, keeping the bullish continuation scenario intact.
________________________________________
⚠️ Risk Disclosure
Trading involves substantial risk and may result in capital loss. This analysis is for educational purposes only and does not constitute financial advice. Always apply proper risk management, predefined stop-loss levels, and disciplined position sizing aligned with your trading plan.

Surviving this market for 10 years taught me thisI’ve been trading this market for over 10 years.
In the beginning, all I cared about was how much I could make.
That’s what most people focus on.
What I learned the hard way is this:
If the account doesn’t survive, nothing else matters.
No funds means no next trade.
No next trade means no edge, no learning, no comeback.
There were long periods where I wasn’t making money.
But I was protecting my ability to stay in the game.
That mattered more than being right.
This chart isn’t about profits.
It’s about still being here.

Sentiment cycle. Two sentiments and FUD.Based on Livermores "opposite day trading", Qullamaggies 10/20/50.
Livermores emotion cycle doesn't fully explain price dynamic. In practice markets or crowd have a clear sentiment of "safety" and trust. and "danger" and distrust.
You can have a strong market... that breaks and starts crashing --> You know the sentiment wont be the same. You see some risk taking fomo.. but it doesnt end nowhere. Because the core of every strong market is strong momentum technicals or setup. Odds in your favor etc.
It's very clear where the SENTIMENT (cycle) shifts to crashing and "it wont be the same anymore". towards risk on (setup).
Categorizing all market on RISK-ON, RISK-OFF (at near term) wouldnt explain the dynamic either... because like most of the time (maybe 80%) market is on a FUD mode.
Livermore was good at explaining crowd temperature.
Something could be bullish, but still on FUD mode -> and you get these tiny sell offs, losing due to SL or selling on fear.
clear "RISK ON" is where, based on Qullamaggie, there are strong upsloping quick MAs (10/20/50). --> best explanation would be that people trust in the market. It's hard to lose, when everyone throws money at market.
eventually it leads to FUD channels etc. or corrections.
Even today --> there do always be some chance, that market just crashes. No guarantees. Strong technicals but FUD sentiment.
//April, May, June were all FUD.. fear uncertainty doubt.
Livermore said there was only two emotions, Fear and Greed.

A new age dawns, one cycle must yield to the next?🧭 Monthly Chart Context
From the 2022–23 cyclical bottom ($15K–$16K), #Bitcoin has climbed through multiple Gann angles — each line marking the balance between time ⏳ and price 💰.
🔍 Current Setup
BTC is trading around $113K, sitting just below the 1/1 line — the “perfect balance” of trend and time.
A monthly close above = trend acceleration 💨
A rejection here = temporary exhaustion ⚠️
🧠 Summary Insight
• Macro: Still bullish, riding the upper half of the fan 🌕
• Mid-term: Expect resistance + cool-off before next leg 🧊
• Invalidation: Monthly close below 2/1 (~$90K) = trend weakness 🚫
When the golden line kisses the last cycle high —
it’s to say goodbye.
A new age dawns,
one cycle must yield to the next. ♻️⚡

Dogecoin is about to blast off! Study internet bubble stocks.I believe Dogecoin will see a strong run all the way to a new all-time high. When you study other market cycles, like Apple during the internet bubble, you see the same story told over and over again with subtle differences. Watch for a big bull market ahead.
As always, stay profitable.
– Dalin Anderson

American Eagle looks like Litecoin did before its pump in 2017.Buying American Eagle looks really smart here. We could see a Litecoin-esque pump similar to 2017. This would, of course, lead to a large bear market, but in the meantime, the stock is looking very bullish and ready for a parabolic run. Loving this setup.
As always, stay profitable.
- Dalin Anderson

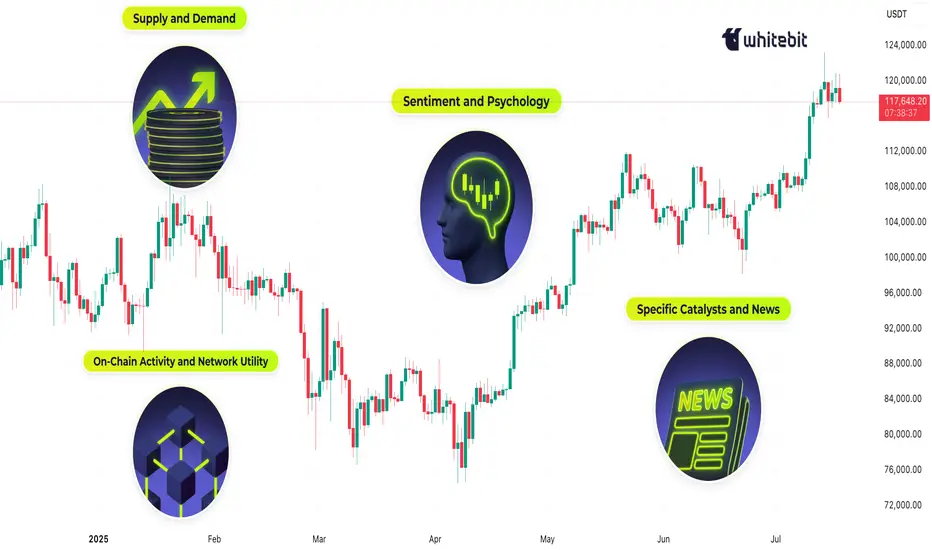
What Moves the Crypto Market?Hello, Traders!
If you’ve spent any time staring at crypto charts, you’ve probably asked: “Why is this happening?” And the truth is… there’s never one simple answer.
Crypto markets are complex, global, 24/7 systems. The forces behind a price move can be technical, fundamental, psychological or all at once. So let’s unpack what really moves this market.
1. Supply and Demand — The Fundamentals Behind the Volatility
At its core, crypto prices are governed by supply and demand. If more people want to buy than sell, the price goes up and vice versa. But it’s not that simple.
Take Bitcoin. It has a fixed max supply of 21 million, and most of those coins are already mined. But available liquidity on exchanges is much smaller and this is where things get interesting. During bull markets, demand surges while liquid supply dries up. That creates parabolic moves. Then you have supply unlocks, token vesting schedules, and inflationary emissions all of which affect how much of a coin is flowing into the market.
Example: When Lido enabled ETH withdrawals in 2023, it shifted the ETH supply dynamics, some saw it as bearish (more unlocked supply), others bullish (greater staking confidence).
2. Sentiment and Psychology: Fear & Greed Still Rule
If you want to understand the crypto market, start by studying people. Emotions drive decision-making, and crypto is still largely a retail-dominated space. Bull runs often start with doubt, accelerate with FOMO, and end in euphoria. Bear markets move from panic to despair to apathy. The crypto psychology chart rarely lies, but it always feels different in real time.
The classic “psychological numbers in trading”, like $10K, $20K, $100K BTC, often act as invisible walls of resistance or support. Why? Because traders anchor to these round levels.
👉 We’ve covered this phenomenon in detail in a dedicated post “The Power of Round Numbers in Trading.” Highly recommend checking it out if you want to understand how these zones shape market psychology and price action.
3. On-Chain Activity and Network Utility
Fundamentals matter. But in crypto, fundamentals are on-chain. The transparency of blockchain networks provides valuable insights into fundamental usage and investor behavior, which often foreshadow price trends. On-chain metrics such as active addresses, transaction volumes, and wallet holdings offer insight into the health and sentiment of the crypto ecosystem:
Network Usage (Active Addresses & Transactions): A growing number of active addresses or transactions might indicate rising network demand and adoption. Empirical studies have found that BTC’s price strongly correlates with its on-chain activity – increases in the number of wallets, active addresses, and transaction counts tend to accompany price appreciation.
Exchange Inflows/Outflows: Tracking the movement of Bitcoin or Ether in and out of exchanges provides clues to investor intent. Large outflows from exchanges are often bullish signals – coins withdrawn to private wallets imply holders are opting to HODL rather than trade or sell, tightening the available supply on the market. For example, in late March 2025, as Bitcoin neared $90,000, exchange outflows hit a 7-month high (~11,574 BTC withdrawn in one day) mainly by whale holders, indicating strong confidence.
Mining Activity and Miner Behavior: In Proof-of-Work coins like Bitcoin, miners are forced sellers (regularly selling block rewards to cover costs), so their behavior can impact price. Periods of miner capitulation, when mining becomes unprofitable and many miners shut off or sell holdings, have historically aligned with market bottoms.
For example, in August 2024, Bitcoin experienced a miner “capitulation event”: daily miner outflows spiked to ~19,000 BTC (the highest in months) as the price dipped to around $ 49,000, suggesting that miners had dumped inventory as profit margins evaporated. Shortly after, the network hash rate quickly recovered to new highs, indicating that miners’ confidence was returning, even as the price was low.
Final Thoughts
In conclusion, the crypto market’s price movements are driven by a complex interplay of factors… Market sentiment and psychology can override fundamentals in the short run, leading to euphoric rallies or panicked crashes. On-chain metrics provide the ground truth of user adoption and big-holder behavior, often signaling trend changes before they happen. Halvings and tokenomics remind us that the code underlying these assets directly affects their value by controlling supply. And finally, specific catalysts and news events encapsulate how all these forces can converge in real time.
For enthusiasts, understanding “what moves the crypto market” is crucial for navigating its volatility. Crypto will likely remain a fast-evolving space, but its price movements are not random. They are the sum of these identifiable factors, all of which savvy market participants weigh in their quest to predict the next move in Bitcoin, Ethereum, and beyond.
What do you think? 👇🏻
BTCUSD Price action analysis on HTFHi, I’m from Phoenix FX, and today I’ll be sharing my perspective on Bitcoin (BTC) price action based on the higher timeframes.
I’ll also give you my outlook on potential trade setups for today and tomorrow. Please remember that this is not financial advice—use this information as a guide only. If you find it helpful, don’t forget to like and share it with your like-minded communities.
Higher Timeframe Analysis
In my view, BTC tends to follow clear bullish and bearish cycle zones. Typically, we see a pump to new all-time highs (ATH), followed by the formation of resistance and a retracement down to a key support level. Our trading approach focuses on identifying those critical support and resistance levels, with some interim trades based on shorter-term analysis—occasionally even counter-trend, depending on the day’s market bias.
Over the past eight years, BTC has respected a major trend resistance line. The most recent ATH, around $112K, reconfirmed the relevance of this trendline. This makes it a valuable tool for projecting future ATH levels.
Looking ahead, I expect a move towards the $115K level in the coming weeks. This would likely act as a point of resistance, at which stage we might see a reversal and a drop back down to a key support zone.
Trade Setup
The chart I'm referencing highlights what I would consider the first premium buy zone, identified using a 4-hour Fair Value Gap (FVG).
The 50% level of this zone sits at $99,450. If this zone fails to hold, we may drop further to the secondary premium buy zone, which aligns with our higher timeframe (HTF) trend support and a weekly FVG. The 50% level of this deeper zone is around $89,150.
A potential long entry at $92,550, with a stop loss around $88,000, offers an excellent risk-to-reward (RR) ratio, targeting a move up to the $115K level.
Intraday Outlook
For today, I see bearish price action, with potential rejection around the $104,300–$105,000 range. Go short around the $104,750 to $105,000 zone
This could lead to a move down toward the lower key zones highlighted in the HTF analysis.
I recommend taking partial profits (TP) at every $1,000 increment and setting your stop loss to breakeven (BE) after hitting the first target.
Final Thoughts
Price action analysis is always subjective, so I’d love to hear your thoughts and ideas in the comments—each one, teach one.
Thanks for giving me some of your time.
From the Phoenix FX team, have a great weekend!

Sells into support zone after fill of wedge channelCurrently in 2 sell orders. Setting my TP at the area shown. Current orders have SL in profits (safety blanket if I'm wrong, I can always re enter). Expecting new highs to be hit for BTC! Long term buy set up will have its TP set at 114K.
Market Psychology 101Good day traders and investors,
There are benefits to being (AWAKE) or at least there should be.
This is where I stand at the moment with the Bitcoin & crypto market. I do believe Is in the final stages of the bull market marked with a circle. The final stage has biggest gains and it happens in 30 to 45 days.
Most of what I wan to say is in the chart. Please, feel free to add something you feel I have missed or why you may disagree.
Kind regards,
Demetrios

Bull Trap – The Real Drop May Just Be Starting! (Crash Ahead?)The market appears to be gaining bullish momentum, giving the impression that the bear market is over—but what if it’s just getting started?
On this CRYPTOCAP:TOTAL chart, the current price action seems to mirror the 2021–2022 bear market cycle: a rally to new highs, a sharp drop, a deceptive recovery (bull trap), followed by a deeper correction and eventual accumulation.
If this pattern plays out again, we could be in the bull trap phase—right before a significant and unexpected drop.
What do you think?
Will history repeat itself, or are we heading to new highs?
Drop your thoughts in the comments!
Please support this idea with a LIKE👍 if you find it useful🥳
Happy Trading💰🥳🤗

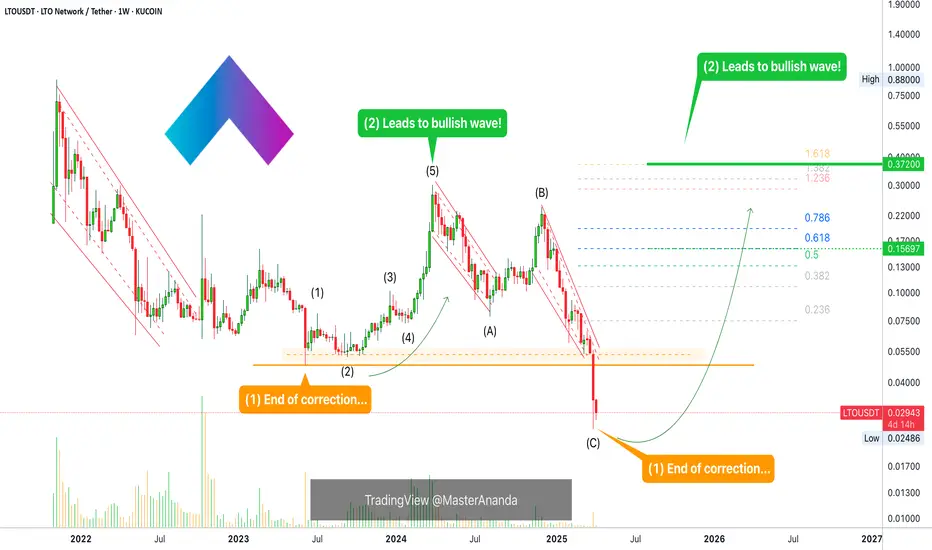
LTO Network: Your Altcoin ChoiceA bullish wave follows a correction.
The end of a correction signals the start of a bullish wave.
What we have here is the long-term LTO Network chart. The last part is clearly a strong correction. After this correction a bullish impulse will develop. 5-up waves. 1,2,3,4,5.
Last week LTOUSDT produced an All-Time Low. This session also have some of the weakest volume ever for a major move. Lower low on low volume means that the bearish move reached its end. If the bearish move is over, what happens next?
This is the stop-loss hunt event. All LONG positions liquidated. All spot stop-loss orders activated. Full market flush and reset complete. With this move, literally millions of participants left the market, they will trade Crypto no-more. They will have nightmares when you mention Cryptocurrencies for years to come. But not all is lost.
At the same time that the bearish cycle ends, this heralds the start of a new cycle and bullish phase. It will be great.
Just as the market can hit new All-Time Lows when the bears are in control, the market can hit new All-Time Highs when the bulls control the game.
The time to buy is now.
Once you hit bottom, there is no other place left to go but up.
LTO Network already hit bottom, so we can be sure that soon enough we will experience a new phase of growth.
The action won't go full green right away. The bull market will not happen as the C wave of the current corrective phase, no. It tends to build up slowly for months. Months sideways, growing, slowly; higher highs and higher lows.
Some shakeouts happen but still the base, the ATL, stays the same. The shakeouts remove a big portion of the slow and steady growth, but just as fast as the market drops it starts to recover again. The recovery is always slow... It builds up for months and then bullish momentum shows up.
Bullish momentum leads to the first strong bullish wave. After this wave a major correction, just one, strong higher low, strong recovery and then come the bull-run phase.
This is the bull market dynamics in a glance. It will take time but it will be great.
Many people will lose patience and fold.
Some will become bored.
Others will look at the screen, track the market but will never buy when prices are low.
Then, suddenly, everything starts going up. Some of these people that are looking at the screens and the prices daily, they will be wondering, "Why didn't I buy when prices were low?" "What was holding me back?" "Why didn't I take action?"
You don't have to be in that group.
You can be in the group that will end up saying, "Wow, this time I managed to secure profits on most of my coins. 10-20X nice. Thank you Master, thanks a lot for your continued support!"
But you have to start today.
If not buying, start planning and then take action.
Thank you for reading.
Namaste.
Basic market concept EX1Basic Market Concepts are essentially market examples of the Market Cycle.
Putting it into simple context can help traders know when the market will be ranging (horizontally), where the support and resistance zones are and see how market behavior looks like.

Bitcoin Update - Correction of an Error Made in my Last VideoThis is just a quick update to correct an error I made in my last video. I stated that when viewing the monthly Bitcoin chart with the Stochastic RSI indicator, a drop below the 20 level signaled that the peak had been set for the market cycle.
This is true for every market cycle except the 2021 market cycle with the double top. During the summer of 2021, the Stochastic RSI indicator dropped slightly below the 20 level but then recovered to move back above the 20 level during the push higher to the second peak.

Bitcoin Long-term Holder CyclesViewing market cycles through the lens of long-term holder behavior can provide valuable insights. This chart tracks the collective balance of long-term holders, highlighting periods of accumulation (green) and distribution (red) across different market phases.
Distribution phases align with bull markets, and we are currently in one. The duration of these phases can offer clues about what to expect in the current cycle—assuming market dynamics remain consistent.
The first accumulation phase lasted approximately 1,000 days , followed by the second at ~820 days , and the third at nearly 800 days .
The first distribution phase lasted ~530 days , the second 420 days , and the current one has reached 385 days so far.
At first glance, this may suggest a contracting cycle. However, with only three data points, it's premature to establish a definitive trend. A more prudent assumption is that the current distribution phase will follow a similar duration to previous ones—likely spanning 400 to 550 days.
For illustration, if this distribution phase were to last 500 days, it would place its end around mid-May. However, this still leaves the most critical question unanswered: how does this relate to price?
Historically, distribution cycles tend to end after market cycle peaks. As prices decline, long-term holders gradually slow their selling and begin accumulating again. This suggests that a market cycle peak before May should be considered a logical scenario within the current cycle.

Unpopular opinion; BTC at 100kShort and sweet; Btc is quite a bit oversold on the weekly rsi, and looks like it might be forming a bearish divergence. Price has hit the 1.618 reverse fib retracement. BTC hasn't traded above the red trend line, stretching back to the highs of 2017. Sad as it might be to say, we are at or very near the end of this run.

Monthly Chart v. Weekly Chart May Indicate TroubleSince every dollar of price action is raising concern in either direction, let’s take an in-depth look at what’s happening with the price of Bitcoin.
On the weekly chart (left), we can see the RSI is just starting to pivot and we can see the Stochastic RSI will have a cross in the coming weeks, usually indicating an uptrend. Price action has been within the same range for about three months, building healthy market structure. Then we get to the monthly chart.
The monthly chart (right) is showing slowed momentum. We can see in the Stochastic RSI that the orange line is on top of the blue line – usually a bearish indication. This has me a bit concerned and considering how we’ve had ranged price action and are dropping from an RSI of around 80, it may be a warning sign of what's to come.
Take a look at the green arrows on the monthly chart. Every time the purple line crosses above the yellow line, we see a price rally. Now look at the red arrows. When we see the purple line cross below the yellow line, price falls. The first red arrow you see, that was about a 70% drop. The second red arrow you see was about a 52% drop from the next pivot in momentum and a total of a 73% drop once RSI bottomed.
This is when you want to have your strategy in place for if the weekly chart champions the monthly chart or if we do in fact have that RSI monthly purple line cross below the yellow and we go lower. Be ready for whatever the case may be! I'm thinking it's probable we may see a 50% drop before seeing all-time highs and the rally we've all been waiting for.

Buying Silver at 22$ based on H.Marks Cycle theory.Risk and Time are in opposite sides of a coin. Meaning what is unknown equals risk. Markets are forward pricing mechanism, meaning when something is known - usually was already priced in (bought with risk).
H.Marks theory was you should buy things in advance, when there was hypothetical most risk; in practice it would be the least risk (as shown in graph). As long as there were hedges and drivers? You cant measure future demand?
Here key words were economic gravity and inflation trend (unknown). Once we saw inflation in mid-January -> we could start placing bets on silver (22$).
//Highest profit comes from buying in advance (combining w/ 200dma cycle?). When something is "risk-free" or certain -> it has 50-50 chance of profit and loss in both directions?; when something is "small risk", certain has small returns.
//this works as long as there is 1:5 potential.

Using S5TH (spx stocks above 200dma) as an oscillator timing cycPretty cool feature. You can use the 9month moving average in S5TH (spx stocks above the 200dma) to time the market cycle. Figure out the upward momentum (with help of game theory and TNX cycle). In practice and theory peoples options should be predictable because everyone act in their self-interest, seeking safety (hypothetical riskfree) and potential.
I use this as an oschilator (like RSI).. above 50% reading is bull market (because more than 50% stocks above it's 200dma).
This thing points to bull market to at least like 2025 summer. Worth noting that business cycle and TNX patterns are key here.

Eur/jpyI will look all the yen pair based on my analysis on usdjpy.
As USD/JPY has higher interest differential compared to eur/jpy ,so it would follow similar pattern.
this is the usd/jpy analysis
So I think there is an opportunity to get into the countertrend setup to the level of resistance before we analyze for short!!
Follow me for another Setup
