Up before EOY...We could've expected the short term drop in prices according to where we are. Holding tight and waiting for December. Let's print the right shoulder to this massive inverse H&S. Quick breather - September is normally a down month, anyways...
Markup

BTC Wyckoff text book accumulation, ready for MARKUPFollowing the idea of the Wyckoff accumulation that has been discussed by trading community last month.
Now it looks like clear Wyckoff accumulation, we had the spring. We flipped the Q3 opening which was also the middle of the range (35.5K), retested it (at 36.5K when the price rallied to 40K then bounced on 36.5K, which is above the 35.5K middle of range, so it should be considered as a sign of strenght.)
What happened and why so much people got trapped ?
We printed 8 daily green candle since the 21rst of July, which can be considered the spring of the Wyckoff accumulation.
People called for price below 28K because of the wicks, but if you look at chart in LINES instead of CANDLES, you can see that we indeed had a spring, even if it was a weak spring.
But note that not all accumulation phase have spring, if you look at the second schematic of accumulation, there is no second spring (THERE IS NO SECOND BEST - ahum sorry ) school.stockcharts.com
Wyckoff accumulation should be analysed checked in LINE, or without the wicks .
Se we are currently at the SOS in the 39K - 41K range, option expires today in around 6h.
If there is no price reaction, there will be no FUD to worry about for most trader.
Let's see if price will markup and if we enter phase E.
Last thoughts:
We can't still confirm 100% that this is a Wyckoff accumulation we have to see if the price breaks 42K resistance, and starts trading in the 42-52K range, with 46K being the first strong resistance and middle of next range.
But looking at the momentum, how price bounced at 36.5K and price being nicely held/squeeze at top range resistance, it is very likely to see a price markup, and I would orient my trading strategy for longs according to these elements.
INVALIDATION :
What would invalidate this idea ?
If we break below 36.5K (last support) I would consider this invalidated.
If we break 35.5K (Q3 opening) I would consider this REALLY invalidated.
If we break 39K (low of SOS range) I would consider this MAYBE invalidated, but still remain confident in this idea, I would be looking at the price action on 1H - 5MN to see if structure looks bearish or bullish, and would try to add to my long position according of PA.

[WYCKOFF] Upside to BTC?Hi!
As my first ever post on TW I would like to share an update to the prediction of the BTC price movement in the short-mid term using the wyckoff method.
At first I will be showing you a drawing of the current BTC graph with the wyckoff theory visualised on top.
Then I will show two images, At first, "The accumulation #1 schematic", followed by a list of terms explained.
Finally I would like you guys to look at this comparison for yourself without too much bias wether you are a bull or bear. Personally I would like to be bearish at a time like this if history repeats, but can't help but take this consideration facual.
I have to go to bed now, but hopefully this gained you some valuable information for your own research.
I will be happy to answer your opinions on this Idea! Happy trading :)

Expecting Mark UpREIT broke above its Key Resistance (Creek). Technically supported by outperformance against market index, increasing fund flow and Volume.
Using classical projection of 2 x Neckline less Range Low, we have a upside target of S$0.81.
Trading below S$0.50 will falsify analysis.


USDCAD Developing a New Uptrend Last week, the USDCAD was finally able to break out above the upper boundary of a massive Accumulation range. This happened after a prolonged period of consolidation above the 100-day MA (in blue), underpinning the steadily rising bullish bias.
The breakout above 1.21350 and the 200-day MA (in orange) implies that the USDCAD may finally commence establishing a new Markup. This transition from the preceding Accumulation into a new Markup occurs as per the expectations of the Wyckoff theory.
The price may yet drop to the upper end of the Accumulation from above before rebounding and continuing to head north. The first major target for the new uptrend is underscored by the 200-day MA (in green). This is the resistance at 1.22700.

Making a Move Price is currently on a area of interest if my 15min candle closes below and I get a retest of the zone with selling pressure I will do just that.

US30 Take Profit Had a very successful trading morning. Hope you'll did as well.
Price kept playing around my asian box before finally giving me the push down I needed.
When I previous marked up my chart it was around 1am est time. So my chart was done pretty early. Based off how the market moved and how late my move took place. I will wait till NY session to trade and to markup a US indice.
also doing some research on best times to trade this type of pair is going to be between the times 9:30am-11:30am. My move finally happened but it happened around 9. So from here on out, I will be marking up a little bit before opening US markets.
Please feel free to leave any advice that will make me a better trader. Thank you
Happy Trading.

US30 FORECAST 4.29.21Good evening. This is my markup for us30.
Fun fact: Currently learning candle stick patterns. tonight homework assignment is to identify 3 of the candle stick patterns we went over today. We are having, what we call a 3 pair challenge. Where we markup 3 pairs. adding in the candle stick patterns was a added bonus. Let me know how the charts looks and give me some feedback. Send 3 pair winning vibes only my way. Thank you !!
Markup was done on the 1hr to get support and resistance zones.
fib. was placed on the 15min and the 1hr. they both matched up beautifully.
When price breaks out and closes below my .236 and gives me selling vibes. I will do just that.

Accumulation ending?Kinda seems like textbook Wyckoff Accumulation at this point. Nothing is guaranteed, but a markup phase should be just around the corner.
Also, Bollinger Band Width is extremely low, so there is definitely room for a lot of volatility - which could also be to the downside.
I'm bullish.

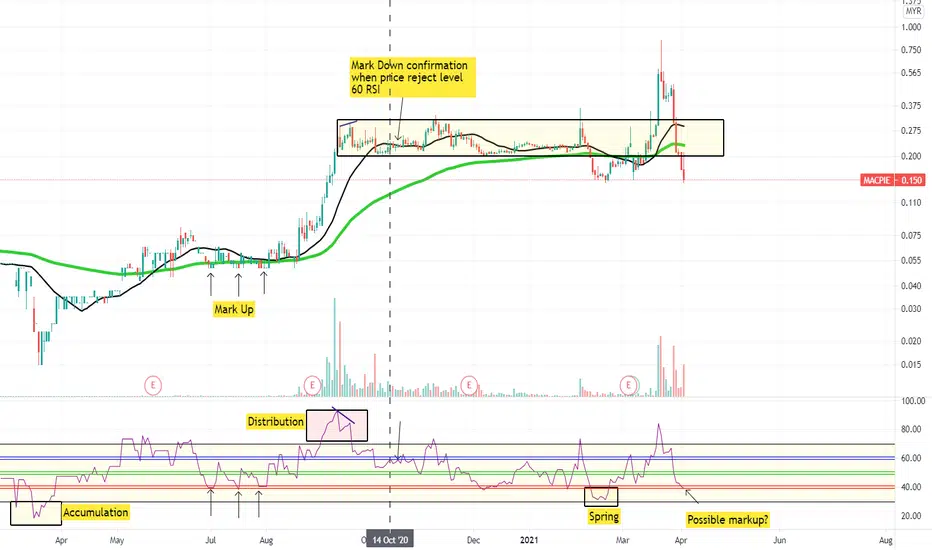
MACPIE Possible mark up?The first time RSI hit 40 levels after the previous spring.
Cut loss if RSI Close below the level.
GBPNOK 1H 120pip BUY for 24-26 March 2021Hello new trader here working on my TA pls comment and leave feedback on how I can improve.
Looks like GBPNOK could be buying today or tomorrow. I don't usually trade 1H so we'll see how it goes, this is simply a trade idea not a signal but the highlighted buy zone would be the ideal place to get in on this move. If you get in nice and early you could be looking at 120pips if it hits the upper accumulation trend channel which is possible as we have a bullish bias on the short + long term.
Stochastic and macd indicators are both low, SOTW ( shark out the water) is the name I give it when stoch breaks down through to 20 or 80 dashed lines, it indicates a strong buy is overdue, especially on an uptrend. Macd is usually better suited for longer time frames but we're gonna trust it here as the hidden bullish divergence seems legit - same story with stochastic. Price broke the uptrend orange line and is now below it, hoping to see a retest and break in this buy so I would set TP on the line and break even when this is hit. 30 - 40 pip stop loss should be sufficient to dodge any stop hunts.
As always ensure you wait for confirmation before entering because fakeouts are common on gbp/xxx
Hopefully this is a winner
Vince / Vmoney

EURNZD 1D 500pip BUY - for week starting 29.3.21Hey guys hope you're doing well reading this.
Fib drawn between yearly high and lows - recent spike brought us up by roughly 400pips, we're currently seeing exhausted / rejection candles forming an arch shape, like an upside down "U" which is much clearer on the 4H chart. This is a less common trend reversal pattern, but we can put some faith in it as price is exhausted / rejecting of the 0.618 fibonacci level which is a good sign. This fibonacci level also back tests nicely to show a common area of resistance
We can see great divergence on the stochastic and macd indicators suggesting there's an incoming sell move. Price is also at a monthly high so psychologically speaking selling pressure should increase. We'll have to wait this out for confirmation as the Euro has been getting stronger towards the end of this week. For confirmation we can wait until a strong candle crosses and closes below the orange trend line which has only recently been broken for this first time.
As always any advice is appreciated
Vince / Vmoney

MU Micron Finally set up for new All-Time Highs and Mark-upMU has reclaimed the high trend lines in the overall uptrend and price target projections are projected in price and period of time expected highs can be reached

NZDJPY Short Scenario 1Here we see a chance for equal highs followed by a highly potential shorting opportunity. Great P/L Ratio!
Do you like my chartings? I’d love to hear about it! Please feel free to contact me here with any questions. I am always here to help!
And as always, May the force be with you!


Spring art, art of spring Furniture producer spring art, newly listed company since end of 2019. While newly listed means a new uncharted territory, Spring have so far shown a nice months of accumulation period between 175-255. There is a clear broadening triangle pattern depicting the accumulation process.
Assuming 275 is the creek, i have made the PnF TP calculation
PnF= 0.005x3x25
= 0.375
TP~~ 0.18 + 0.375
= 0.555
TP2~ 0.225+0.375
= 0.60
Ready for a markup phase, Spring has formed the Wave 1 EW. Wave 1 peak right at the resistance by Gann fan 1/1 and retrace at RBS line of the broadening triangle trend line. Do note that it has made a spring up till 0.5/0.618 Fibo retracement before resting at current 0.38fibo area. Using the informations we have made the Elliot wave projection up till potential TP.
Given that this is uncharted territory with less historical data, it is good that it retrace and forming a strong significant support like it does now at Wave 2 EW before continue the remaining EW. All the lines in the chart is the immediate resistance/support areas.
Volume profile wise, we cannot see a clear distribution in play yet.
Plan this trade with tight loss given that below this support, the region 340-290 has a thin volume profile which mean, price will move fast in any direction within this region.

Artroniq: purely TA, FA inside the oceanArtroniq aka PTB has broken put of its trading range with clear JAC,LPS, and SOS.
Based on LCE PnF charting the TP calculation as follow:
Pnf = 16x0.01x3
= 0.48
TP consv= 0.14 + 0.48(50%)
= 0.38
TP aggrsv = 0.14 + 0.48
= 0.62
TP conservative has already touched. However, using volume profile indicators (visible range), there is no clear distribution in play yet. The current retracement at Fibo 0.38/0.6 might actually its wave 2 of EW.
Using TP aggressive, pairing with EW, there is the possibility to shoot for TP 600-620, marketing wise, there are not so many herd yet. and there is a chance there will be news to attract the herd and help to push price up.

Rgsport, don't even think to call her real name!!!Been accumulating since the very beginning with clear chart pattern of cup and handle and possible inverted HnS on the right-hand side of chart (the classic accumulation pattern)
This study is a little bit too optimistic by taking PnF TP all the way since end of 2018 till date as seen in the chart
Grand PnF= 25x0.01x3
= 0.75
TP consv = 0.32 + 0.75(50%)
= 0.695
TP2 = 0.32 + 0.75
= 1.07
Currently she just seems to be done JAC and a breakout from the Accumulation Trading Range. Bright side, she stay above the Creek for longer period now compared to previous few breakouts. So, very high chance she is now forming the LPS before the Mark Up phase.
LPS intact as long as she doesn't break 350-360 support level (RBS)

Re-accumulation phase for Alibaba before markup I believe BABA has shown us the first levels of its trading range at the $315 level and $255 level and I think this is the range we will see the strong hands start accumulation before the Ant IPO for the markup. I will be swinging BABA in this range until it’s time for the final rally up in its final phase of this range.


POTENTIAL AUDUSD BUY ? Had a friend ask if anyone was watching AUDUSD so i sent a markup on MY outlook on it and what i could see happening if it plays out as shown in the markup. Personally not taking the trade as it does not fit my trading plan but why not drop it as a lookout for the trading community :)
Please like and comment it pushes me to keep creating content on pairs and my bias on it :)
-This is merely MY outlook and not advice on what YOU should do just my opinion on what I see

Week 3 of OCT 2020 Dollar Index Pre Market OutlookMonthly
1. We have Bounced of the 71% Fibo
2. Monthly Imbalance Between Price Levels 96.00 and 95.00
3.If We are Bullish Dollar = XXUSD BEARISH
Previous Week Bullish
Current Week
94.75 Weekly High/Structure High
Currently Bullish
POI Price Level 95.00
Would Like to See Price at 94.40 Inside the last Up candle before down Move.
