$MA Soft B Wave RetracementNYSE:MA this play is experimental however I'm testing something that I'm adding to my indicator. Targeting the Confirmation Levels and the 1.618. NYSE:MA may be temporarily oversold. $V has the very same set up
Happy Trading Alert Sets
Mastercard

$MA Tradespoon – Long Setup $563.71Tradespoon model shows a long bias for NYSE:MA . Predicted range: $563.71–$582.05. Trend: –0.64% (near-term consolidation with upside potential). NYSE:MA

Circle: The Next-Generation USD-Based Payment NetworkThe past 17-year stock price CAGR of Visa and Mastercard (22.6% and 25.4%, respectively) is the result of payment volume growth (around 8–10% annually) translating into revenue and profit growth, amplified by share buybacks that increase per-share value. The fact that their stock prices have risen far more than USD M2 growth (6.1%) also reflects network effects and margin expansion.
In Circle's case, more than 95% of current revenue comes from USDC reserve interest income (from short-term Treasuries). If USDC supply grows at a 12% CAGR:
Reserve income will increase roughly in line with the supply growth rate.
While a 12% growth in USDC supply serves as the revenue base, Circle is less transaction-fee-centric than Visa/Mastercard and has higher dependence on interest income, so a certain discount should be applied.
The actual growth rate could be even higher than what was calculated based on this foundation. This was estimated conservatively.
In conclusion, since growth is based on the increase in currency issuance, the growth trends will be similar.

Mastercard: Further Downside Pressure? Mastercard extended its recent bout of weakness, briefly dipping below support at $527.33 before quickly rebounding. In our primary scenario, we anticipate that the sell-off will continue along magenta wave (4), likely driving price into our green Long Target Zone between $493.51 and $453.69. Alternatively, it’s possible that the turquoise wave alt.2 has already been completed. If so, a direct breakout above $623.64 could occur, which would invalidate our Target Zone (probability: 35%).

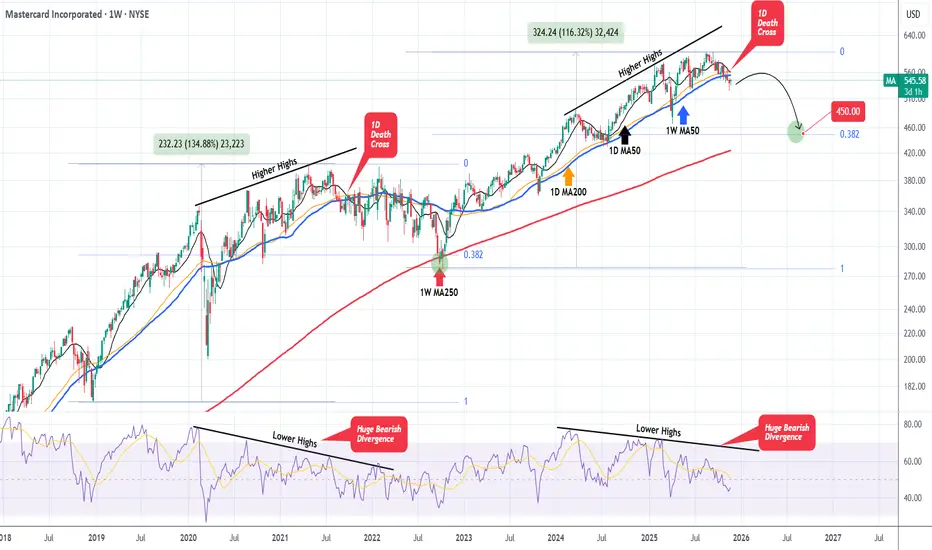
MASTERCARD 1st 1D Death Cross in 2.5 years confirms Bear CycleMastercard (MA) has just formed its first 1D Death Cross since March 2022, trading already below its 1W MA50 (blue trend-line) for the 5th straight week. This confirms the new Bear Cycle/ long-term correction, in a similar manner that the September 27 2021 1D Death Cross did.
As you see, there are high similarities between the two sequences that led to that Death Cross, rising by +134% and +116% from their respective market bottoms and more importantly displaying identical huge 1D RSI Bearish Divergences (Lower Highs against price's Higher Highs).
As a result, with the 2022 correction finding a bottom just below the 0.382 Fibonacci level and the 1W MA250 (red trend-line), we again expect the market to reach at least $450.00 before bottoming and start calling it a buy opportunity again.
---
** Please LIKE 👍, FOLLOW ✅, SHARE 🙌 and COMMENT ✍ if you enjoy this idea! Also share your ideas and charts in the comments section below! This is best way to keep it relevant, support us, keep the content here free and allow the idea to reach as many people as possible. **
---
💸💸💸💸💸💸
👇 👇 👇 👇 👇 👇
Mastercard Picks Polygon for Self-Custody Identity UpgradeMastercard has expanded its Mastercard Crypto Credential program to self-custody wallets, and selected Polygon as the first blockchain network to support the rollout. Together with Polygon Labs and Mercuryo, Mastercard is introducing verified, username-style aliases that replace long wallet addresses, bringing a familiar, Web2-like UX to Web3 value transfers.
The upgrade enables users to link a self-custody wallet to a verified alias, receive assets using that username, and optionally mint a soulbound credential on Polygon. Mercuryo handles KYC onboarding and credential issuance, while Polygon provides the speed, reliability, and low-cost infrastructure required for identity and payments at global scale.
Polygon’s selection is driven by its enterprise-friendly architecture: sub-cent fees, instant settlement, high throughput, and no reorg risk following the recent Rio and Heimdall v2 upgrades. With stablecoin volume already in the billions monthly and strong penetration among neobanks and payment providers, Polygon is well-positioned to power next-generation digital identity and payment rails. The collaboration marks a major step toward mainstream-ready self-custody, intuitive, secure, and trusted.
Technical Outlook, Mastercard (MA)
Mastercard’s stock is pulling back toward a multi-year ascending trendline, aligning with a major liquidity zone below the $527 low. The chart shows a potential sling low forming, with price rebounding from trendline support historically before rallying toward prior highs.
If bulls hold support, the next upside target is the $600–$602 resistance level. A breakout above this zone could open a path toward new all-time highs, aligning with improving sentiment around digital payments and Mastercard’s increasing involvement in blockchain infrastructure.
Momentum indicators signal near-term exhaustion, but the macro trend remains intact. A clean reaction from support could trigger a medium-term recovery.
Mastercard (MA) Hits Key Cycle Top — Correction Incoming!🧠 Mastercard (MA) — In-Depth Multi-Framework Market Analysis
Mastercard’s long bull run has matured into a classic Wave 5 exhaustion.
Multiple frameworks agree: a deep corrective phase is likely ahead.
Understanding market structure, smart money moves, and Fibonacci levels can help you navigate this reset .
🌀 Wave Theory & Elliott Wave Context
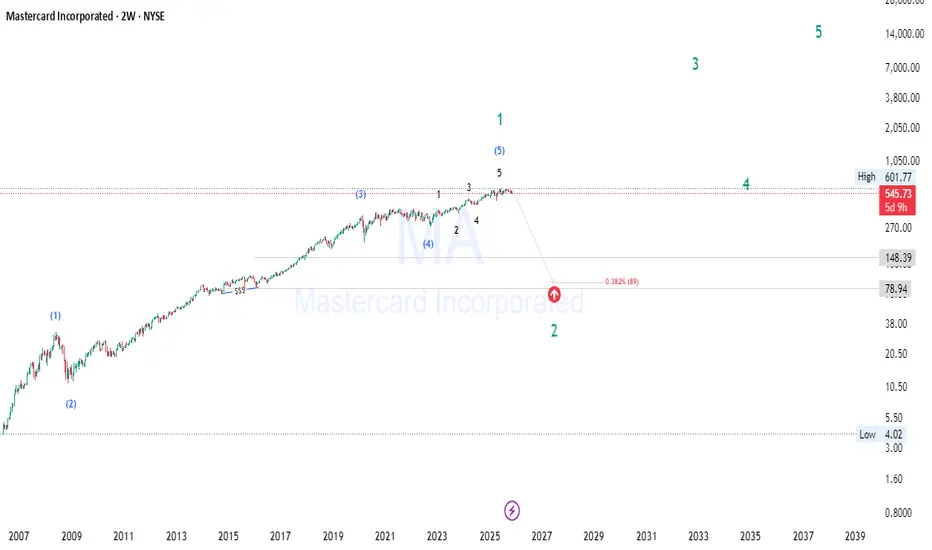
Mastercard’s chart shows a clear completed 5-wave impulsive structure spanning roughly 15+ years, typical of a major secular bull cycle. The small sub-waves within Wave 5 suggest final exhaustion:
Wave 5 ending near key Fibonacci extensions signals an exhaustion climax.
After such extended waves, expect a significant corrective ABC pattern or even a complex correction resetting much of the prior gains.
The correction here is likely a large Wave 2 on the higher degree, meaning the retracement could be deep and prolonged, typically lasting multiple years.
📉 Market Structure Breakdown & Key Price Action Signals
Price has failed to push to new highs with conviction, showing lower highs and a breakdown of previous support levels.
This breakdown in market structure suggests the shift from an accumulation or markup phase to distribution and markdown.
Multiple wick rejections and volume spikes near highs imply liquidity sweeps and stop hunts by institutions, signaling transfer of risk.
Price action shows signs of fatigue — smaller candles, overlapping bars, and diminished momentum — classic exhaustion signals.
🧠 Smart Money Concepts (SMC)
Institutional players often engineer liquidity grabs above key levels (stop hunts) to shake out retail participants.
The immediate reversal following those liquidity grabs is a hallmark of distribution , where "smart money" sells into retail enthusiasm.
The absence of strong demand at these levels reinforces the notion of a shift from bullish to bearish control.
📊 Fibonacci Retracement & Extension Levels
Wave 5 terminated near the 2.618 Fibonacci extension , an extreme but well-documented exhaustion zone for extended impulses.
The retracement target aligns with the 0.382 Fibonacci retracement (~$89–95) , the first major support for Wave 2 corrections.
More conservative estimates place support near 0.5–0.618 retracement , which historically mark deep correction zones in longer cycles.
These levels also coincide with significant prior consolidation zones, increasing their validity as support.
💼 Fundamental Context & Market Cycles
Mastercard’s underlying fundamentals remain solid, with strong revenue growth and market dominance.
However, market cycles are driven by liquidity and psychology — no fundamentally strong company is immune to price corrections during macro resets.
This correction could coincide with broader economic or sector rotation phases, impacting valuation multiples and capital flows.
🔮 Strategic Outlook & Trading Implications
Expect a multi-year correction phase , potentially volatile, with several retracements and consolidations along the way.
Patience is key: major Wave 2 corrections often shake out weak holders and reset risk/reward dynamics for the next bull phase (Wave 3).
Traders should look for confluence zones combining Fibonacci support, prior market structure, and volume profile for entries.
Watch for price action confirmation of a base formation before resuming a bullish stance.
💡 Key Takeaways for Traders
Long-term cycle completion means caution: avoid chasing new highs here.
Use Fibonacci and wave structure to anticipate price targets and exits.
Monitor volume and liquidity sweeps to identify distribution phases.
Be prepared for deep, sometimes painful corrections even in high-quality stocks.
Focus on risk management and position sizing during volatile cycle resets.
Stay ahead of the market — follow for advanced wave counts, Fibonacci setups, and smart money insights.
Comment 👇 your ticker to get a personalized deep-dive analysis next! 🚀
Disclaimer:
This analysis is for educational purposes only and does not constitute financial advice. Always conduct your own research and consult a professional before trading.
#Mastercard #MA #WaveTheory #ElliottWave #SmartMoneyConcepts #SMC #Fibonacci #MarketStructure #PriceAction #TradingView #TechnicalAnalysis #StocksToWatch #MarketCycles #LiquidityHunt #TradingEducation #InvestSmart #StockAnalysis
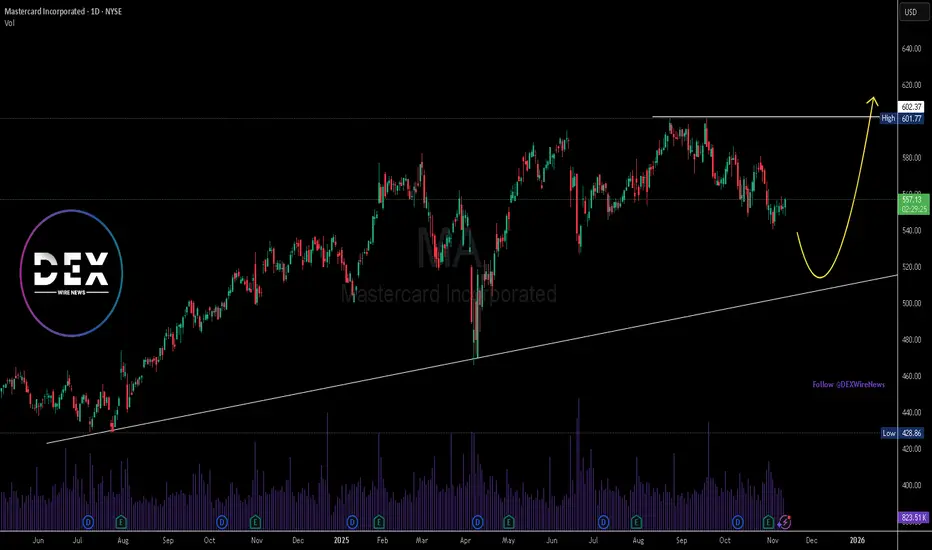
Mastercard Expands Fintech Footprint Through Globba Partnership Mastercard Inc. (NYSE: NYSE:MA ) continues to reinforce its leadership in global payment infrastructure with the launch of Globba™, a next-generation cross-border payment solution developed in collaboration with FNB and RMB Private Banking. Powered by Mastercard Move, the platform simplifies international money transfers for South Africans, offering fast, transparent, and traceable transactions to over 120 countries.
Fundamentally, this partnership highlights Mastercard’s growing footprint in Africa’s rapidly digitizing economy. The continent’s cross-border remittance flows have expanded sharply, with Mastercard research noting that 60% of South Africans sent money abroad in 2024, up from 59% in 2022. Globba™ integrates Mastercard Move’s reach across 200+ countries and 150+ currencies, reflecting the company’s commitment to inclusion and financial connectivity. This positions Mastercard as a key enabler in Africa’s G20-aligned modernization of payment systems, potentially driving new revenue streams in both consumer and B2B remittance corridors.
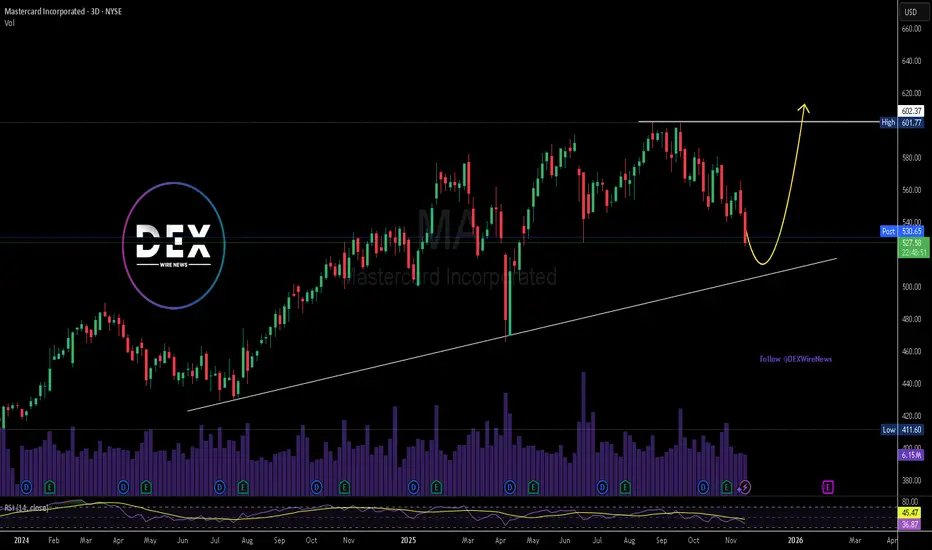
Technically, Mastercard’s stock ( NYSE:MA ) shows a strong long-term uptrend despite recent consolidation. The daily chart indicates support around the $510 zone, with a possible short-term pullback before rebounding toward resistance near $602, as outlined by the yellow projection curve in the chart. Sustaining above $540 could trigger bullish momentum, targeting a retest of all-time highs above $600. Rising volume and consistent higher lows underscore accumulation within a strong structural uptrend, suggesting long-term investors may see continued appreciation aligned with Mastercard’s expansion into emerging digital economies.
As Mastercard combines innovation with global scale, its fundamentals remain strong and its chart poised for potential breakout momentum into 2026.
VISA BACK TO 370 BY 2026 Why Visa (V) Could Hit $370 by 2026: Payments Powerhouse Bull Case Visa’s trading at ~$344 today (Sep 23, 2025), up 15% YTD on digital payments surge, but with EPS climbing 12%+ and global transaction volumes booming, $370 (8% upside) by EOY 2026 is a low-bar target for this steady climber. Here’s the roadmap:Revenue & Payments Growth: Q3 '25 cross-border volume +16% YoY, driving $39B TTM revenue (11% growth). Analysts project 9.4% YoY to $43B+ in FY26 on e-comm (25% of sales) and emerging markets expansion, per Simply Wall St—fueling $370 at 25x forward sales.
2 sources
EPS Acceleration: Consensus EPS hits $10.50 in FY26 (up 12% from $9.37 '25), trading at 28x forward P/E—below historical 32x avg. At norm multiple, that's $336 base; add 11.2% earnings growth for $370 pop, aligning with LiteFinance's $370–$380 range.
2 sources
Innovation Tailwinds: Visa Direct + fintech ties (e.g., Ample Earth climate collab) boost B2B volumes 20%+, hedging crypto/reg risks. Tokenization and AI fraud tech scale margins to 67%+, per management.
Analyst Consensus Backs It: 27–51 firms avg $380–$396 PT (Strong Buy, high $430), with StockScan eyeing $351 avg '26 (high $390). Lows at $305, but bulls dominate on 10%+ CAGR.

MASTERCARD Best Buy Entry Now, Target $577.50.
## 💳 MA Options Play: Weekly Bullish Setup with Caution!
**Mastercard (MA)** showing bullish momentum — but options flow says: “Proceed carefully.”
---
### 🟢 Bullish Signals (4/5 Models Agree):
* 📈 Weekly RSI uptrending
* 🔊 Strong weekly volume
* 🌀 Low volatility = cleaner setup
* 🧠 Multiple models (Grok, Claude, Llama, DeepSeek) lean BULLISH
### 🔴 Caution Flag:
* ⚠️ Bearish options flow detected (institutions possibly hedging)
---
### 🔍 Trade Setup:
**🎯 MA \$577.50 CALL**
* 💵 Entry: \$0.80
* 🎯 Target: \$1.20
* 🛑 Stop: \$0.40
* 📆 Expiry: Aug 5, 2025
* ⚖️ Risk: \~50% of premium
* 🕒 Entry: Market Open
---
### 🧠 Consensus Rating:
☑️ **Confidence: 65% (Moderate Bullish)**
☑️ Volume + RSI = Green Lights
☑️ Options flow = Yellow Light
---
### 🎯 Strategy Tip:
Small size. Quick exit. Watch options flow LIVE — if it shifts bullish, ride momentum. If not? Tight risk control.

MA Mastercard Incorporated Options Ahead of EarningsIf you haven`t bought MA before the rally:
Now analyzing the options chain and the chart patterns of MA Mastercard Incorporated prior to the earnings report this week,
I would consider purchasing the 545usd strike price Puts with
an expiration date of 2025-8-8,
for a premium of approximately $4.45.
If these options prove to be profitable prior to the earnings release, I would sell at least half of them.
Disclosure: I am part of Trade Nation's Influencer program and receive a monthly fee for using their TradingView charts in my analysis.

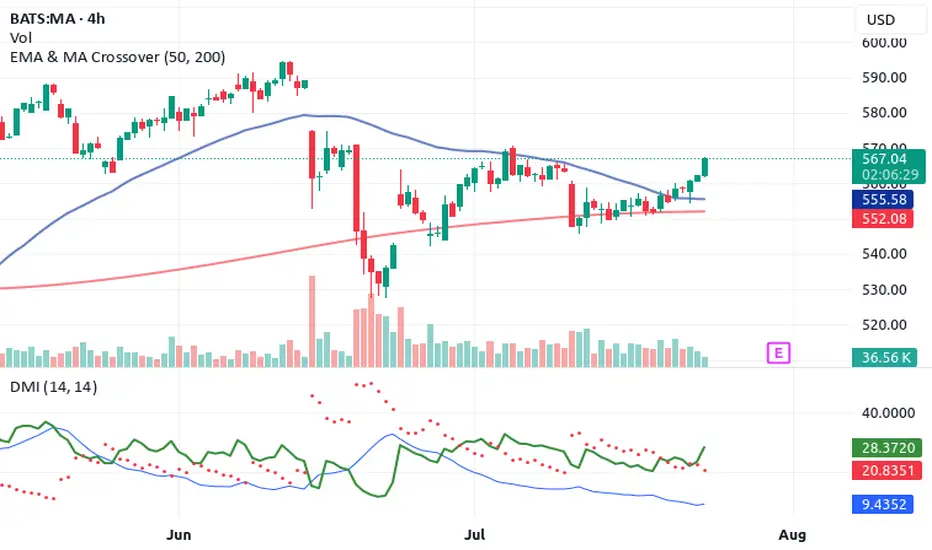
Top 4 Buy Signals Lighting Up Mastercard (MA) 🚀 Top 4 Buy Signals Lighting Up Mastercard (MA) | Rocket Booster Strategy
Mastercard Inc. (MA) is showing explosive potential, and it’s not just one signal—it’s a whole confluence of confirmations. When
you align this much market momentum, you don’t ignore it. Let’s break down how Rocket Booster Strategy gives us a powerful buy indication on the daily chart.
🔍 The Confluence Setup
✅ 1. DMI Buy Signal
The Directional Movement Index (DMI) is in bull mode. ADX is
rising and the +DI is firmly above -DI. This shows the trend is not just alive—it’s gaining strength.
🔻 2. Volume Oscillator Pullback
While Volume Oscillator is down, this is seen as constructive and not bearish. It suggests a quiet zone before the thrust—just like fuel loading before a rocket launch.
Smart traders know: momentum can build silently.
💥 3. Awesome Oscillator = Strong Buy
The Awesome Oscillator is green and firing hard. We’ve seen a clear twin-peak bullish formation followed by a break above zero
—classic acceleration sign.
🕯️ 4. Rising Window (Japanese Candlestick Pattern)
A Rising Window—a bullish continuation gap—has formed. This is one of Steve Nison’s top continuation patterns. It signals strong
institutional conviction in this trend.
📈 What Does This Mean?
When DMI, AO, candlestick patterns, and our own Rocket Booster Strategy all point up, it’s time to pay attention. This setup is rare—and high-probability.
🧠 Rocket Booster Strategy Recap
This strategy uses 3 momentum alignment points:
High Momentum Indicator (like AO) in Buy Mode
Pattern Confirmation (Rising Window or Engulfing)
Volume Correction Before Breakout (Fuel Before Fire)
When all 3 click into place, we have ignition.
🎯 Final Thoughts
Mastercard is looking primed for takeoff on the daily timeframe. Whether you’re an investor or a swing trader, this chart is
speaking loud and clear. But as always, risk management is your co-pilot.
✅ Add it to your watchlist.
🚀 Simulate entries.
🧠 Trust the confluence.
Rocket Boost This Content To Learn More
Disclaimer: This is not financial advice. Always use a simulation/demo account before committing real capital. Trade responsibly.
MASTERCARD Best buy entry now. Target $625.Mastercard (MA) has been trading within almost a 3-year Channel Up that only broke (but recovered naturally) during Trump's trade war. Still, the 1W MA100 (green trend-line) contained the downfall, as it always had.
Normally the Bearish Legs of this pattern tend to find Support on the 1W MA50 (blue trend-line), as the latest one did 3 weeks ago. Now that the price is trading still on the 0.382 Fibonacci retracement level, it historically is the best buy opportunity, as per all previous Bullish Legs.
The Channel Up has always priced its Higher High (top) on at least the -0.236 Fibonacci extension. As a result, we are targeting $625.00 before the year ends.
-------------------------------------------------------------------------------
** Please LIKE 👍, FOLLOW ✅, SHARE 🙌 and COMMENT ✍ if you enjoy this idea! Also share your ideas and charts in the comments section below! This is best way to keep it relevant, support us, keep the content here free and allow the idea to reach as many people as possible. **
-------------------------------------------------------------------------------
💸💸💸💸💸💸
👇 👇 👇 👇 👇 👇

Mastercard and Visa Shares Decline Due to Stablecoin BillMastercard (MA) and Visa (V) Shares Decline Due to Stablecoin Bill
Yesterday, we reported that the US Senate had passed the GENIUS stablecoin bill, which establishes a legal framework for regulating the stablecoin market. This development led to a sharp rise in the share price of cryptocurrency exchange Coinbase (COIN), while simultaneously putting pressure on Mastercard (MA) and Visa (V) shares.
According to media reports, market participants are concerned that stablecoins could pose serious competition to these companies, which earn revenue primarily from transaction fees. This serves as an example of how blockchain technology, with its low-cost features and high speed, could disrupt leaders in the traditional finance sector.
Technical Analysis of Mastercard (MA) Stock Chart
In May, MA shares formed an upward trend (shown in blue), but this was already broken by a strong downward move, accompanied by a wide bearish gap in the $575–$585 range.
Near the lower boundary of the channel, a contracting triangle pattern (shown in black) can be observed – this can be interpreted as a temporary balance between buyers and sellers. However, it didn’t last long: the widening spread of bearish candles (1 and 2) indicates growing selling pressure.
It’s possible that following a drop of over 9% from the June high, Mastercard (MA) shares might attract buyers betting on a short-term rebound. Nevertheless, in the longer term, developments related to the GENIUS bill could contribute to a continued downward trend.
This article represents the opinion of the Companies operating under the FXOpen brand only. It is not to be construed as an offer, solicitation, or recommendation with respect to products and services provided by the Companies operating under the FXOpen brand, nor is it to be considered financial advice.

MA another financial cup and handleMastercard is another name in the financial sector that is showing a cup and handle formation on the daily chart. Two price targets to break at $585.60 and the ATH of $588.45 and it's off to new highs.

Mastercard: Approaching the Top of Wave BMastercard has rebounded after a brief cooling period, and we now expect turquoise wave B to complete just below resistance at $620. Once that top is in, wave C should drive a meaningful retracement, ending with the low of magenta wave (4). Alternatively, if turquoise wave alt.(4) has already bottomed — which we estimate as a 40% probability — then a direct breakout above $620 would suggest a shift toward a much more aggressive advance. That path would take the stock straight into magenta wave (5), completing blue wave (I) with a strong rally.
📈 Over 190 precise analyses, clear entry points, and defined Target Zones - that's what we do.

MASTERCARD: One more dip possible but long term target is $620.Mastercard is neutral on its 1D technical outlook (RSI = 52.317, MACD = -0.060, ADX = 29.709) having just recovered its 1D MA50 following the March 13th rebound. The pattern here is a Channel Up and March's bearish wave already hit the 0.382 Fibonacci retracement level much like the previous one did on May 1st 2024. That however went on to extend the decline to close to the 0.5 Fibonacci level and hit the 1D MA200. Consequently there is a chance of one more month of slow decline to the 1D MA200 but overall, this is a good enough level to buy again for the long term and aim for the -0.382 Fib extension (TP = 620.00).
## If you like our free content follow our profile to get more daily ideas. ##
## Comments and likes are greatly appreciated. ##

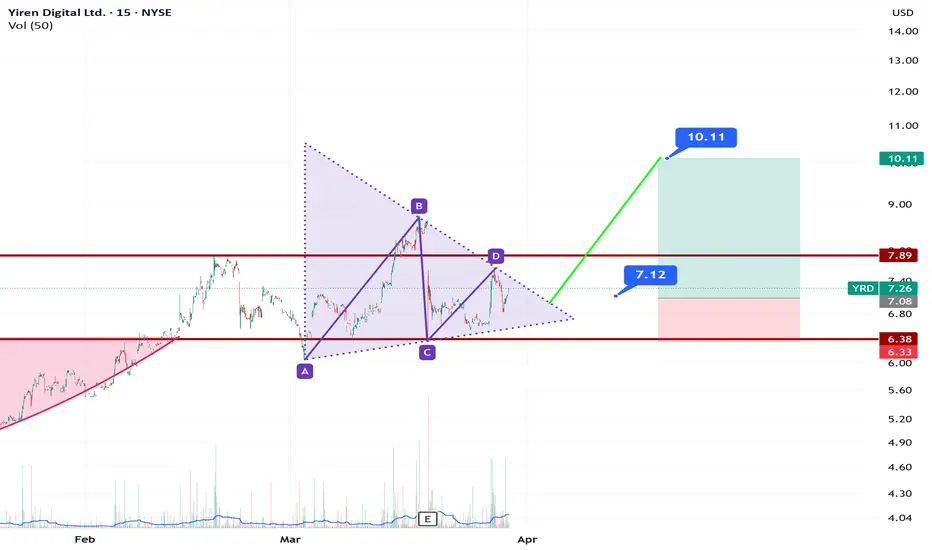
YRD Triangle PatternYRD has good financials in Credit Services. There are NYSE:V , NYSE:MA , NYSE:AXP , NASDAQ:PYPL like companies in Credit Services Industry. The Industry's average PE ratio is 25. YRD's current PE ratio is around 3,41 for latest quarter. It also has triangle pattern.
MASTERCARD: Despite the CRASH!, good graph!! Attention!!
On January 30, the American payment services provider Mastercard presented results that far exceeded forecasts.
It earned 12,874 million dollars (12,351 million euros) in 2024, 15% more than the previous year. Net income reached 28,167 million dollars (27,023 million euros), 12.2% more.
Meanwhile, operating costs reached 12,585 million dollars (12,074 million euros), 13.5% more.
Mastercard CEO Michael Miebach commented on the results: “This quarter we have achieved good results, with net income growth of 14%, or 16% without taking into account currencies.”
He continued: “Our diverse capabilities in payments and services and solutions, including the acquisition of Recorded Future this quarter, set us apart and position us well for long-term growth, as we outlined at our investor day.”
-----------------------------------------------------------------------
---> What does it look like technically?
DESPITE THE STOCK MARKET CRASH we are immersed in due to the TRADE WAR, if we look at the chart, the trend is still clearly bullish and has not yet broken ANY important support that would put it in danger, therefore, EVERYTHING INDICATES THAT WE ARE FOUND WITH A GREAT OPPORTUNITY TO GO LONG, since the market has fallen a lot and it is logical to expect an upward correction in the next few days of the SP500 index, which will logically support the rise in the price of Mastercard.
Furthermore, the price today touched the 61.8% Fibonacci and respected it (DESPITE THE CRASH), which gives us another clue that the area is respected and is possibly the floor of the next bullish impulse.
--------------------------------------
Strategy to follow:
ENTRY: We will open 2 long positions if the H4 candle closes above 553
POSITION 1 (TP1): We close the first position in the 575 area (+4%)
--> Stop Loss at 530 (-4%).
--> Ratio 1:1
POSITION 2 (TP2): We open a Trailing Stop type position.
--> Initial dynamic Stop Loss at (-4%) (coinciding with the 530 of position 1).
--> We modify the dynamic Stop Loss to (-1%) when the price reaches TP1 (575).
-------------------------------------------
SET UP EXPLANATIONS
*** How do you know which 2 long positions to open? Let's take an example: If we want to invest 2,000 euros in the stock, what we do is divide that amount by 2, and instead of opening 1 position of 2,000, we will open 2 positions of 1,000 each.
*** What is a Trailing Stop? A Trailing Stop allows a trade to continue gaining value when the market price moves in a favorable direction, but automatically closes the trade if the market price suddenly moves in an unfavorable direction by a certain distance. That certain distance is the dynamic Stop Loss.
-->Example: IF the dynamic Stop Loss is at -1%, it means that if the price drops by -1%, the position will be closed. If the price rises, the Stop Loss also rises to maintain that -1% in the rises, therefore, the risk is increasingly lower until the position becomes profitable. In this way, very strong and stable price trends can be exploited, maximizing profits.

The global market is rebootingOn February 18, negotiations between the United States and Russia are scheduled to take place in Saudi Arabia. These talks could pave the way for restoring economic relations and addressing global challenges.
“American companies lost over $300 billion by exiting the Russian market,” said Kirill Dmitriev, head of RFPI, on the eve of talks with the U.S. delegation in Saudi Arabia. He emphasized the importance of economic dialogue, noting that the Russian market remains attractive to investors.
It is now known that several major American companies intend to return to Russia. Amid a potential thaw in U.S.-Russia relations, Visa (#Visa), Mastercard (#MasterCard), Apple (#Apple), PepsiCo (#PepsiCo) and McDonald's (#McDonald) have all announced their intentions in recent days.
The U.S. stock market remains resilient thanks to domestic growth drivers. Additionally, several key factors are expected to drive growth in the near future:
Federal reserve monetary policy: A possible rate cut or maintaining low interest rates is spurring investments. This, in turn, boosts company valuations and pushes up indices such as the Dow Jones (#DJI30) and S&P 500 (#SP500).
Technology sector: Ongoing advancements in AI, cloud services, and biotechnology are attracting capital. Moreover, integrating artificial intelligence into large businesses helps reduce costs by automating routine processes, while AI algorithms enhance strategic planning and risk management.
Corporate earnings growth: Increasing corporate profits are one of the key factors supporting the positive momentum in the stock market, including the S&P 500 (#SP500), which reflects the performance of the 500 largest U.S. companies. Strong quarterly reports from these companies play a crucial role in reinforcing investor confidence and ensuring market stability.
Geopolitical expectations: Tensions among major global players like the U.S., EU, and Russia could lead to sanctions, trade wars, and economic restrictions, which negatively impact the global economy and stock markets. A thaw in relations could reduce the likelihood of such conflicts and, consequently, lower the risks associated with sanctions and instability.
FreshForex analysts are confident that as geopolitical tensions ease, companies will start to return, which will undoubtedly drive up their stock prices. Don’t miss this chance – invest in stocks with us!
Our terminal offers 270 trading instruments, including CFDs on corporate stocks and indices. Trade with a favorable leverage of 1:1000 and enjoy attractive bonuses!

Mastercard outperforming the US markets with more upsideMastercard is definitely one of the outperformers in 2025,
Strong Financial Performance: Mastercard exceeded earnings and revenue expectations due to robust holiday consumer spending.
Growth in Payment Volumes: Increased transaction volumes, especially cross-border, boosted revenue growth.
Strategic Acquisitions: The acquisition of cybersecurity firm Recorded Future enhances its digital security offerings and services.
Positive Market Sentiment: Analysts raised price targets, reflecting confidence in the company's growth prospects.
Technicals are also looking super.
Price>20 and 200
Rev Cup and Handle
Target $610.86

MASTERCARD Huge sell signal emerged, hit 1D MA50 after 4 months.Mastercard (MA) has been trading within a 2-year Channel Up that has given us very accurate trades. Our previous signal (April 02, see chart below), was a sell right on the pattern's top that easily hit our $440 Target:
Once more we see a long-term Top on this stock as the price almost priced a Higher High and on yesterday's Fed fueled pull-back, it hit its 1D MA50 (blue trend-line) for the first time in 4 months (since August 06).
Apart from that, the 1D RSI has been on a Bearish Divergence of Lower Highs (against the Higher Highs of the Bullish Leg/ dotted Channel Up) since October 18. All such previous Bearish Divergences within this 2-year Channel Up, have started the Bearish Legs (red ellipses) of the pattern, which hit at least their 0.382 Fibonacci retracement levels.
As a result, we have a high probability short signal at our hands, targeting $495.00 (Fib 0.382).
-------------------------------------------------------------------------------
** Please LIKE 👍, FOLLOW ✅, SHARE 🙌 and COMMENT ✍ if you enjoy this idea! Also share your ideas and charts in the comments section below! This is best way to keep it relevant, support us, keep the content here free and allow the idea to reach as many people as possible. **
-------------------------------------------------------------------------------
💸💸💸💸💸💸
👇 👇 👇 👇 👇 👇

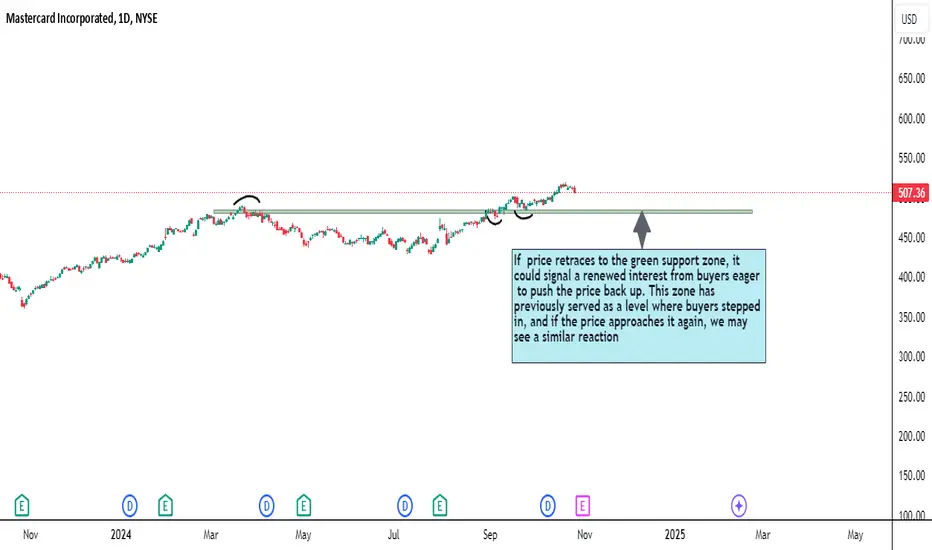
Mastercard’s Support Zone: Waiting for Buyers to Step Back InIf Mastercard’s price retraces to the green support zone, it could signal a renewed interest from buyers eager to push the price back up. This zone has previously served as a level where buyers stepped in, and if the price approaches it again, we may see a similar reaction. My strategy is to wait for signs of a bounce in this area, as it could provide a strong entry point for a long position. By observing price action and looking for bullish confirmation in the green zone, this setup could offer a promising opportunity for a move to the upside. Patience is key here, as I’ll only consider entry once there’s clear evidence of buyers returning.