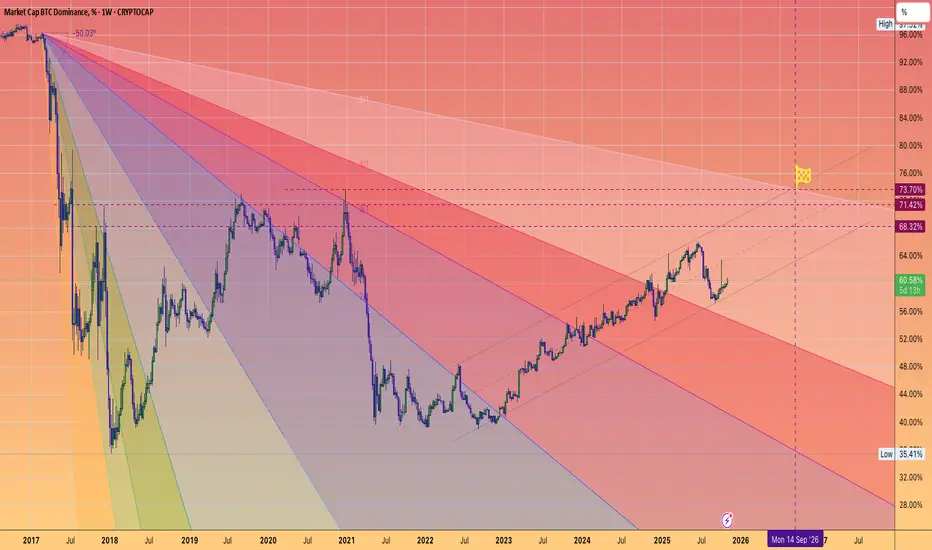
BTC.D May not TOP until next September!Despite alt/BTC pairs looking battered
**Capitulation is likely not complete**
Most Altcoins remain in downtrends v BTC
Timeline:
2025: grind to 63-65%
2026 Final Push to 73%?
Altcoins to seek relief once this finally turns around.
You may be able to start DCA'ing BTC as early as next March in preparation to buy beaten down quality Alts...
focusing on ETH, SOL, and 2's that have usage... not simply clogging up the landscape of empty chains.
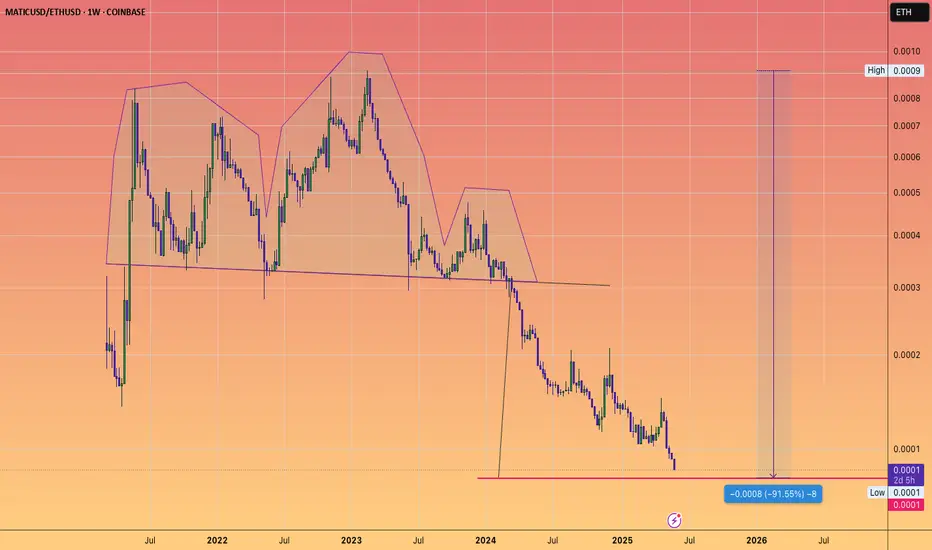
Matic
MATIC approaching Head and shoulders target...versus ETH
which would be a -91% loss of value versus the second most important crypto
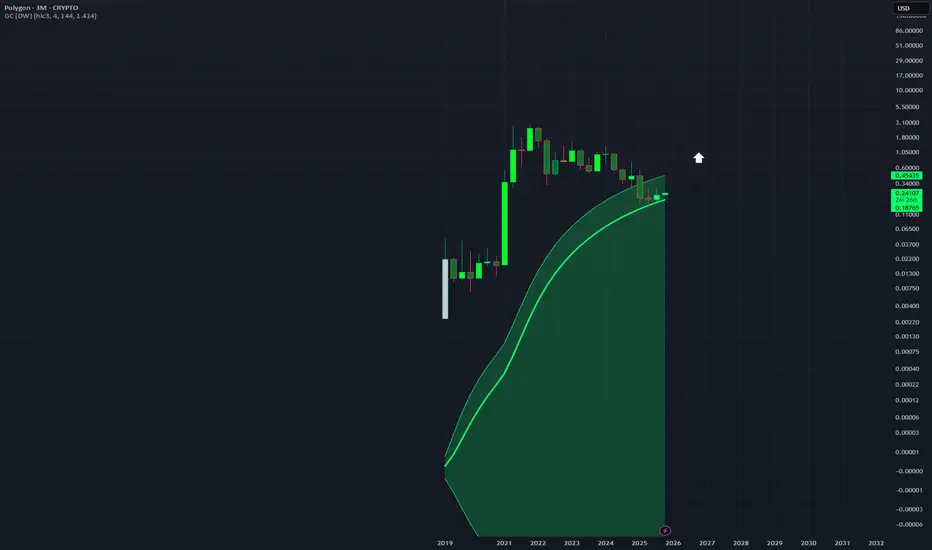
MATICUSD - Seems to Have Found Support 3Month Support seems to be showing at the middle of this Gaussian Channel on this 3 Monthly chart which is a very long timeframe but that emphasizes the support even more. It has stayed above this line since April.
Could be a big reversal coming soon.
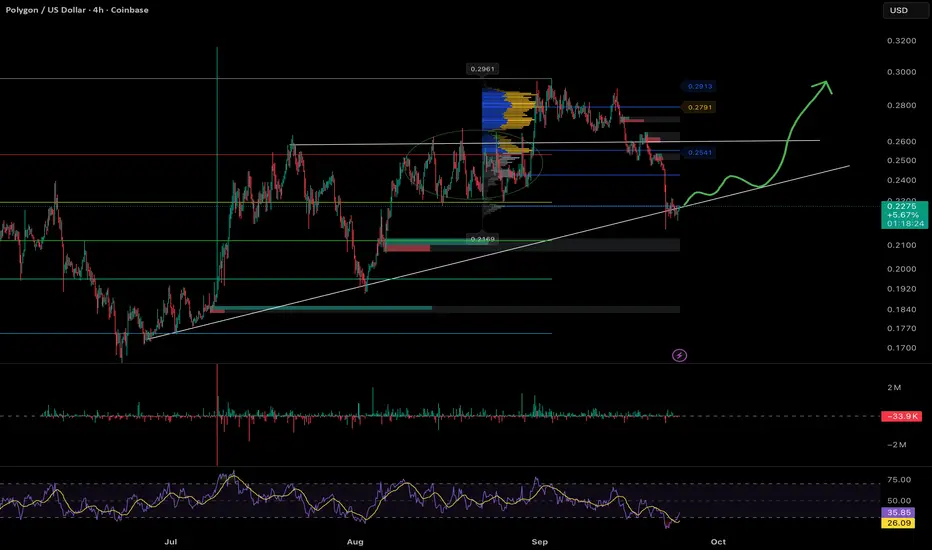
POLUSD Polygon (ex-Matic) Second attempt here following the trendline for now,
SL at 0.1990 if it wicks. And will close below the trendline if theres a clear daily breakdown
TPs : Same as the first try
0.75
1.5
3
6.5
18
cheers
POLYGON/ex MATIC - Horse pattern, very bullish ?¿*2nd attempt, making it more thrustworthy*
beautiful animal, much power, once the head of the horse is completly finished, we run the green valleys with very yummy grass
orange line is SL, need to close below on daily
target is 0.75
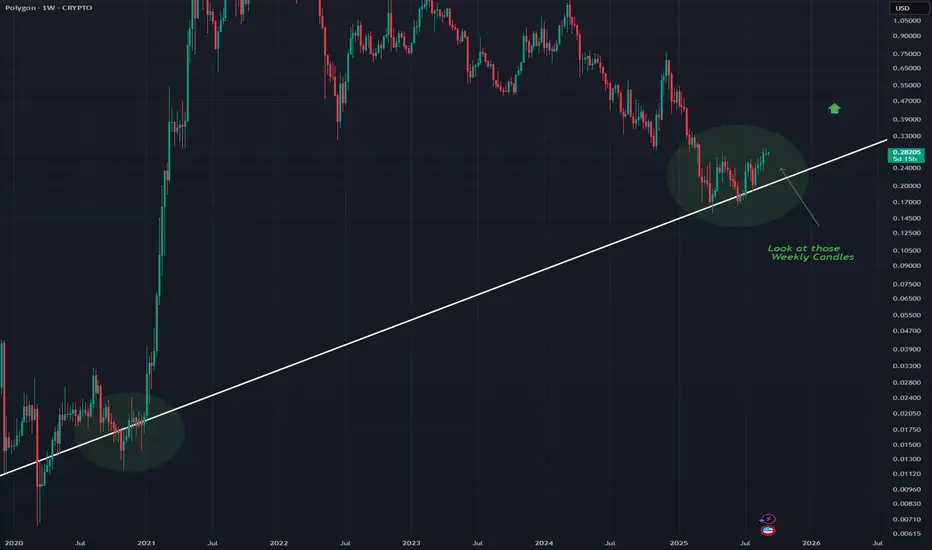
MATICUSD - Preparing For a Massive BreakoutThe recent Weekly candles on Matic are looking very very juicy and I expect a breakout.
Maybe not as hard as the first rally along this slightly iffy trend line but it looks good regardless.
Very bullish on MATIC.
Again, Weekly chart.
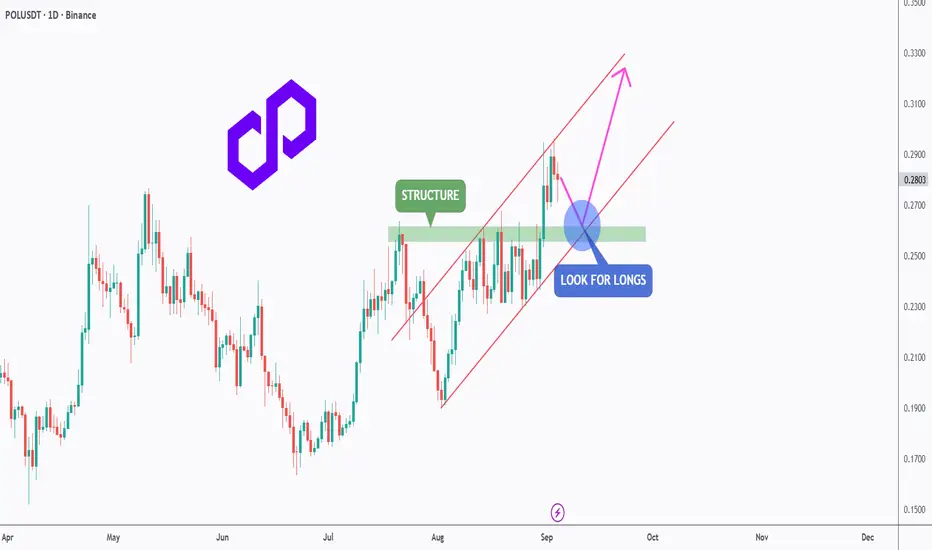
POL - Retest the Channel, Reload for the Next Leg!POLUSDT has been trading inside a clean ascending channel 📈, respecting both support and resistance levels.
After a strong push upward, price is now pulling back toward the previous structure zone around 0.26 – 0.27, which aligns perfectly with the lower bound of the channel.
This area forms a strong confluence (structure + channel support) 🔑, making it an ideal spot to look for long opportunities. As long as this zone holds, bulls 🐂 could regain control and push price toward the next resistance levels in the 0.32.
Patience here is key ⏳ — waiting for confirmation before entering can set up a high-probability continuation trade.
⚠️ Disclaimer: This is not financial advice. Always do your own research and manage risk properly.
📚 Always follow your trading plan regarding entry, risk management, and trade management.
Good luck!
All Strategies Are Good; If Managed Properly!
~Richard Nasr
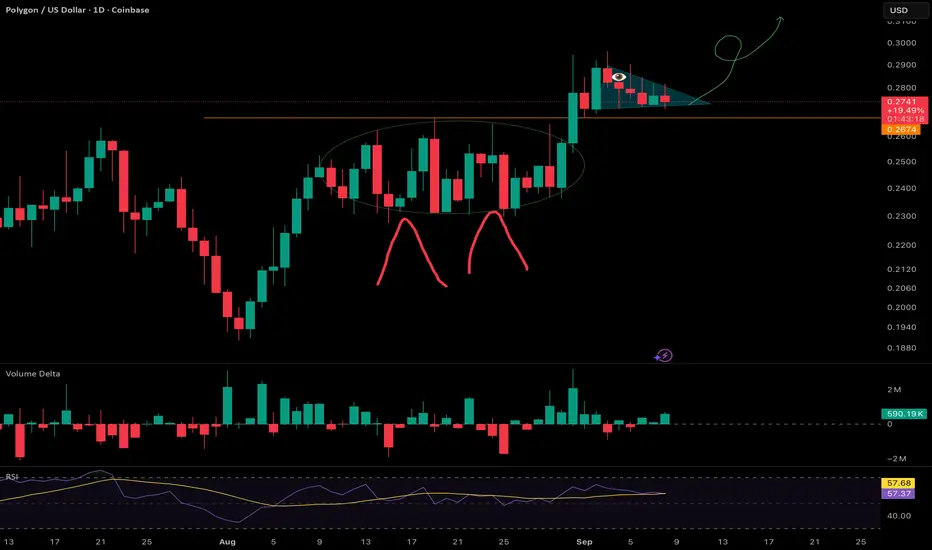
POL/USDT Trade Idea💎 BINANCE:POLUSDT Trade Idea 💎
📊 Pattern spotted: Double Bottom ✅
This setup indicates strong support around 0.2800 and signals a possible bullish reversal.
⚡ Entry (Advanced): 0.2860 – 0.2870
🎯 Target (TP): 0.2960
🛡️ Stop Loss (SL): 0.2800
✨ Risk/Reward: Low Risk – High Profit 🚀
This is an advanced entry with tight SL and strong upside potential.
📈 If the neckline breaks and sustains above, we can expect a bullish move towards the target.
🔑 Summary: Double Bottom gives confidence of reversal 📉➡️📈. Perfect setup for traders who like low loss & high reward opportunities.

POLUSDT Reversal Confirmed!POLUSDT is showing a strong bullish reversal setup on the daily chart. The price has broken above resistance and both the 100 EMA and 200 EMA, signaling a momentum shift to the upside. A clear double bottom pattern has formed, with a breakout above the neckline resistance, confirmed by high trading volume. These technical signals suggest that the market structure is turning bullish, and as long as the price holds above the breakout zone and EMA support, there is strong potential for continuation toward higher resistance levels.
Key Points:
- Price trading above 100 & 200 EMA
- Double bottom neckline breakout
-Breakout supported by high volume
- Volume profile shows major accumulation below current price, lighter resistance above
Cheers
Hexa

Is $POL (ex-#Matic) preparing for a breakout?After 4 months, the situation remains stable at OKX:POLUSDT
Key technical focus: breakout & consolidation above $0.28–0.30.
📌 Observations:
Market correction ongoing, yet #POL is holding strong.
Market Cap: ~$3B.
No major fundamental drivers currently seen.
📈 If momentum continues, x2 by the end of the year is realistic — possibly higher, depending on capital inflows.
What’s your view? Do you see hidden fundamentals supporting this strength?
______________
◆ Follow us ❤️ for daily crypto insights & updates!
🚀 Don’t miss out on important market moves
🧠 DYOR | This is not financial advice, just thinking out loud.
POL – Demand in Action!Price has been rejecting the resistance zone around 0.2620 – 0.2677 and is now approaching a key demand/support area near 0.2320 – 0.2270.
✅ If buyers step in here, we could see another bullish impulse toward the resistance levels.
✅ The demand zone remains a crucial area to watch for trend-following setups.
⚠️ However, a clear break below the 0.2270 support would invalidate this bullish scenario and shift the bias.
For now, I’m watching how price reacts at the green demand zone for the next potential swing.
📚 Always follow your trading plan regarding entry, risk management, and trade management.
Good luck!
All Strategies Are Good; If Managed Properly!
~Richard Nasr

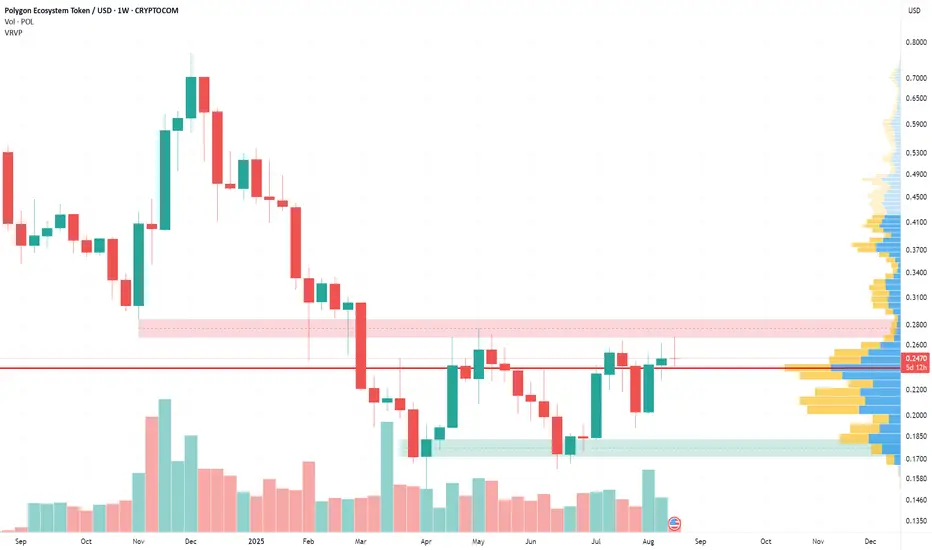
Another attempt to reverse from the downtrendPOL (MATIC) remain within downtrend on higher timeframes, but on daily shows intentions to grow higher. Red zone is old range bottom formed since token listing in 2021 and tested 4 times before break down. July 8th scam pump wick re-tested that level from below for the first time. So if manage to get there again, that will be the second time.
Monthly 20-sma moves in a downtrend - now around 0.468 and next month might be around 0.43 - that major dynamic SR is a magnet for price. At least when divergence becomes too large. So it can be taken as a target for future PA.
Smaller TF consolidation range is within 0.227 and 0.265 - will move within it till break in one of the directions.
Matic Polygon +170% SoonWhy might MATIC (Polygon) "explode" in price on certain days?
While it’s impossible to predict exact “explosive” dates, here are key catalysts and technical factors that historically drive MATIC price spikes—and may do so again:
1. Major Upgrades & Network Upgrades
The Heimdall v2 upgrade—launched July 10, 2025—marked a transformative step, slashing finality to ~4–6 seconds and speeding up block production to ~2-second intervals.
Ongoing developments as part of Polygon 2.0, AggLayer, and zkEVM integration continue to boost ecosystem potential
These upgrades often spark increased attention and price appreciation, particularly around launch or adoption milestones.
2. Technical Reversals & Chart Signals
Analyst “MasterAnanda” highlighted a bullish divergence on the 3-day RSI: Polygon’s price hit a low in April 2025, while the RSI bottomed months earlier in July 2024—suggesting a trend reversal and potential rally toward $1
If key resistance levels are breached with volume—especially following such RSI signs—traders may see "explosive" moves.
3. On-Chain Activity & Growing Adoption
The Agglayer Breakout program that airdrops tokens to POL stakers aims to enhance user participation and ecosystem engagement
Partnerships with gaming and Web3 platforms, plus zk-tech integration and account abstraction standards, help build a foundation for longer-term growth
Increased developer activity, staking incentives, and ecosystem usage can create demand surges.
4. Broader Market Trends & Macroeconomic Catalysts
As a Layer-2 Ethereum scaling solution, MATIC often moves in sync with broader crypto trends—such as bullish sentiment in Bitcoin or Ethereum
Regulatory clarity, ETFs, or institutional inflows boosting Ethereum could spill over into MATIC.
Possible bump-and-run bottom reversal over BTC. Polygon/Matic Massive bump-and-run against BTC, it may turn into an interesting entry point for this altseason. Be patient

Polygon's Comeback!#Polygon, a leader of the Ethereum ecosystem since 2019, shows signs of a major comeback after its recent bounce.
Maintaining $0.15 keeps the bullish case valid. Passing $0.28 is the first confirmation, while clearing $0.77 paves the way to target the ATH.
#Matic

MATICUSD - Resistance Flipped SupportSupport has been found along the 200MA on this 4HR chart
This line has previously been seen as an area of strong resistance but now its showing signs of support
This is a sign of further movement up on this 4Hr timeframe

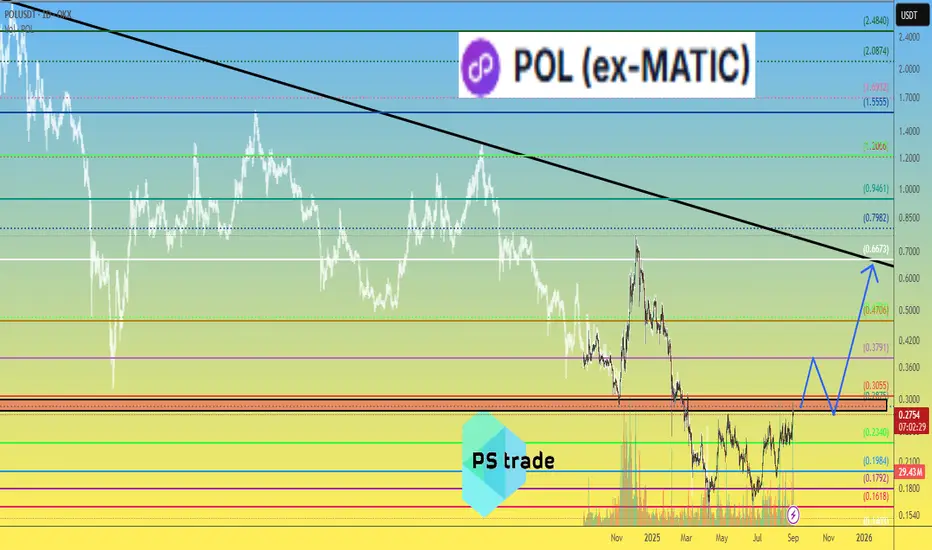
Polygon POL ex-MATIC price analysisIs the price of #POL ex-#Matic starting to wake up?
For those who are new to the crypto market, we will remind you that the last time the price of OKX:POLUSDT grew significantly was back in 2020, and since 2021 it has been in a downward trend.
The main task for #POLUSD buyers is to try to fix the price above $0.30.
📈 Only after this condition is met can a difficult and thorny path of growth to $0.66 open up.
There will surely be many people willing to sell #Polygon along the way, after 4+ years of sitting in a drawdown.
_____________________
Did you like our analysis? Leave a comment, like, and follow to get more

POL: The Return of The Matic#POL recently bounced in what could be a bullish reversal, possibly marking the end of a 3-year corrective major wave (4).
If the $0.151 low holds (stop-loss), a massive bull run shall start for #MATIC.
Passing $0.768 confirms the bullish idea of targeting the ATH.
#Polygon

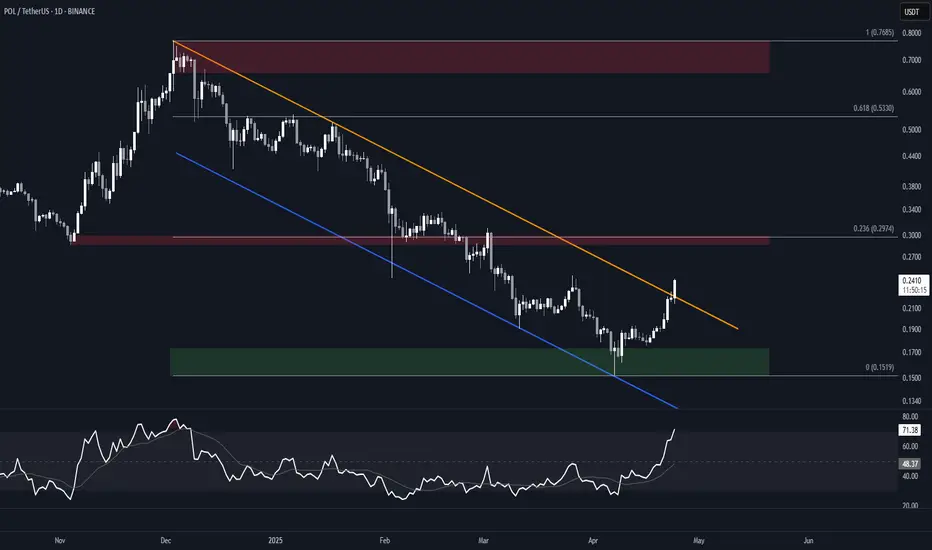
POL (MATIC) Falling Channel BreakoutBINANCE:POLUSDT is attempting a breakout from a nearly 6-months long falling channel. A daily close above the resistance would offer confirmation.
Watch for a potential retest of the resistance as support, as the overbought Daily RSI could signal an imminent pullback.
Key Levels
Aside from the support, these are all good candidates for partial TPs.
• $0.15-$0.17: Bull order block and current support
• $0.30: Previous S/R, 0.236 fib of the move down, and HVN. Will likely offer resistance.
• $0.53: Previous S/R, and 0.618 fib of the move down.
• $0.66-$0.77: Main supply zone, and December 2024 high.
MATICUSD - Weekly MACD Turning GreenFinally the MACD is coming around to the bull side on this Weekly timeframe
This is an indicator that a bull rally is coming out of this deep bear market we have seen
Bullish!

MATIC up ideaan idea suggesting a bull run for matic
matic has been in the bears control for quite awhile
Perhaps it will reverse strongly?
Breakout of channel possible
Weekly timeframe

MATIC/POL buyers beware; bearish signals in the mid-term (1W)The MATIC/POL pair has been dropping for over 1200 days from its peak price, but the structure suggests that a new bullish pattern may have started from the point where we placed the red arrow on the chart.
We’ve marked a supply zone on the chart that could reject the price downwards.
The minimum expectation is for the price to drop to TP1.
The best buying zone for MATIC/POL is the green zone at the bottom of the chart, which could push the price upwards by more than 500%. In fact, it is expected that wave A of the bearish pattern or X wave will end in this area, and the price will enter a mid-term or even long-term bullish phase.
A weekly candle closing above the invalidation level will invalidate this analysis.
For risk management, please don't forget stop loss and capital management
When we reach the first target, save some profit and then change the stop to entry
Comment if you have any questions
Thank You

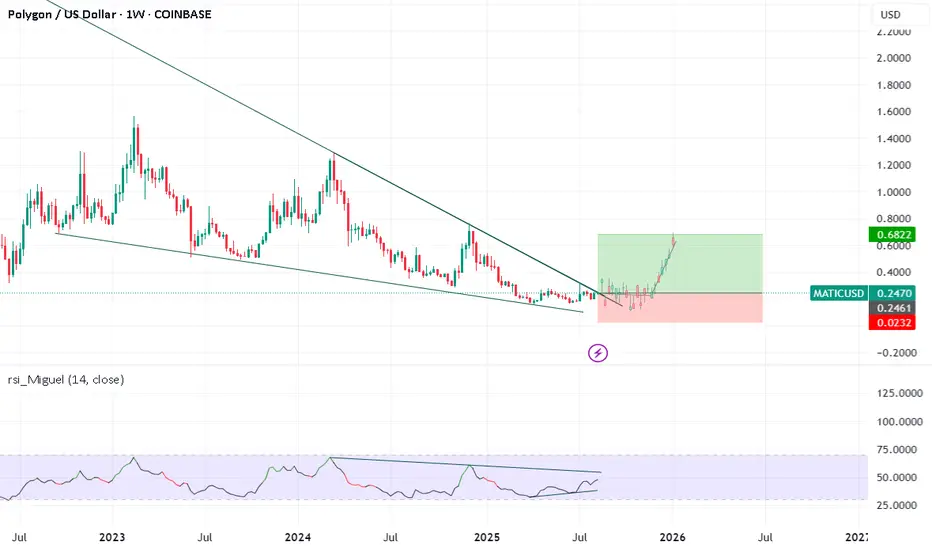
Polygon: Your Altcoin ChoicePolygon has been bearish since early December 2024, same with most of the Altcoins market. This bearish period is coming to an end and I can say this based on two simple signals. A bullish divergence with the RSI and a falling wedge pattern.
The falling wedge pattern on its own can be doubtful because it can always extend. In fact, any signal in isolation can produce more harm than good. That is why I always look at a combination of signals to support my bias.
There is also a small volume breakout yesterday. This is a weak signal but when combined with the RSI bullish divergence and marketwide action, what the rest of the market is doing, it becomes a strong early signal.
➖ MATICUSD Daily RSI Bullish Divergence
Polygon's daily RSI hit bottom in early November 2024. Ever since, it has been producing higher lows. This makes it a very strong bullish divergence. MATICUSD has been moving lower and producing strong lower lows. This is the reversal signal. Polygon will soon grow.
Thanks a lot for your Altcoin Choice.
Namaste.
