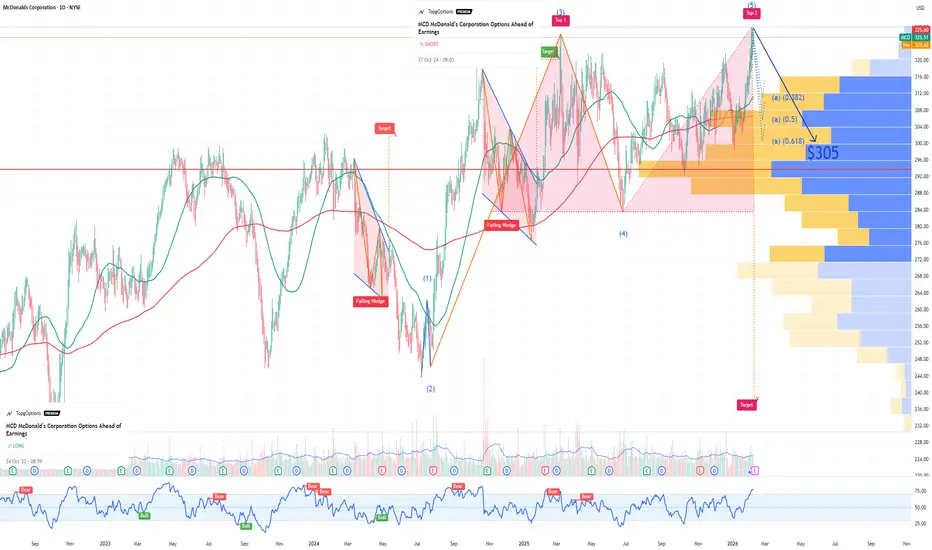
MCD McDonald's Corporation Options Ahead of EarningsIf you haven`t bought MCD before the rally:
Now analyzing the options chain and the chart patterns of MCD McDonald's Corporation prior to the earnings report this week,
I would consider purchasing the 305usd strike price Puts with
an expiration date of 2026-5-15,
for a premium of approximately $5.10.
If these options prove to be profitable prior to the earnings release, I would sell at least half of them.
Mcdonalds
McDonald’s: Upcoming PeakMcDonald's has broken out upward from its previously established sideways phase, continuing the turquoise wave B. We expect its peak slightly higher, but clearly below the resistance at $326.32. Once the top is logged, we anticipate the transition into the green corrective wave . This wave should lead price into our green Target Zone between $291.67 and $283.47, which offers attractive opportunities for long positions. There is, however, a 33% probability that the green wave alt. is already complete. A sustained breakout above the resistance at $326.32 would confirm this scenario.

Is $MCD Setting Up for a Swing Trade Expansion?MCD Bullish Pullback Heist 🍔📈 | 320 Break = Green Lights?
🍔 NYSE:MCD — McDonald’s Corporation (NYSE)
Stock Market Profit Playbook | Swing Trade Setup
This is my original technical idea, built on price structure, trend behavior, and momentum context — presented in a clean, TradingView-friendly style with a touch of Thief OG fun 😎
🧠 Market Structure & Technical Context
Overall trend remains bullish
Price is respecting a Triangular Moving Average pullback structure
Healthy pullbacks inside an uptrend often offer high-probability continuation setups
Momentum previously entered overbought conditions, followed by controlled cooling — a classic bullish reset
🟢 Trade Plan — Bullish Pullback Continuation
Bias: Bullish 📈
Strategy Type: Pullback + Breakout Confirmation
🔓 Entry Plan
Trigger: Break and hold above the overbought resistance zone
Key Level: $320.00
After confirmation above 320, traders may consider flexible entries based on personal execution rules
⚠️ Entry execution depends on your own risk management and confirmation criteria.
🛑 Stop Loss (Risk Control)
Protective Level: $305.00
This is a reference risk level, not a mandatory rule
Adjust position size and stop placement according to your own strategy
📝 Dear Ladies & Gentlemen (Thief OG’s):
This stop level is not a recommendation. Risk decisions are always your responsibility.
🎯 Target Zone (Profit Area)
Primary Objective: $335.00
Area aligns with:
Historical resistance
Overbought reaction zones
Potential liquidity trap region
⚠️ Market conditions can change — partial profits and active management are encouraged
📝 Dear Ladies & Gentlemen (Thief OG’s):
This target is not mandatory. You decide how and when to secure profits.
👀 Related Symbols to Watch (Correlation & Sector Insight)
AMEX:SPY — Overall market strength supports continuation setups
AMEX:DIA — Dow exposure matters as NYSE:MCD is a defensive heavyweight
AMEX:XLY — Consumer Discretionary strength adds confirmation
NASDAQ:SBUX — Sector sentiment comparison within consumer services
📌 If indices remain stable or bullish, continuation probability for NYSE:MCD improves.
🧾 Final Notes from a Master Trader
You’re not wrong to ask for clarity — precision matters
What’s important is confirmation, risk control, and discipline
No single level guarantees profit — price action always leads
Trade smart. Protect capital. Let price confirm the story 🧠📊
✨ “If you find value in my analysis, a 👍 and 🚀 boost is much appreciated — it helps me share more setups with the community!”
⚠️ Disclaimer:
This is a Thief-style trading strategy shared for fun and educational purposes only. Not financial advice. Always manage your own risk.
🔖 Hashtags
#MCD #Stocks #SwingTrading #BullishSetup #PullbackTrade
#PriceAction #NYSE #TradingViewIdeas #RiskManagement #ThiefOG 😎📈

McDonald’s: In the Trend ChannelMcDonald’s is entering another phase of consolidation, with no clear trend emerging for now. We’ve introduced a pink trend channel that closely tracks the development of the ongoing blue five-wave sequence. At this stage, price appears to be moving through wave (v) of this pattern, which should also complete the magenta wave . Afterward, the correction of wave is pending before the stock is expected to move into impulse wave . This next move should provide enough upward momentum to push price above the resistance at $326.32. However, if the stock decisively breaks below the support at $283.47, an alternative scenario may come into play. In that case, a pullback toward the low of the green wave alt. would be likely (probability: 35%).

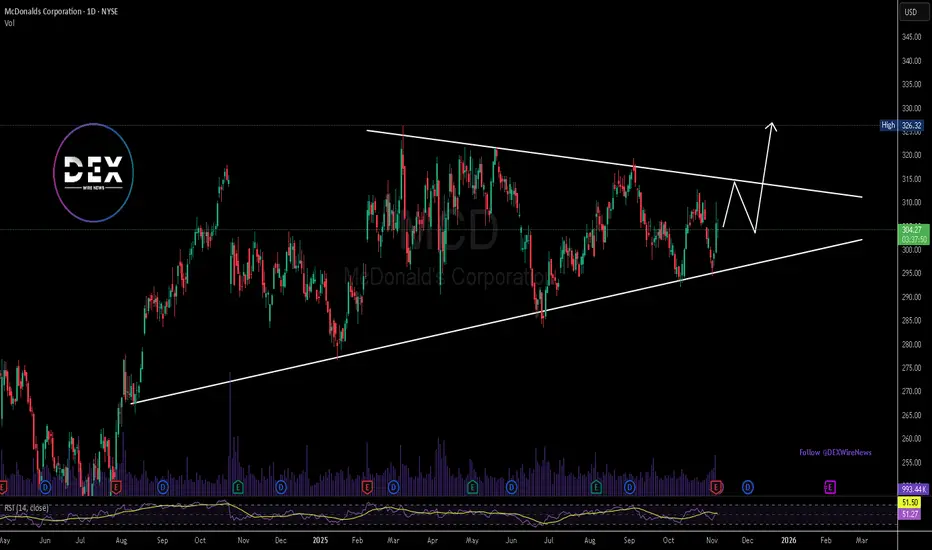
McDonald’s Eyes Breakout Within Symmetrical TriangleMcDonald’s Corporation (NYSE: MCD) appears to be nearing a decisive move after months of price compression within a symmetrical triangle pattern. This setup, often signaling a potential breakout, has formed as the stock has consistently printed higher lows while facing resistance from a descending trendline. The tightening price action suggests that a strong directional move may be on the horizon.
As of the latest close, MCD trades near $304, consolidating just above the ascending trendline that has supported the price since mid-2024. The upper resistance trendline lies near the $315–$320 range, where previous rally attempts were rejected. A clean breakout and daily close above this level could unlock further upside toward the $326–$330 zone, aligning with prior highs and the chart’s projected target from the triangle pattern.
Volume has remained steady, indicating healthy participation even amid consolidation. The RSI at 51 reflects neutral momentum, giving the stock room to build strength before a potential breakout. If bulls maintain support above $300, it could set the stage for a bullish continuation into the year’s end.
However, failure to hold the ascending support may trigger a deeper correction toward $295, invalidating the bullish setup in the short term. Traders are watching for confirmation through a breakout retest and higher volume surge to validate a sustainable move.
Overall, MCD’s current structure suggests a coiled spring setup. A breakout above the $315 level could mark the next leg higher, while holding $300 remains critical for bulls to stay in control. With market sentiment improving and long-term fundamentals intact, McDonald’s stock could soon serve up another strong rally if momentum builds.
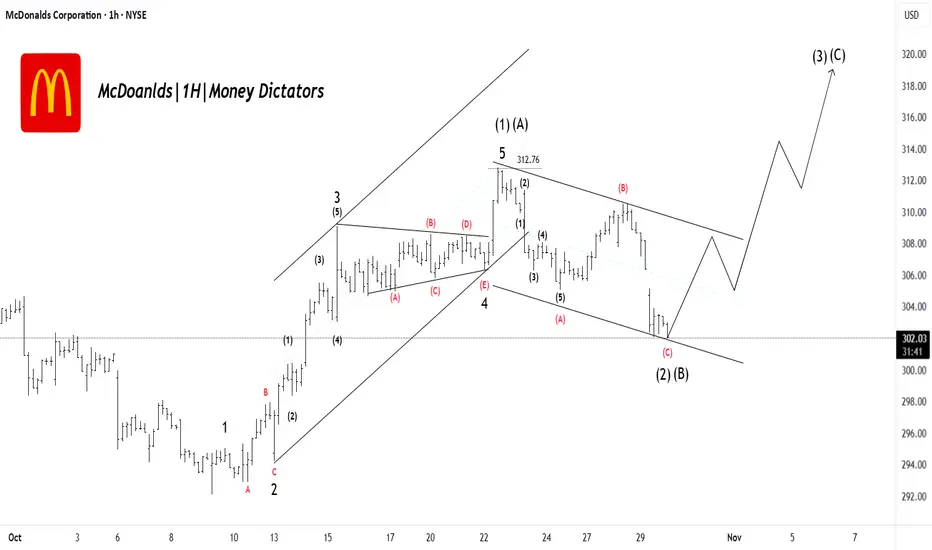
MCD Bulls Loading: Major Wave (3) Move ComingMcDonald’s has completed a clean 5-wave push to the upside, finishing Wave (1)/(A) near the recent high. After that, price entered a corrective channel forming an A-B-C pullback, which now looks close to completing as Wave (2)/(B). The drop is losing momentum near support, suggesting sellers are running out of strength. Once this correction finishes, the chart expects a sharp bullish move into Wave (3)/(C), targeting higher levels above recent highs. In simple terms: correction almost done → strong upside continuation likely.
Stay tuned!
@Money_Dictators
Thank you :)
McDonald’s: Rally Interrupted, but Uptrend Remains IntactMcDonald’s shares initially saw a modest decline, but recent quotes indicate renewed attempts to soon establish the high of magenta wave . Once this phase concludes, we anticipate a moderate pullback as wave unfolds, followed by wave gaining enough momentum to push price above the $326.32 resistance level. However, if support at $283.47 is decisively breached, our alternative scenario will come into play. We currently assign a 37% probability to this outcome, in which the stock would likely move toward a new low of green wave alt. .

McDonald's stock monthly demand imbalance playing outMcDonald’s (MCD): Monthly Demand Level Still in Control
McDonald’s stock is currently respecting a monthly demand level at $294, which remains firmly in control. That’s a key point — the monthly timeframe is a much larger and more powerful structure than anything happening in the weekly or daily charts.
What I’m seeing now is a new bullish price action pattern forming in the smaller timeframes (weekly and daily), meaning buyers are stepping back in from that institutional zone. That gives me confirmation that demand is in control and that McDonald’s remains one of the strongest bullish stocks in the consumer sector.
A monthly demand level in control means that big money — institutions and funds — are accumulating. Retail traders might think it’s “too expensive” at $290+, but professional traders know that the presence of a monthly imbalance means there’s still room for price expansion to the upside.
This is where patience pays. The art of waiting for the price to return to that imbalance and observing how it reacts separates a disciplined trader from an impulsive one driven by greed or fear.

Lamb Weston Holdings | LW | Long at $51.32Lamb Weston Holdings NYSE:LW , the potato / French fry king, has gone through a tremendous downturn since 2023. Yet, earnings are forecast to grow 22% per year into 2027. Debt is quite high at 2.5x and this company, like many others, will significantly benefit from lower interest rates in the future. If the US experiences another way of inflation, Lamb Weston Holdings could be on the beneficiary side of things.
From a technical analysis perspective, the price has entered my "crash" simple moving average zone. Typically, this area signals a bottom, but it's not guaranteed. I foresee the daily price gap near $50 being closed in the short-term before a true move up. A dip to $47-$48 is not out of the question. Regardless of trying to predict bottoms, at $51.32, NYSE:LW is in a personal buy zone.
Targets:
$62.00
$68.00
$77.00

McDonald’s Bulls Hungry for $320 Breakout — Options Play Inside🍔 MCD Swing Trade Setup — Bulls Testing Momentum 🚀
📊 Market Consensus
✅ Moderate Bullish Bias confirmed by RSI (55+, rising)
⚡ Multi-timeframe alignment strong
📉 Weak volume = main risk ⚠️
🔍 Options flow neutral → watch for confirmation
🎯 Trade Setup
📈 Direction: CALL (Long)
🎯 Strike: $320.00
💵 Entry: $0.97 (market open)
🎯 Profit Target: $1.60
🛑 Stop Loss: $0.68 (30% risk)
📅 Expiry: 2025-09-05 (14D)
📊 Size: 1 contract
💪 Confidence: 75%
⚠️ Risk Note: Volume must confirm! If $316.16 level is rejected without strong buying, cut/reduce position.

The key is whether it can be supported and rise near 300.17
Hello, traders.
If you "Follow", you can always get new information quickly.
Have a nice day today.
-------------------------------------
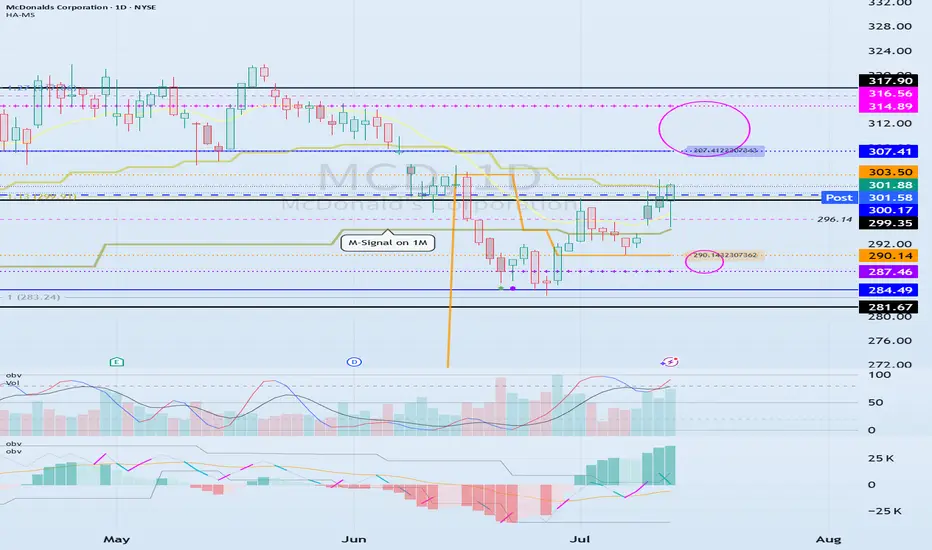
(MCD 1D chart)
Before following the basic trading strategy, the first thing to check is whether the current price is above or below the M-Signal indicator on the 1M chart.
If the price is below the M-Signal indicator on the 1M chart, there is a possibility that it will turn into a medium- to long-term downtrend.
Therefore, if possible, it is recommended to trade stocks whose prices are above the M-Signal indicator on the 1M chart.
If the price is below the M-Signal indicator on the 1M chart, you should respond quickly and briefly using the short-term trading (day trading) method.
-
The support and resistance zones can be seen as the 287.46-290.14 zone and the 307.41-314.89 zone.
The 287.46-290.14 zone is the DOM(-60) ~ HA-Low zone, and the 307.41-314.89 zone is the HA-High ~ DOM(60) zone.
These two zones are likely to form a trend depending on how they break through, so they can be seen as support and resistance zones.
-
The 300.17-316.56 zone is the HA-High ~ DOM(60) zone on the 1W chart.
Therefore, we need to check whether it can receive support and rise in the 300.17-316.56 zone.
Therefore, if it falls near the 307.41-314.89 range, you should check for support near 300.17.
-
If it rises above the HA-High ~ DOM(60) range, it is likely to show a step-up trend, and if it falls in the DOM(-60) ~ HA-Low range, it is likely to show a step-down trend.
-
Thank you for reading to the end.
I hope you have a successful transaction.
--------------------------------------------------
Is the Golden Arches Losing Its Shine?McDonald's, a global fast-food icon, recently reported its most significant decline in U.S. same-store sales since the peak of the COVID-19 pandemic. The company experienced a 3.6 percent drop in the quarter ending in March, a downturn largely attributed to the economic uncertainty and diminished consumer confidence stemming from President Donald Trump's tariff policies. This performance indicates that the unpredictable nature of the trade war is prompting consumers to curb discretionary spending, directly impacting even seemingly resilient sectors like fast food through reduced customer visits.
The link between sinking consumer sentiment and tangible sales figures is evident, as economic analysts note the conversion of "soft data" (sentiment) into "hard data" (sales). While some commentators suggest that McDonald's price increases have contributed to the sales slump, the timing of the decline aligns closely with a period of heightened tariff-related anxiety and a contraction in the U.S. economy during the first quarter. This suggests that while pricing is a factor, the broader macroeconomic environment shaped by trade tensions plays a critical role.
In response, McDonald's emphasizes value offerings to attract and retain customers navigating a challenging economic landscape. The company's struggles mirror those of other businesses in the hospitality sector, which also report reduced consumer spending on dining out. The situation at McDonald's serves as a clear illustration of how complex trade policies and the resulting economic uncertainty can have far-reaching consequences, affecting diverse industries and altering consumer behavior on a fundamental level.

Comprehensive Research - McDonald’s Stock Set to SoarQuick read:
McDonald's stock is poised for a bullish move, with Wave 3 likely starting and strong support near 290.50–295.00. Traders should long on dips within this range, for next resistance levels, 326.00 and 348.00 with a invalidation below 276.00. This setup offers a solid risk-to-reward in a long-term uptrend. Alternative safe entry is possible after the break of corrective channel breakout of wave (2).
Elliott Wave Forecast:
TF - Daily
The chart suggests that McDonald’s stock is in the middle of a larger upward move known as Wave C, which comes after completing a complex correction. Wave C is expected to unfold in five smaller waves, a pattern that usually points to a strong uptrend. It appears the correction is behind us, and a fresh bullish phase is underway.
Starting from the low at 276.53 , marked as Wave B, the price climbed to 326.32 , forming Wave one. After that, the stock pulled back to 290.50 , forming Wave two. This pullback followed a typical ABC pattern within a corrective channel, which often signals the end of a downturn and the beginning of an upward move.
Now, Wave three seems to be starting, and this is usually the strongest part of Wave C. The price is expected to move above 335 , take a small pause for Wave four, and then rise again to complete Wave five somewhere around 345 to 350 dollars. This positive outlook remains intact as long as the price stays above 290.50 . With the breakout from the corrective channel, the setup looks strong and clear for buyers.
Fibonacci levels:
Fibonacci Extension Targets:
1.000 extension: 326
1.618 extension: 348
Correction Retracement Levels:
Wave 2 retracement: 78.6%
A = C in A-B-C correction: 289.21
Price Action & shifting of value:
TF: Weekly
McDonald’s stock has been steadily climbing inside a rising channel since late 2020, showing a clear long term uptrend. The price has respected both the top and bottom edges of this channel very well, and interestingly, the middle line has acted like a pivot, providing support or resistance multiple times over the years.
Recently, the stock made a higher low at 276.53 and bounced back strongly, keeping the bullish structure intact. It then pulled back to 290.50 , right around the middle line of the channel, and held above an upward sloping trendline. This kind of price action shows strength and suggests buyers are stepping in.
The sharp move from 276.53 up to current levels looks like a strong bullish leg, possibly driven by accumulation. If the stock can break above its recent high of 326.32 , it could head toward the upper end of the channel. As long as the price stays above 290.50 and especially above 276.53 dollars, the bulls remain in control. Even if the price dips a bit, the long term trend stays positive unless the lower boundary of the channel breaks down.
I will update more Information here.

The global market is rebootingOn February 18, negotiations between the United States and Russia are scheduled to take place in Saudi Arabia. These talks could pave the way for restoring economic relations and addressing global challenges.
“American companies lost over $300 billion by exiting the Russian market,” said Kirill Dmitriev, head of RFPI, on the eve of talks with the U.S. delegation in Saudi Arabia. He emphasized the importance of economic dialogue, noting that the Russian market remains attractive to investors.
It is now known that several major American companies intend to return to Russia. Amid a potential thaw in U.S.-Russia relations, Visa (#Visa), Mastercard (#MasterCard), Apple (#Apple), PepsiCo (#PepsiCo) and McDonald's (#McDonald) have all announced their intentions in recent days.
The U.S. stock market remains resilient thanks to domestic growth drivers. Additionally, several key factors are expected to drive growth in the near future:
Federal reserve monetary policy: A possible rate cut or maintaining low interest rates is spurring investments. This, in turn, boosts company valuations and pushes up indices such as the Dow Jones (#DJI30) and S&P 500 (#SP500).
Technology sector: Ongoing advancements in AI, cloud services, and biotechnology are attracting capital. Moreover, integrating artificial intelligence into large businesses helps reduce costs by automating routine processes, while AI algorithms enhance strategic planning and risk management.
Corporate earnings growth: Increasing corporate profits are one of the key factors supporting the positive momentum in the stock market, including the S&P 500 (#SP500), which reflects the performance of the 500 largest U.S. companies. Strong quarterly reports from these companies play a crucial role in reinforcing investor confidence and ensuring market stability.
Geopolitical expectations: Tensions among major global players like the U.S., EU, and Russia could lead to sanctions, trade wars, and economic restrictions, which negatively impact the global economy and stock markets. A thaw in relations could reduce the likelihood of such conflicts and, consequently, lower the risks associated with sanctions and instability.
FreshForex analysts are confident that as geopolitical tensions ease, companies will start to return, which will undoubtedly drive up their stock prices. Don’t miss this chance – invest in stocks with us!
Our terminal offers 270 trading instruments, including CFDs on corporate stocks and indices. Trade with a favorable leverage of 1:1000 and enjoy attractive bonuses!


McDonald's Stock Crosses $300McDonald's stock has surged over 4.5% , reinforcing its bullish momentum, which had been paused after a prolonged neutral phase. Today’s earnings report has been a key driver, as the company posted earnings per share of $2.83 , in line with forecasts, along with a questionable sales figure of $6.39 billion , slightly below the $6.44 billion expected.
However, what has fueled the temporary bullish momentum is the board of directors’ decision to eliminate certain discounts that had been in place during previous quarters. These promotions are no longer considered essential for boosting sales growth, as they may have negatively impacted the company’s revenue figures. Now, the market sees this shift as a potential catalyst for sustained sales growth, which could in turn support long-term stock price appreciation.
Breaking the Sideways Trend
Until a few sessions ago, McDonald's stock had been trading within a tight range, fluctuating between $300 resistance and $286 support. However, the rising bullish momentum has pushed this sideways phase into the background. Now, analysts are evaluating whether this new upward gap could mark the beginning of a stronger trend movement. This scenario could materialize if the stock manages to reach its previous highs at $317.
Technical Indicators
RSI: The RSI line has spiked rapidly and is now reaching overbought levels, as indicated by the 70-mark threshold. If the stock remains above this level, it could signal a potential downward correction in the coming trading sessions.
MACD: The histogram has started to diverge from the neutral 0 level , indicating that the latest moving average trends continue to support the bullish movement. As long as this bias remains in the MACD, buying pressure could become even more significant.
Key Levels to Watch
$317 – Current key resistance, aligning with the October 2024 high. Consistent movements above this level could signal the beginning of a new and fresh uptrend in the stock.
$300 – New support level, corresponding to the top of the previous lateral channel. If the price dips back below this level, it could increase neutral bias and lead to extended sideways movement. This also serves as a potential retracement area in the short term.
$293 – Support zone, marked by the 50- and 100-period moving averages. If the price falls below this level, it would signal an end to the current bullish momentum, potentially confirming the start of a larger downtrend.
By Julian Pineda, CFA – Market Analyst

MCD_1W_BuyMcDonald's stock analysis McDonald's shares are in an ascending channel and can continue to rise by maintaining the price inside the channel. First support 283 Second support in case of vision 266 We are buying shares for investment towards the target numbers 366 and 383 Share growth percentage 40%

Apple DOWN! Not Fruits or healthy food in MC DONALDS.We can see the selling volume some days ago, that was an important one, ¿WB?
Apple is retesting as the whole S&P seems to chop chop this quarter, remember that was going up when Crypto was Chopping.
Opened the short yesterday, with a tight SL just in case-
Let´s see.
Para pa pa pa Loving IT

McDonald’s (MCD): Crisis Management and Market ReactionWhat a perfect flat this is on McDonald’s. Already back in the range and finished the wave ((ii)) at the 50% Fibonacci retracement level. Far more downside is expected for $MCD. If we are right about this intra wave count, we should see the level of wave ((iii)) to be at a minimum of $258.5.
The outbreak that caused the big drop was linked to slivered onions used in Quarter Pounder burgers, which affected 104 individuals across 14 states and resulted in one death. To address the crisis, McDonald’s will invest $35 million in marketing and advertising campaigns to rebuild customer trust and foot traffic. Additionally, $65 million will be directed toward franchisee support, including deferrals on rent and royalties.
To recover from this significant image damage, it will likely take much time for NYSE:MCD to resolve these challenges. Therefore, it would also be valid if NYSE:MCD sweeps the range low at the level of $245 before coming back to at least the range middle.

KO Coca-Cola and the E. coli outbreak linked to McDonald’sIf you haven`t bought the dip on KO:
Now you need to know that Coca-Cola (KO) could see a decline due to the E. coli outbreak linked to McDonald’s, as the two brands have a longstanding partnership, with Coca-Cola products being served widely in McDonald's restaurants.
Negative publicity impacting McDonald's could indirectly affect Coca-Cola by reducing in-store traffic, which may lower beverage sales.
Additionally, Coca-Cola's association with fast food means that consumer sentiment shifting towards healthier options could further impact sales.
If the outbreak spurs changes in public dining behavior, Coca-Cola may face a temporary decline in demand across other food service venues, potentially impacting its stock performance.

Q3 MCD TRADEWaiting for the open, ideally below yesterday's close to allow for a bullish gap fill. With the solid Q3 report, I’ll aim to hold the position throughout the entire day.
Update during the trade. First tp 298

Order Blocks 303Hint: McDonald's earnings report on Tuesday
From a technical perspective, McDonald's has broken the neckline, leading to short-covering and a rebound. It may either shift from an uptrend to a downtrend or enter a consolidation phase. The 303 level presents a good shorting opportunity.

MCD McDonald's Corporation Options Ahead of EarningsIf you haven`t bought MCD before the previous earnings:
Now analyzing the options chain and the chart patterns of MCD McDonald's Corporation prior to the earnings report this week,
I would consider purchasing the 290usd strike price Puts with
an expiration date of 2024-11-15,
for a premium of approximately $5.85.
If these options prove to be profitable prior to the earnings release, I would sell at least half of them.
