MDTMedtronic reported its Q2 fiscal year 2026 results (ended in October):
Revenue: +6.6% YoY — exceeding market expectations.
EPS: +7.9% YoY — also beating forecasts.
Cardiovascular segment: Grew by 10.8%.
Growth Drivers:
Technological Breakthroughs:
Affera & Sphere-9: The cardiac mapping system’s install base doubled during the quarter.
Symplicity Spyral: This hypertension treatment device has received approval from major US insurers (covering 30 million lives). The potential market is estimated at 18 million patients in the US alone.
Strategic Moves:
Within this calendar year, Medtronic is spinning off its diabetes division into a separate company, MiniMed. This is expected to unlock hidden value for shareholders and allow the core business to focus on higher-margin products.
On February 3, 2026, Medtronic announced its intention to acquire CathWorks for $585 million. The deal provides access to the FFRangio system, a non-invasive technology for diagnosing coronary artery disease, further strengthening a cardiology portfolio that accounts for nearly 40% of total revenue.
Dividends:
The company has raised its dividend for 47 consecutive years. The 48th increase is expected in just a few months.
Dividend yield: ~2.8%
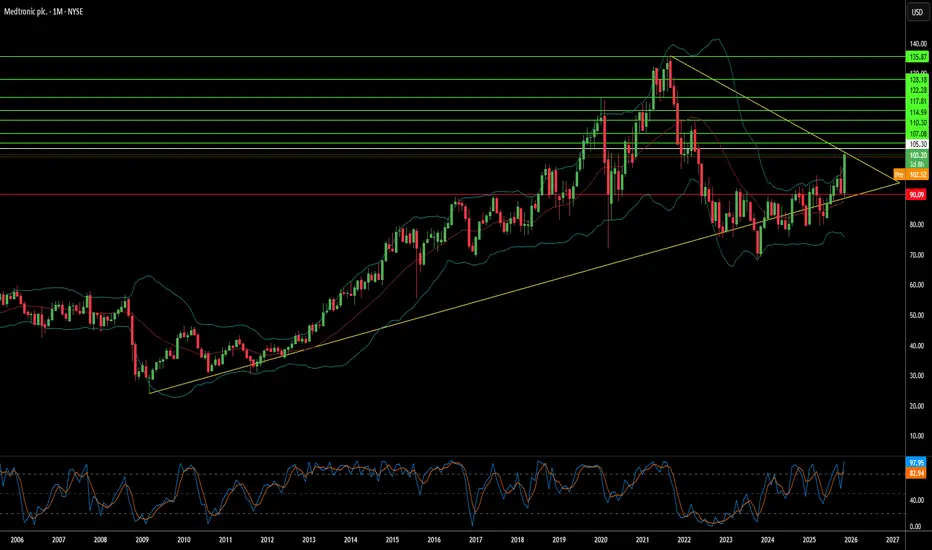
Technical Analysis:
The stock is currently trading within an ascending channel.
The price has broken through a local resistance level and successfully completed a retest.
MDT

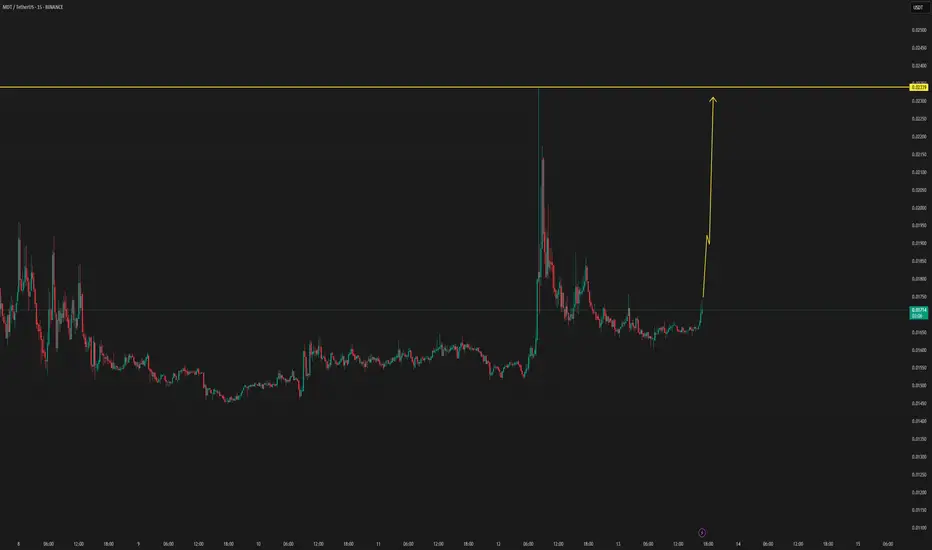
MDTUSDT Forming Falling WedgeMDTUSDT is forming a clear falling wedge pattern, a classic bullish reversal signal that often indicates an upcoming breakout. The price has been consolidating within a narrowing range, suggesting that selling pressure is weakening while buyers are beginning to regain control. With consistent volume confirming accumulation at lower levels, the setup hints at a potential bullish breakout soon. The projected move could lead to an impressive gain of around 190% to 200% once the price breaks above the wedge resistance.
This falling wedge pattern is typically seen at the end of downtrends or corrective phases, and it represents a potential shift in market sentiment from bearish to bullish. Traders closely watching MDTUSDT are noting the strengthening momentum as it nears a breakout zone. The good trading volume adds confidence to this pattern, showing that market participants are positioning early in anticipation of a reversal.
Investors’ growing interest in MDTUSDT reflects rising confidence in the project’s long-term fundamentals and current technical strength. If the breakout confirms with sustained volume, this could mark the start of a fresh bullish leg. Traders might find this a valuable setup for medium-term gains, especially as the wedge pattern completes and buying momentum accelerates.
✅ Show your support by hitting the like button and
✅ Leaving a comment below! (What is your opinion about this Coin?)
Your feedback and engagement keep me inspired to share more insightful market analysis with you!
Can a Medical Giant Transform Into a Growth Story?Medtronic has demonstrated significant momentum entering 2026, with its recent 23% share price appreciation reflecting fundamental improvements rather than speculative enthusiasm. The company delivered strong fiscal Q2 2026 results with revenue reaching approximately $9 billion, up 6.6% year-over-year, while adjusted earnings per share rose 8% to $1.36, surpassing both internal projections and analyst expectations. Most notably, cardiovascular revenue surged 10.8% to roughly $3.4 billion, marking the strongest growth in over a decade outside pandemic periods and suggesting sustainable acceleration across its core business.
The company's pulsed-field ablation technology has emerged as a transformative growth driver, with the PulseSelect system achieving FDA clearance as the first PFA platform for treating atrial fibrillation. This innovation propelled a 71% revenue surge in Cardiac Ablation Solutions during Q2, including 128% growth in the United States. Beyond cardiology, Medtronic's Hugo robotic-assisted surgery system represents a strategic initiative to penetrate the underdeveloped surgical robotics market. The system has recently been submitted for FDA clearance following successful urologic trials, achieving a 98.5% success rate. These technological advances position Medtronic across multiple high-growth segments, including neuromodulation, renal denervation, and diabetes management.
From an investment perspective, Medtronic offers a compelling combination of quality, income, and growth potential. The company has raised its dividend for 48 consecutive years, maintaining Dividend Aristocrat status with a current yield in the low-3% range above the S&P 500 average while preserving capital for R&D investment and strategic acquisitions. Management has demonstrated improved execution with consistent guidance raises, and balanced capital allocation between shareholder returns and innovation funding. While risks remain around robotics execution, diabetes strategy decisions, and payer negotiations, the fundamental thesis appears intact for long-term investors seeking defensive growth with rising cash flows and exposure to structural healthcare trends driven by aging demographics and minimally invasive procedure adoption.
MDT | Monster Rally Incoming!!! | LONGMedtronic Plc is a medical technology company, which engages in the development, manufacture, distribution, and sale of device-based medical therapies and services. It operates through the following segments: Cardiovascular Porrtfolio, Neuroscience Portfolio, Medical Surgical Portfolio, and Diabetes Operating Unit. The Cardiovascular Portfolio segment includes products for the diagnosis, treatment, and management of cardiac rhythm disorders and cardiovascular disease. The Neuroscience Portfolio is made up of cranial and spinal technologies, specialty therapies, and neuromodulation divisions. The Medical Surgical Portfolio is comprised of surgical innovations and respiratory, gastrointestinal, and renal divisions. The Diabetes Group segment offers insulin pumps, continuous glucose monitoring systems, and insulin pump consumables. The company was founded in 1949 and is headquartered in Dublin, Ireland.

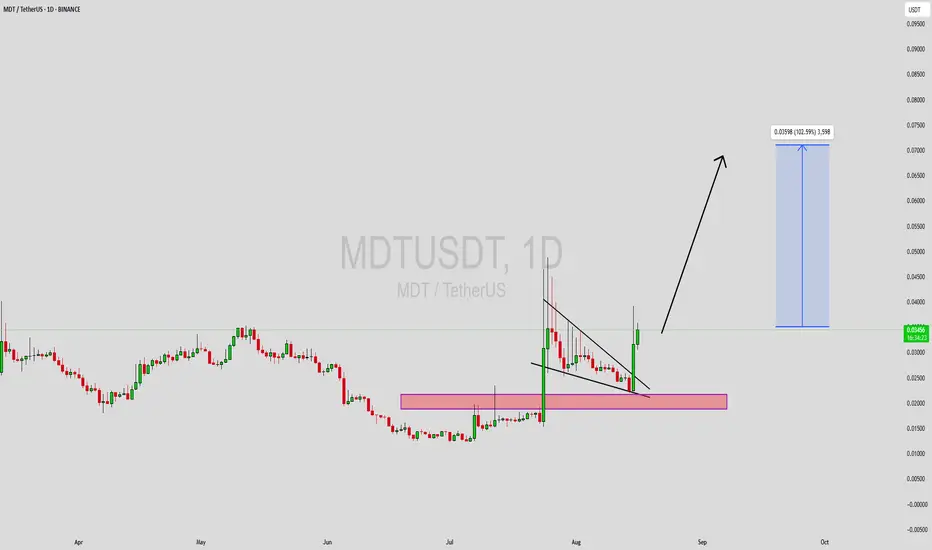
MDTUSDT Forming Falling WedgeMDTUSDT is forming a strong falling wedge pattern, a bullish setup that often signals a potential reversal and the start of a major upward trend. After an extended consolidation phase, the price appears to be tightening within the wedge, suggesting that selling pressure is weakening and buyers are gradually taking control. This pattern typically precedes a powerful breakout, and with the current technical structure, MDTUSDT could be gearing up for a potential gain of 90% to 100% once the breakout confirms.
The trading volume for MDTUSDT has remained consistently healthy, supporting the likelihood of a bullish move. Increased accumulation during this phase indicates that investors are positioning themselves early in anticipation of a breakout. The strong volume backing suggests that once resistance levels are breached, momentum could accelerate quickly, pushing prices to new short-term highs.
Market sentiment around MDT (Measurable Data Token) has been improving, with investors showing renewed interest in its data-driven blockchain solutions. The combination of positive sentiment, strong volume, and a classic bullish reversal pattern creates a favorable setup for potential upside. Traders are closely monitoring key breakout zones that could trigger a new wave of bullish momentum and potentially initiate a longer-term uptrend.
✅ Show your support by hitting the like button and
✅ Leaving a comment below! (What is You opinion about this Coin)
Your feedback and engagement keep me inspired to share more insightful market analysis with you!

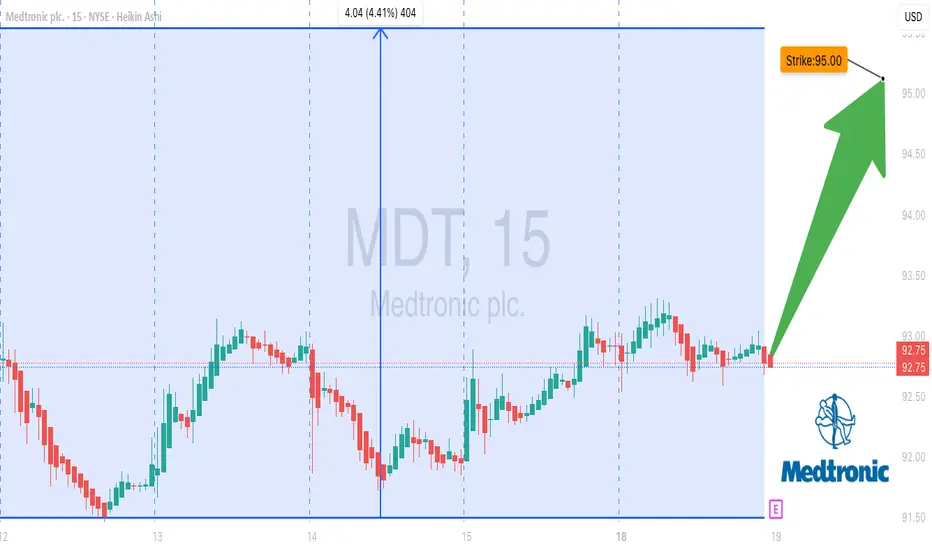
MDT Earnings Explosion – 95C Call for Big Gains!
# 💉 MDT Earnings Call Option – 95C Play (8/21 BMO)
📊 **Market Snapshot**
* Revenue Growth: +3.9% TTM
* Margins: Profit 13.9%, Operating 17.1%, Gross 65.4%
* Earnings Beat History: 100% past 8 quarters ✅
* Forward EPS: \$5.85 → ambitious 62% growth expectation
* Technical Support/Resistance: \$92 / \$96.25
* Options Flow: Balanced calls/puts, slight put skew
* IV Rank: 60% → moderate implied volatility
---
## 🎯 Trade Setup (Pre-Earnings)
* **Instrument**: MDT
* **Direction**: CALL (LONG)
* **Strike**: \$95
* **Expiry**: 2025-08-22
* **Entry Price**: \$1.62
* **Profit Target**: \$4.50 (\~200% potential)
* **Stop Loss**: \$0.81 (50% of premium)
* **Size**: 1 contract
* **Confidence**: 70%
* **Entry Timing**: Pre-earnings close
* **Earnings Date/Time**: 8/21 BMO
* **Expected Move**: \$4.90
---
## ⚡ Risk Management
* **Position Sizing**: Limit to 1–2% of portfolio
* **Exit Scenarios**:
* Profit Target → \$4.50
* Stop Loss → \$0.81
* Time Exit → Close within 2 hours post-earnings if neither triggered
* **Volatility Risk**: Moderate (watch IV crush)
---
# 🏥 MDT 95C Call – Earnings Surge Play 🐂
🎯 Entry: \$1.62 → Target: \$4.50
🛑 Stop: \$0.81
📅 Exp: 8/22 BMO
📈 Bias: Moderate Bullish (70%)
---
📊 **TRADE DETAILS JSON**
```json
{
"instrument": "MDT",
"direction": "call",
"strike": 95.00,
"expiry": "2025-08-22",
"confidence": 70,
"profit_target": 4.50,
"stop_loss": 0.81,
"size": 1,
"entry_price": 1.62,
"entry_timing": "pre_earnings_close",
"earnings_date": "2025-08-21",
"earnings_time": "BMO",
"expected_move": 4.90,
"iv_rank": 0.60,
"signal_publish_time": "2025-08-18 14:10:12 UTC-04:00"
}
``
MDTUSDT Forming Descending TriangleMDTUSDT is currently forming a classic descending triangle pattern, which is typically a continuation pattern suggesting potential for a strong move once a breakout occurs. The price structure is showing repeated lower highs while maintaining a relatively stable support level, indicating pressure is building up. This kind of technical setup often results in a sharp breakout if supported by increasing volume and broader market sentiment.
With good volume already observed on recent candles, the chances of a bullish breakout are increasing. The descending triangle pattern has been developing over time, and the current positioning near the breakout level is promising. If MDTUSDT breaks above the resistance zone, a strong rally toward the projected 90% to 100% gain is highly probable, especially considering growing investor interest in the project.
This setup aligns with key bullish trading strategies, particularly for those watching for momentum-based breakouts. Traders should keep an eye on volume spikes and candle confirmations at resistance to validate entry points. As the pattern matures, the potential for a trend reversal or breakout continuation becomes more evident, especially on higher time frames like the daily or weekly charts.
✅ Show your support by hitting the like button and
✅ Leaving a comment below! (What is You opinion about this Coin)
Your feedback and engagement keep me inspired to share more insightful market analysis with you!
MDT (SPOT)BINANCE:MDTUSDT
#MDT/ USDT
Entry range (0.01950- 0.02250)
SL 1D close below 0.01870
T1 0.03500
T2 0.05500
_______________________________________________________
Golden Advices.
********************
* collect the coin slowly in the entry range.
* Please calculate your losses before the entry.
* Do not enter any trade you find it not suitable for you.
* No FOMO - No Rush , it is a long journey.

MDT / UsdtBINANCE:MDTUSDT
Just do it. Need to hold that area or we will .........
Disclaimer : Not Financial advice

MDT (SPOT)BINANCE:MDTUSDT
#MDT/ USDT
Entry range (0.01350- 0.01480)
SL 4H close below 0.01251
T1 0.01900
T2 0.02200
T3 0.02438
_______________________________________________________
Golden Advices.
********************
* collect the coin slowly in the entry range.
* Please calculate your losses before the entry.
* Do not enter any trade you find it not suitable for you.
* No FOMO - No Rush , it is a long journey.

MDTUSDT Forming Bullish WaveMDTUSDT is currently forming a bullish wave pattern, indicating a strong potential for continued upward momentum. This wave structure reflects healthy market cycles, with higher highs and higher lows suggesting that bulls are steadily gaining control. As this wave pattern matures, the current market setup hints at a possible breakout, which could push prices significantly higher in the near term.
The volume backing MDTUSDT is robust, which provides a solid confirmation for the ongoing trend. Good volume during the accumulation and breakout phases is essential for sustaining a bullish wave. If the pair maintains its current buying pressure, traders could expect a strong rally, with a projected gain between 90% to 100% based on historical wave completions and resistance breakouts.
Investors and traders have started showing increasing interest in MDT, further validating its bullish potential. This growing attention not only boosts market confidence but also contributes to stronger liquidity, which is critical for smooth and sustained upward movement. Technical traders watching for confirmation of the next wave will likely key in on breakout zones and RSI/volume confluences.
In summary, MDTUSDT is showing signs of entering a powerful bullish continuation phase, supported by strong volume and increasing market interest. As the wave structure plays out, this pair could offer an excellent opportunity for swing traders aiming for mid-to-high double-digit returns.
✅ Show your support by hitting the like button and
✅ Leaving a comment below! (What is You opinion about this Coin)
Your feedback and engagement keep me inspired to share more insightful market analysis with you!

MDT NEW INCREASE VOLUMEMDT/USDT has new volume upcoming, which can be confirmed in the coming time frames. by new confirmations, the update will be followed below.
MDTUSDT 1WMDT ~ 1W Analysis
#MDT Trading is very high risk. Buy gradually from here with a short -term target of at least 20%+.
MLong

$MDT Update - Above 200MA on hourly=wave up to $0.68We have a bullish crossover of the 200ma looking at the hourly.
Yesterday's callout was priced at $0.046, currently above $0.05,
Target sell at $0.068
Still a 30%+ profit on the table if you get in quickly enough.
Enjoy the profits.

$MDT Update - Bullish swings = Profits if paying attentionIf you have been following this trade since initially called out I hope you are enjoying these profitable swings as I am?
Solid low risk swings as it broke out the wedge and flipped top line resistance into lower support and holding.
Looks like another tap near $21 is coming up again.
Enjoy the profits!!!
MLong

MDT Update - New Target PlottedPlotted the solid take profit line (blue box). Under 200 MA, proper buy zone for another run up when it crosses back over.

#MDT(SPOT) entry ( 0.03670- 0.04260) T.(0.08959) SL(0.03547)BINANCE:MDTUSDT
entry range ( 0.03670- 0.04260)
Target (0.08959)
SL .1D close below (0.03547)
*** collect the coin slowly in the entry range ***
*** No FOMO - No Rush , it is a long journey ***
**** #Manta ,#OMNI, #DYM, #AI, #IO, #XAI , #ACE #NFP #RAD #WLD #ORDI #BLUR #SUI #Voxel #AEVO #VITE #APE #RDNT #FLUX #NMR #VANRY #TRB #HBAR #DGB #XEC #ERN #ALT #IO #ACA #HIVE #ASTR #ARDR #PIXEL #LTO #AERGO #SCRT #ATA #HOOK #FLOW #KSM #HFT #MINA #DATA #SC #JOE #RDNT #IQ #CFX #BICO #CTSI #KMD #FXS #DEGO #FORTH # AST #PORTAL #CYBER #CLV #RIF #ENJ #ZIL #APT #GALA #STEEM #ONE #LINK #MDT ****

%570 Daily Volume Increase, Huge Opportunity
MDTUSDT is showing a 570% increase in daily volume, indicating a surge in trading activity and presenting a huge opportunity. The blue boxes highlight the best demand zones, where strong buying interest is expected.
Monitor these zones for price reactions or lower time frame market structure breaks to confirm entries. Always trade with proper risk management.
I keep my charts clean and simple because I believe clarity leads to better decisions.
My approach is built on years of experience and a solid track record. I don’t claim to know it all, but I’m confident in my ability to spot high-probability setups.
My Previous Analysis
🐶 DOGEUSDT.P: Next Move
🎨 RENDERUSDT.P: Opportunity of the Month
💎 ETHUSDT.P: Where to Retrace
🟢 BNBUSDT.P: Potential Surge
📊 BTC Dominance: Reaction Zone
🌊 WAVESUSDT.P: Demand Zone Potential
🟣 UNIUSDT.P: Long-Term Trade
🔵 XRPUSDT.P: Entry Zones
🔗 LINKUSDT.P: Follow The River
📈 BTCUSDT.P: Two Key Demand Zones
🟩 POLUSDT: Bullish Momentum
🌟 PENDLEUSDT: Where Opportunity Meets Precision
🔥 BTCUSDT.P: Liquidation of Highly Leveraged Longs
🌊 SOLUSDT.P: SOL's Dip - Your Opportunity
🐸 1000PEPEUSDT.P: Prime Bounce Zone Unlocked
🚀 ETHUSDT.P: Set to Explode - Don't Miss This Game Changer
🤖 IQUSDT: Smart Plan
⚡️ PONDUSDT: A Trade Not Taken Is Better Than a Losing One
💼 STMXUSDT: 2 Buying Areas
🐢 TURBOUSDT: Buy Zones and Buyer Presence

Measurable Data (MDT)MDT is a decentralized data exchange economy built on the Ethereum Blockchain.
mdt token is a standard ERC 20 token and facilitates the economy of the MDT ecosystem, It denominates the value of big data and serves as mechanism for utility in the ecosystem.
recently Chain announced the acquisition of the MeasurableData platform in a deal worth over $100 million
in a month MDT price moved from 0.025 to 0.036 and today we had 80 million volume
short tg 0.039 , 0.043 , 0.051

MDT Medtronic plc Options Ahead of EarningsIf you haven`t bought the dip on MDT:
Now analyzing the options chain and the chart patterns of MDT Medtronic plc prior to the earnings report this week,
I would consider purchasing the 85usd strike price Calls with
an expiration date of 2024-8-23,
for a premium of approximately $1.32.
If these options prove to be profitable prior to the earnings release, I would sell at least half of them.

MDTUSDT.1DAnalyzing the daily chart of MDT/USDT (Measurable Data Token paired with US Dollar Tether), I note several key technical details and their implications on potential trading strategies:
Trend Analysis
The chart depicts an overarching bearish trend since April, with price peaks progressively declining. This downtrend was temporarily challenged by recent upward movements, but the price has yet to convincingly break the descending trendline (S1), which continues to act as dynamic resistance.
Support and Resistance Levels
R1 ($0.04800): This resistance level has been tested multiple times, most recently in early August. It's a crucial marker for any bullish reversal.
R2 ($0.05605): Slightly higher, R2 represents a significant historical resistance level. A break above R1 with substantial volume could see prices testing this higher resistance.
S2 ($0.03350): Currently acting as the nearest support. It's important because it held during the latest bearish momentum in July, suggesting a potential bounce-back point if retested.
Technical Indicators
MACD: The Moving Average Convergence Divergence is showing a slight bullish crossover, though the histogram is near zero, indicating a potential shift in momentum but with limited strength.
RSI: The Relative Strength Index is around 47.51, which is neutral. It neither suggests overbought nor oversold conditions, indicating a balance in buying and selling pressures.
Current Market Position
The price at around $0.04399 is slightly above S2 and below R1. The recent price action suggests a tentative recovery, but the ongoing pressure from the descending trendline (S1) and resistance at R1 caps upward movements.
Trading Strategy
Given the market's position, a cautious approach is warranted. Watching how the price behaves around the descending trendline S1 will be key. A breakout above this trendline with a clear close above R1 could signal a change in the prevailing bearish trend and might offer a buying opportunity with a target of R2, placing a stop-loss just below S2.
Conclusion
In summary, MDT exhibits signs of potential recovery within a broader bearish context. A conservative trading strategy would be to wait for a confirmed breakout above key resistance levels before entering long positions. Additionally, keeping an eye on the MACD and RSI for stronger bullish signals could help refine entry and exit points. As always, traders should be prepared to adjust their strategies based on evolving market conditions.

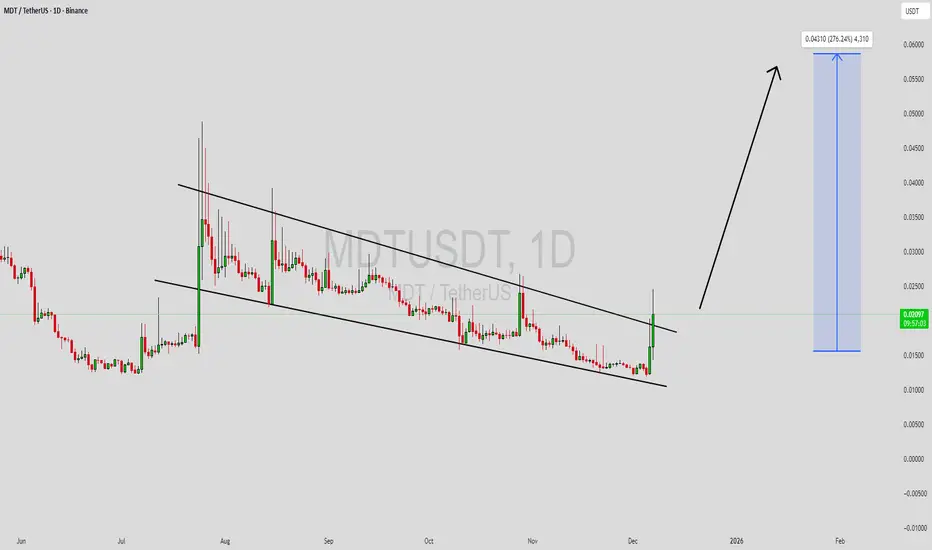
MDTUSDT.1DMDT/USDT Daily Analysis
As we examine the MDT/USDT daily chart, it is evident that the price is currently trading within a range-bound consolidation phase. The price has recently tested and respected the support level (S1) at $0.03530, which has acted as a strong demand zone, providing stability and preventing further declines.
The resistance level (R1) at approximately $0.04310 has been a significant barrier for the bulls, as evidenced by multiple rejections in the past. This level is crucial for any bullish continuation. If the price manages to break above this resistance, the next target would be the secondary resistance (R2) around $0.05161.
The chart shows a potential bullish breakout, as the price is currently attempting to surpass the descending trendline that has been governing the downtrend since early May. A successful breakout above this trendline would likely confirm a reversal, leading to further upward momentum toward R2.
The MACD indicator, though currently showing a slight bullish crossover, remains relatively neutral, indicating a lack of strong momentum in either direction. However, the histogram's positive value suggests that buying pressure might be gradually increasing.
The RSI is currently at 43.15, indicating that the asset is neither overbought nor oversold, providing room for potential upside. The RSI's recent upward movement is a positive sign, hinting at a possible shift in market sentiment toward the bulls.
In conclusion, MDT/USDT is at a critical juncture. The price action suggests a potential bullish breakout, but confirmation is required with a sustained move above the R1 resistance level and the descending trendline. Should this occur, we could expect further gains toward the R2 resistance. However, failure to break above R1 could result in continued consolidation or a retest of the support at S1. Traders should remain cautious and look for strong confirmation before taking any positions.

#MDT/USDT#MDT
The price is moving within a descending channel pattern on the 4-hour frame and broke it upwards after adhering to it significantly
We have a downtrend on the RSI indicator and it was broken upwards and we have a trend to stabilize above it
We have a major support level in green at a price of 0.04000
We have a trend to dot above the moving average 100
Entry price 0.04500
First target 0.04833
Second target 0.05127
Third target 0.05470
