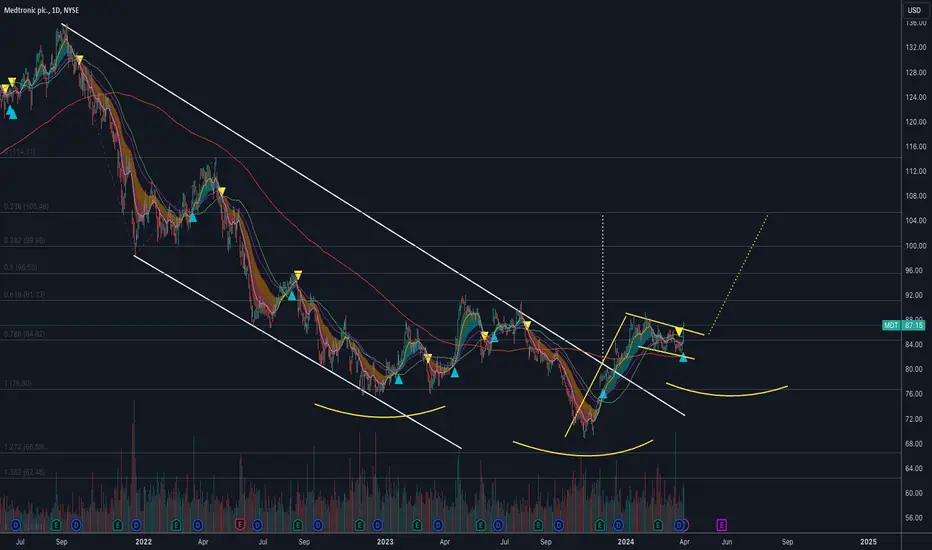
Bullish potential detected for MDTEntry conditions:
(i) higher share price for NYSE:MDT along with swing up of indicators such as DMI/RSI, and
(ii) observation of market reaction around the potential support/resistance line of $83.85 from the open of 23rd April.
Depending on risk tolerance, the stop loss for the trade would be:
(
Compare with Medtronic plc.
3.74 USD
4.80 B USD
36.36 B USD
1.28 B
Next report date
—
Report period
—
EPS estimate
—
Revenue estimate
—
Details
Sector
Industry
CEO
Geoffrey Straub Martha
Website
Headquarters
Galway
Founded
2014
IPO date
Nov 21, 1977
ISIN
IE00BTN1Y115
FIGI
BBG000BNWG87
Identifiers
ISIN IE00BTN1Y115
Medtronic Plc is a medical technology company, which engages in the development, manufacture, distribution, and sale of device-based medical therapies and services. It operates through the following segments: Cardiovascular Porrtfolio, Neuroscience Portfolio, Medical Surgical Portfolio, and Diabetes Operating Unit. The Cardiovascular Portfolio segment includes products for the diagnosis, treatment, and management of cardiac rhythm disorders and cardiovascular disease. The Neuroscience Portfolio is made up of cranial and spinal technologies, specialty therapies, and neuromodulation divisions. The Medical Surgical Portfolio is comprised of surgical innovations and respiratory, gastrointestinal, and renal divisions. The Diabetes Group segment offers insulin pumps, continuous glucose monitoring systems, and insulin pump consumables. The company was founded in 1949 and is headquartered in Dublin, Ireland.
MDT | Continued stock growth- Timeframe: Weekly
- Trade type: Buy stop order
- Price: 84.03
- Take Profit: Open
- Stop Loss: 81.49 (-3.00 %)
Idea: Long on a breakout above last week's high - bullish momentum continuation.
Entry: Buy stop above last week’s high.
Stop-loss: Below the low of the same candle.
If the weekly candle
MDT | The time to go long has come- Timeframe: Weekly
- Trade type: Buy stop order
- Price: 82.48
- Take Profit: Open
- Stop Loss: 78.30 (-5.10 %)
Idea: Long on a breakout above last week's high - bullish momentum continuation.
Entry: Buy stop above last week’s high.
Stop-loss: Below the low of the same candle.
If the weekly candle
Trading Plan for MDTTrading Plan for MDT
Asset: US Stock MDT
Timeframe: Weekly Chart
Current Price: $77.50
Wait for pullback on lower timeframes to go long.
Entry: $72.80
Stop Loss: $67.50
Profit Targets & Management
1. TP1: $85.50. Reduce half position and adjust stop loss to lock profits.
2. TP2: $96.60. Reduce
Medtronic bounce setup as price holds near $87 support:Current Price: 87.21
Direction: LONG
Confidence level: 55%(Strong bullish sentiment on X with all tracked tweets leaning bullish, but limited YouTube trader data and mixed technical signals reduce conviction.)
Targets
Target 1: 90.00
Target 2: 92.00
Stop Levels
Stop 1: 85.00
Stop 2: 83.00
Wisd
Everyone panics at this point — the real move begins here.MDT is currently sitting right on the TrendGo Accumulatelevel - a zone that has repeatedly acted as a foundation for previous moves.
This is not a random bounce area.
Across the chart, we can see a clear pattern:
→ price returns to Accumulate
→ pressure stabilizes
→ a new phase begins
Right n
Beautiful HH HL. MDT Analysis
Closed at 102.90 (07-02-2026)
Beautiful HH HL.
Weekly Candle is Doji. So next few candles
should be monitored.
Sustaining 101 - 102 may confirms the Breakout &
we may witness ABCD pattern targeting around 115 - 116
after crossing 106 with Good Volumes.
However, breaking 95 may bring m
A Defensive Dividend Aristocrat Poised for Strategic CatalystsSynthesized Investment Thesis for Medtronic (MDT): A Defensive Dividend Aristocrat Poised for Strategic Catalysts
Medtronic's recent market outperformance amidst broader volatility highlights its status as a defensive, high-quality holding within the healthcare sector. The stock represents a compell
See all ideas
Summarizing what the indicators are suggesting.
Neutral
SellBuy
Strong sellStrong buy
Strong sellSellNeutralBuyStrong buy
Neutral
SellBuy
Strong sellStrong buy
Strong sellSellNeutralBuyStrong buy
Neutral
SellBuy
Strong sellStrong buy
Strong sellSellNeutralBuyStrong buy
An aggregate view of professional's ratings.
Neutral
SellBuy
Strong sellStrong buy
Strong sellSellNeutralBuyStrong buy
Neutral
SellBuy
Strong sellStrong buy
Strong sellSellNeutralBuyStrong buy
Neutral
SellBuy
Strong sellStrong buy
Strong sellSellNeutralBuyStrong buy
Displays a symbol's price movements over previous years to identify recurring trends.
Maturity dateMar 15, 2044
Coupon4.63% (Fixed)
Maturity dateMar 15, 2045
Coupon4.63% (Fixed)
Maturity dateApr 1, 2043
Coupon4.00% (Fixed)
Maturity dateMar 15, 2040
Coupon5.55% (Fixed)
Maturity dateMar 15, 2039
Coupon6.50% (Fixed)
Maturity dateMar 15, 2035
Coupon4.38% (Fixed)
Maturity dateMar 30, 2033
Coupon4.50% (Fixed)
Maturity dateOct 15, 2053
Coupon4.15% (Fixed)
Maturity dateOct 15, 2050
Coupon1.63% (Fixed)
Maturity dateJul 2, 2049
Coupon1.75% (Fixed)
Maturity dateOct 15, 2045
Coupon4.20% (Fixed)
See all MDT bonds
Frequently asked questions
The current price of MDT is 90.76 USD — it has increased by 1.42% in the past 24 hours. Watch Medtronic plc. stock price performance more closely on the chart.
Depending on the exchange, the stock ticker may vary. For instance, on NYSE exchange Medtronic plc. stocks are traded under the ticker MDT.
MDT stock has risen by 6.07% compared to the previous week, the month change is a 9.48% rise, over the last year Medtronic plc. has showed a −2.24% decrease.
We've gathered analysts' opinions on Medtronic plc. future price: according to them, MDT price has a max estimate of 121.00 USD and a min estimate of 78.00 USD. Watch MDT chart and read a more detailed Medtronic plc. stock forecast: see what analysts think of Medtronic plc. and suggest that you do with its stocks.
MDT stock is 2.86% volatile and has beta coefficient of −0.03. Track Medtronic plc. stock price on the chart and check out the list of the most volatile stocks — is Medtronic plc. there?
Today Medtronic plc. has the market capitalization of 116.07 B, it has increased by 6.09% over the last week.
Yes, you can track Medtronic plc. financials in yearly and quarterly reports right on TradingView.
Medtronic plc. is going to release the next earnings report on Sep 1, 2026. Keep track of upcoming events with our Earnings Calendar.
MDT earnings for the last quarter are 1.55 USD per share, whereas the estimation was 1.54 USD resulting in a 0.64% surprise. The estimated earnings for the next quarter are 1.39 USD per share. See more details about Medtronic plc. earnings.
Medtronic plc. revenue for the last quarter amounts to 9.81 B USD, despite the estimated figure of 9.62 B USD. In the next quarter, revenue is expected to reach 9.55 B USD.
MDT net income for the last quarter is 1.24 B USD, while the quarter before that showed 1.14 B USD of net income which accounts for 0.00% change. Track more Medtronic plc. financial stats to get the full picture.
Yes, MDT dividends are paid quarterly. The last dividend per share was 0.72 USD. As of today, Dividend Yield (TTM)% is 3.14%. Tracking Medtronic plc. dividends might help you take more informed decisions.
Medtronic plc. dividend yield was 3.41% in 2025, and payout ratio reached 76.20%. The year before the numbers were 3.33% and 77.47% correspondingly. See high-dividend stocks and find more opportunities for your portfolio.
As of Aug 12, 2026, the company has 95 K employees. See our rating of the largest employees — is Medtronic plc. on this list?
EBITDA measures a company's operating performance, its growth signifies an improvement in the efficiency of a company. Medtronic plc. EBITDA is 9.98 B USD, and current EBITDA margin is 27.57%. See more stats in Medtronic plc. financial statements.
Like other stocks, MDT shares are traded on stock exchanges, e.g. Nasdaq, Nyse, Euronext, and the easiest way to buy them is through an online stock broker. To do this, you need to open an account and follow a broker's procedures, then start trading. You can trade Medtronic plc. stock right from TradingView charts — choose your broker and connect to your account.
Investing in stocks requires a comprehensive research: you should carefully study all the available data, e.g. company's financials, related news, and its technical analysis. So Medtronic plc. technincal analysis shows the buy rating today, and its 1 week rating is buy. Since market conditions are prone to changes, it's worth looking a bit further into the future — according to the 1 month rating Medtronic plc. stock shows the buy signal. See more of Medtronic plc. technicals for a more comprehensive analysis.