AUDCHF Weekly Wedge gearing up for potential break!AUDCHF has been forming a nice wedge pattern on the Weekly. I know that a break of this wedge may not materialize for a couple weeks, but who knows - if it breaks, however, we will be ready.
The measured objective may be off by some pips, so please make your own measurements and take your trades based off of your own strategy.
Trade idea - waiting for possible break of wedge trend lines and then I will share my directional bias and look for trades at that point.
Safe trading everyone!
Measuredmove

USD/CAD ready for a nap?Bonjour,
Our members had a great trade in the USD/CAD for the past two weeks ... and we've been following it up for quite some time, milking pips out of the market the whole time. But is it poised for a reversal? Well, the charts seem to corroborate that thesis ...
Most instruments that have completed a measured move (I view a 92%, and above, a completed move) needs to be re-evaluated before entering a new position. Remember that there "health" of this pair is still fine if it retraces to the 50% fib level before continuing its upwards trajectory.
Until then, we'll sit patiently on the sidelines and wait for the perfect opportunity to enter another trade.
À bientôt
Maxmillian DuPont
(www.myfxlifestyle.com)

GBPAUD - Head and Shoulders Pattern Confirmed, Get ReadyGreetings Fellow Traders,
I posted just a few days ago about a key technical level on GBPAUD for a short opportunity that could lead to a Head and Shoulders Pattern confirmation. At the end of Tuesday's trading candle the market confirmed the break by closing well over 100 pips below the neck line.
As with all very significant breaks of support and resistance we are looking to gain an optimal entry on this position by waiting for the market to retest the significant level. Patience is key.
Head and Shoulders Patterns typically have a measured objective that equals the distance from the neck line to the top of the 'head'
Trade Opportunity:
Sell Limit 2.06800 or Manual Entry
Stop Loss 2.10000
Target Profit 1: 2.0250
Target Profit 2: 1.9750
Target Profit 3: 1.9250
Additional Details:
The market needs to respect the neck line that has been identified, look for a daily close ABOVE 2.0740 to negate this pattern. It is perfectly acceptable for the market to spike into this territory but CLOSE lower. The CLOSE of the daily candle is the significant factor.
Please do your own analysis before entering a trade. If you like what you see feel free to comment, follow or "like"

EURCAD - Descending Wedge 4 Hour Chart - Pending BuyGreetings Traders,
In correlation with our anticipated USDCAD move...I've spotted a descending wedge on EURCAD that is trade-able.
Due to the nature of the peaks however, to avoid any false breakouts I've set the following trade:
Pending Buy Stop 1.43550 - Or Manual Entry Along SUPPORT
Stop Limit 1.4250
Target Profit 1.4640
Straight forward trade, as I mentioned above the peaks for the top of the wedge are kind of sloppy but uniform...it was almost 2 acceptable lines and we're in between both of them currently. If the market should move much lower before hitting the Buy Stop for a new high, I will be looking to manually enter a buy at 1.4240 (or wherever the support is at that time. 100 pip stop loss and same take profit.
Please do your own analysis before entering a trade. Feel free to comment/"like" or follow.

EURGBP - Descending Wedge - 1 Hour to 4 Hour Long OpportunityGreetings,
Fairly simple trade Descending Wedge - These patterns typically break out counter to the trend that preceded them, with their measured objective at the first peak that started the trading pattern.
Entry Point at Market - .7141
Target Profit - .7240
Stop Loss - .7090
Please do your own analysis before entering a trade, and feel free to comment, "like" or follow!

AUDUSD - Confluence of measured moves to 0.74 levelsMeasured move targets of the triangle + the rectangle range
Bear flag targets of 127.2% and 161.8%
Keep an eye on 0.7665. A bounce above this level will infer that this analysis is invalidated. A bounce back to 0.7665 on break out to the upside should result in exiting the trade at close to 0 loss.
FOMC due on Tuesday, so apply money management and be aware of the volatility.

AYI measured move up to $180?AYI initially caught my eye from the daily price action. The March 2014 resistance has been retested and is now support. Price is above the $150 half figure. And yesterday's breakout bar was very bullish on higher volume.
On the weekly chart the inverted head and shoulders also stood out as a reason to go long on this stock. A measured move would take price to above $180.
However, I am not confident that the right shoulder is correctly placed. At first glance it seems an ideal formation - the second shoulder is higher (preferable in an uptrend) and the neckline is sloping up (also preferable in an uptrend). But looking at volume the second rally was down on volume, which is not what we would want to see. This leaves some doubt as to whether the measured move is valid.
Overall, this is a buy opportunity (although I will not be trading it due to the thin volume) but a target of $180 is not realistic, at this stage.

JOY gaps down past previous supportI last looked at JOY on 12th December 2014 when it gapped down (confirming an inverted cup and handle formation).
At the time there were still a few support zones to tackle - plus earnings. So although I felt that in the longer-term price would continue to fall I wanted to wait for price to clear these hurdles.
Unfortunately this meant waiting for the cup and handle measured move to complete - which it did on yesterday's gap down. However, it was worth the wait as after the earnings announcement price retested the cup and handle rim (with support turning into resistance). And there was still the 2010 pivot low Of $42.45 to clear.
Now there is no obvious further support until the $30 zone. Worth shorting if you are happy to sell in an overall bull market - although if I take this trade I will want added confirmation by waiting for price to break below the $40 round number.

HHC inverted cup and handleHHC is a little low on volume for me to trade but I like the sell/short set-up currently on offer. Price has the potential to fall to just below $104.
There is currently strong support at around $100 (as seen from the weekly chart) and, if price approaches this level, we need to we aware of the weekly 200ma (which may come into play as further support).
On the daily chart, since price reached a high of $160, price has fallen below the daily 200ma with a couple of headfakes. These may have breached the 200ma but they also formed a double top chart pattern (at just above the $150 half figure) so the momentum looked like it would continue to the downside.
A bear move did transpire and more recently an inverted cup and handle formed (and was confirmed with yesterdays bar). As there is no major support to stop price until the $100 zone a measured move from the cup and handle could well materialise. This would take price down to approximately $104 - a possible move of more than 1500 points.
If you are happy to trade stocks with such low volume the set-up on HHC looks good.

RCL bull flag breaks above $80I last analysed RCL a few weeks ago on the gap up following a cup and handle formation. At the time I recommended a near-term buy (which would've realised a small profit) but to hold off for a longer-term trade.
Since then price has made a new high, pulled back slightly and then yesterday's bar broke out confirming a bullish flag (plus breaking the $80 mark on higher volume). The trend is now reasonably well established and I will look to enter this stock at the next possible opportunity.

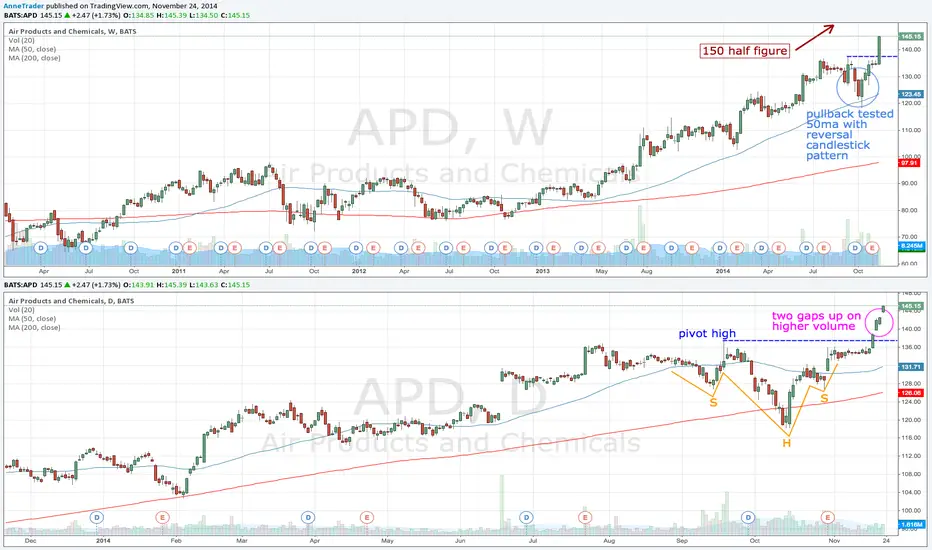
APD potential measured move upAPD has been in an uptrend all year but the deep pullbacks have made it too unpredictable to long-term trade so far.
On the daily chart an inverted head and shoulders chart pattern offered an opportunity to trade a measured move up. Since the break of the pivot high (which also confirmed the H&S pattern) there have been two gaps up on slightly higher volume.
This had the potential set-up for an almost $20 move up but, if you missed the first gap, the risk:reward is rapidly declining.
It offers a very good buy for a short-term trade as the momentum is up (with the gap, volume and bullish bar all in the direction of the trend).
But for longer-term traders you may want to now wait for a break above the $150 half figure before looking to trade this one.
YHOO breaks above $50YHOO has not been on my watchlist for many years. I have posted the monthly chart to show why. After reaching it's peak in 2000 ($125) it has struggled to reach its former glory.
But now we can see that a cup and handle has formed. And if price responses with a measured move then we can anticipate a substantial move up (possibly by as much as $30).
On the daily chart price broke through the September pivot high at the end of October. This was the first opportunity to buy into this stock but, despite the monthly cup and handle, more cautious traders may have wanted to wait for price to break through the $50 half-figure.
With this now achieved a pullback (or retest of $50) and subsequent breakout could offer a secondary zone at which to buy.

ENH cup and handle formingENH is not the best looking chart to trade right now but there's a textbook Cup and Handle forming on the weekly chart. Price just need to break the January high of $58.83 to confirm this chart pattern.
Normally a cup and handle is tradable on the breakout but this one has taken almost a year to form so it may be advisable to wait a little longer - rather than getting caught on a fakeout.
Volume is low on this stock, so price action is less predictable than would be expected for a more liquid stock. However, if it can break the resistance and 60 figure, a measured move could see ENH head towards $68.


LMT measured moveLMT put in a motive wave, retraced and then put in another motive wave of the same % move. Frost and Prechter in their book said this is a common occurrence so i've been watching and sure enough here it is.
