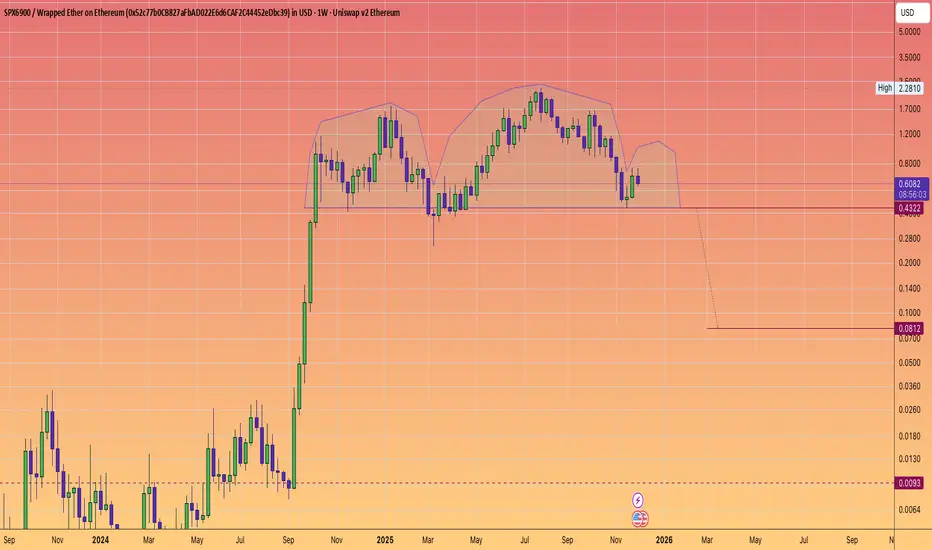
SPX6900 The meme with no community and doomed to crash.The S&P500 is at 6900
so why hold a memecoin for a target that has already been met.
SELL!
SELL!
SELL!
In true Cramer fashion :)
You will be glad you did if you are still holding, hoping and praying.
Memes
[MEME-PLAY] - 4 - 4
Meme-play - No thesis - Quick in - Out.
Notes on how I personally use my charts/NFA:
Each level L1-L3 and TP1-TP3 (Or S1-S3) has a deployment percentage. The idea is to flag these levels so I can buy 11% at L1 , 28% at L2 and if L3 deploy 61% of assigned dry powder. The same in reverse goes for TP. TP1: 61%, TP2:28% and TP3:11%. If chart pivots between TP's, in-between or in Between Sell levels these percentages are still respected. I like to use the trading range to accumulate by using this tactic.
Just my personal way of using this. This is not intended or made to constitute any financial advice.
This is not intended or made to constitute any financial advice.
NOT INVESTMENT ADVICE
I am not a financial advisor.
The Content in this TradingView Idea is for informational purposes only, you should not construe any such information or other material as legal, tax, investment, financial, or other advice. Nothing contained within this idea constitutes a solicitation, recommendation, endorsement, or offer to buy or sell any securities or other financial instruments in this or in in any other jurisdiction in which such solicitation or offer would be unlawful under the securities laws of such jurisdiction.
All Content on this idea post is information of a general nature and does not address the circumstances of any particular individual or entity. Nothing in the idea/post constitutes professional and/or financial advice, nor does any information on the idea/post constitute a comprehensive or complete statement of the matters discussed or the law relating thereto. You alone assume the sole responsibility of evaluating the merits and risks associated with the use of any information or other Content on the idea/post before making any decisions based on such information.
Sir. Galahad - QUANT
Disclaimer
The information and publications are not meant to be, and do not constitute, financial, investment, trading, or other types of advice or recommendations supplied or endorsed by.

2026 setup well for upside surprise for crypto Hype +20% from swing low + hip3 equity perps momentum. Pump +100% from swing low + pump spotlight invest program
Sol onchain 100M runners + seeker launch airdrop stimmy to core sol holders
Metals parabolic & btc/gold & btc/silver pairs at multi-year lows
All crypto groupchats pivoting to stocks exposure + publicly shaming the industry as a whole
Combination of doublezero+alpenglow+firedancer will meaningfully improve solana's underlying technical infra & give perfect setup for new meta to form onchain
2026 setup well for upside surprise for crypto imo

Memes disbelief rally loading? From a purely technical standpoint, independent of the fundamental tailwinds around Bonk’s revenue streams, launchpad activity, and WLFI involvement, price is setting up cleanly for a high EV rebound off the November lows.
Structure suggests demand is beginning to absorb supply after an extended compression. If BTC and majors stabilize here and transition into either continuation or even a simple relief rally, Bonk is one of the large cap memes that tends to respond asymmetrically.
The trade is straightforward. Target the November open and prior highs, with a clearly defined invalidation @ the yearly open. Risk is well-contained, upside is convex and the setup benefits from broader market beta without needing perfection.

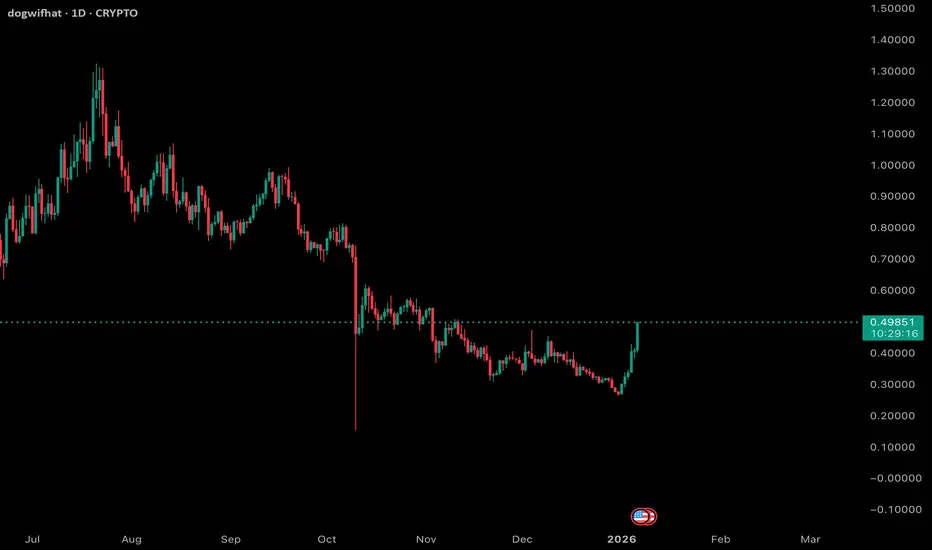
$WIF 1D Update: The pump is starting... SOL memes coming back? WIF is finally starting to show some strength on the daily. After a long period of basing and grinding near the lows, price is now pushing higher with an impulsive move rather than another weak bounce. That’s a meaningful change in character compared to what we’ve seen over the past few months.
This pump is coming after extended compression and seller exhaustion, which is typically where sharper relief moves can originate. The reclaim of the recent range highs suggests buyers are stepping in with more conviction, not just short covering.
That said, this is still early. One green candle doesn’t flip the higher timeframe trend by itself, but it does shift the short-term bias from purely defensive to cautiously constructive. If price can hold above this breakout area and avoid immediately retracing the move, it increases the odds that this is more than just a dead cat bounce.
Overall, WIF is looking better than it has in a while. I’m watching closely to see if this strength can build into follow-through and higher lows rather than fading back into the prior range.
1W WIF Chart: Potential bottom on WIF? I’m watching WIF cautiously on the weekly, but it’s now firmly on my radar for a potential bottoming process, along with other SOL ecosystem meme coins.
After a prolonged and aggressive downtrend from the highs, downside momentum has slowed materially. Price is no longer cascading lower and is instead compressing near the lows, which is often how these assets begin transitioning from distribution into early accumulation. This isn’t a reversal yet, but it is a change in behavior.
Structurally, WIF is spending time building value near the bottom of its range rather than bouncing and failing immediately. Volatility has contracted significantly compared to prior selloffs, and each push lower is attracting quicker responses from buyers, even if they’re still cautious.
I’m not assuming this is a bottom, but this is the zone where bottoms typically form if they’re going to form at all. The key for me will be time and confirmation: higher lows, reduced sell pressure, and eventually a reclaim of prior weekly resistance. Until then, patience is critical.
This same dynamic is starting to show up across several SOL meme names, which makes it worth monitoring as a group rather than in isolation. For now, this remains a watch-and-wait situation, with risk management front and center and no need to force exposure before the structure proves itself.

#MEME/USDT is Bullish#MEME
The price is moving in a descending channel on the 1-hour timeframe. It has reached the lower boundary and is heading towards breaking above it, with a retest of the upper boundary expected.
We have a downtrend on the RSI indicator, which has reached near the lower boundary, and an upward rebound is expected.
There is a key support zone in green at 0.001144. The price has bounced from this zone multiple times and is expected to bounce again.
We have a trend towards consolidation above the 100-period moving average, as we are moving close to it, which supports the upward movement.
Entry price: 0.001172
First target: 0.001194
Second target: 0.001229
Third target: 0.001271
Don't forget a simple point: money management.
Place your stop-loss below the support zone in green.
For any questions, please leave a comment.
Thank you.

PUMPUSDT = Time to buy?🐸 NYSE:PUMP #PumpFun ➖ Time to buy?
Chart (PUMPUSDT):
PUMP is down 72% from its all-time high. Looking at the liquidation map, this looks like a solid entry point to grab some PUMP for part of the portfolio with around +150% upside potential.
Take-profit target is $0.007 ➖ right where the biggest cluster of short liquidations sits.

WIF back to $3Complete look at Dog WIF Hat
We had some pretty nice technical setups on this meme.
#HVF
#DoubleTop
#InverseHeadandShoulders
#BullFlag
Currently it has two active patterns ...

$FLOCK breakout in progress Price reclaiming key level$FLOCK breakout in progress Price reclaiming key levels with strong momentum. Price breaking out of the wedge Bulls aiming for the 0.40–0.45 zone next Volume confirming the upside pressure Potential rally toward 0.50 if momentum holds.

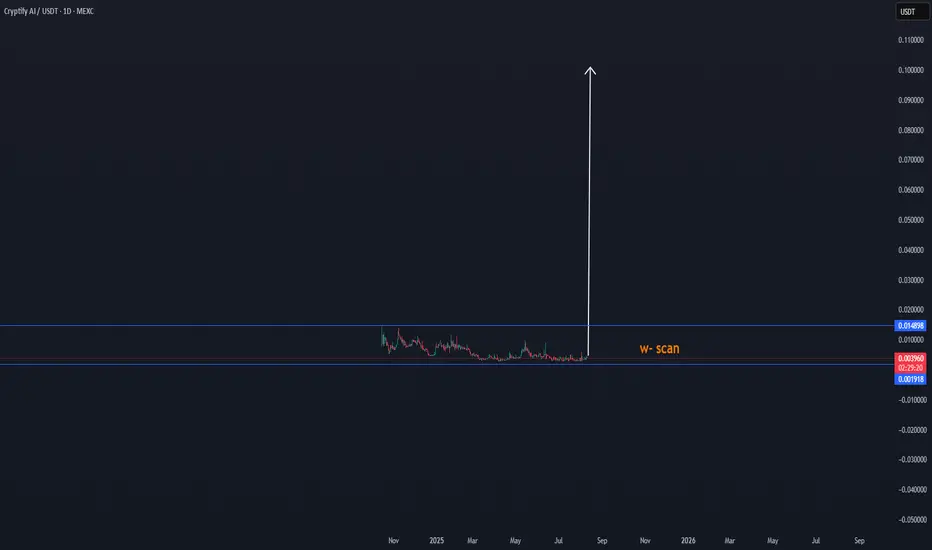
CRAI/USDT is able to breakout as never before x10Our study shows that this small-cap coin can show interesting targets in the coming time, as data shows this, so we will follow it to see new confirmations.
All updates will be here on this page
The price is running now at around: $0,03947 as the chart shows.
CLong
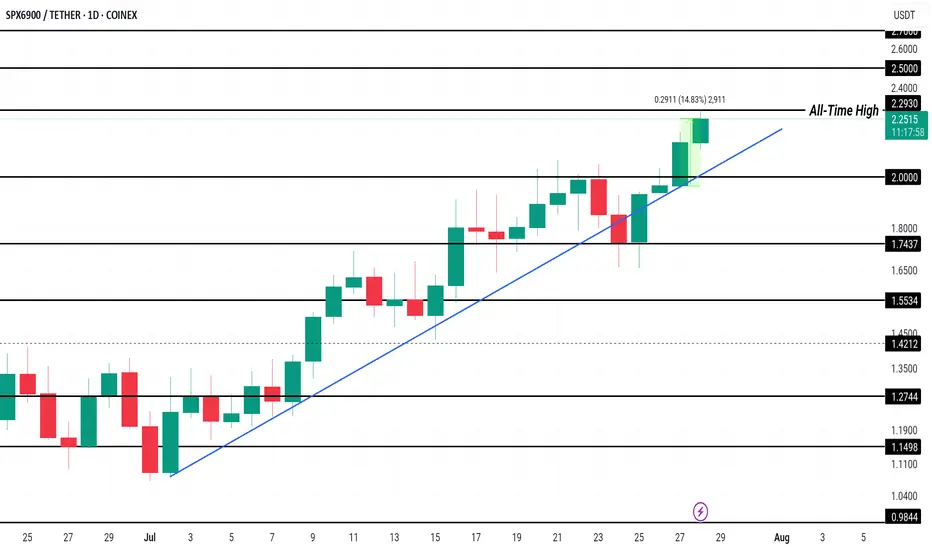
SPX Price Hits New All-Time High, $2.50 Up NextCOINEX:SPXUSDT has been experiencing a consistent uptrend since the beginning of the month, leading to the formation of multiple all-time highs, including one today at $2.27 . This price action reflects strong investor interest, pushing the altcoin to new levels and generating a positive market sentiment.
Currently trading at $2.23, COINEX:SPXUSDT has gained 14% in the past 24 hours . The Ichimoku Cloud, acting as support, signals bullish momentum. This suggests that SPX could rise further, with the potential to reach $2.50 or higher if market conditions remain favorable and investor confidence persists.
However, if selling pressure intensifies, COINEX:SPXUSDT could experience a reversal . A dip below the $2.00 support could push the altcoin toward $1.74 or lower, invalidating the bullish outlook.
The best-looking HTF meme chart, hands down is $PENGUThe team behind the crypto mascot accomplished a lot over the last couple of weeks, and the TA is showing;
- CBOE filing for PENGU ETF
- Appeared at @Nasdaq
- Listed on @eToro
- Listed on @RevolutApp
- Listed on @Official_Upbit
- Listed on @WebullGlobal Pay
- @NASCAR Partnership
- PEZ x Pudgy Penguins Partnership
- Miles & More Partnership
- @PenguClash reached 2M+ on waitlist
- 1B views per day
All this and much more!
@pudgypenguins are doing it the right way 🐧

Get Ready! Hot Air Rises. Fartcoin About To Break Wind.Trading Fam,
Our national debt is a meme. The buying power of our dollar is a meme. Our monetary system is a meme. The Fed is a ponzi scheme and a meme. Everything related to geopolitical economics has become a meme. We can't take any of this stuff seriously anymore. So, why not make a profit on the best memes of the day? Enter pungeant FARTCOIN. AI-created and managed, FARTCOIN is cutting loose with no reservations. And it looks like it is about to break wind again. They say hot air rises. Let's see how far this stink can go.
Let her rip!
Stew

Can Penguins Fly?Pudgy Penguins #Pengu is up nicely already 3.6X from it's april low.
And is sitting nicely outside the top 100 CMC list and is the 8th biggest Memecoin by marketcap.
It appears it is on the cusp of a cup and handle breakout and projects to a very high flying 5 cent log projection.
(#Crypto's are highly speculative and can go down -99%)

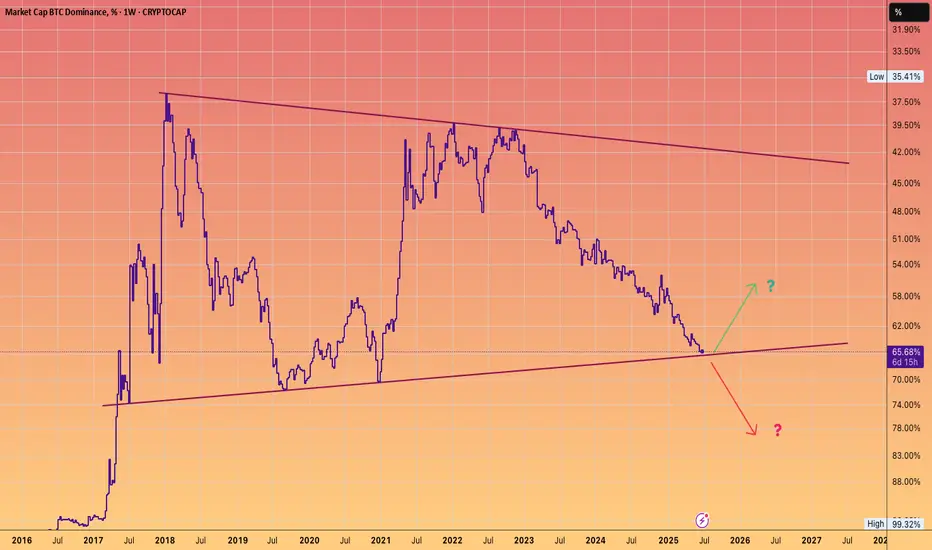
BTC DOMINANCE at pivotal juncture.Which direction do you favour?
The chart is inverted, so the up move will result in #Alts outperforming #Bitcoin.
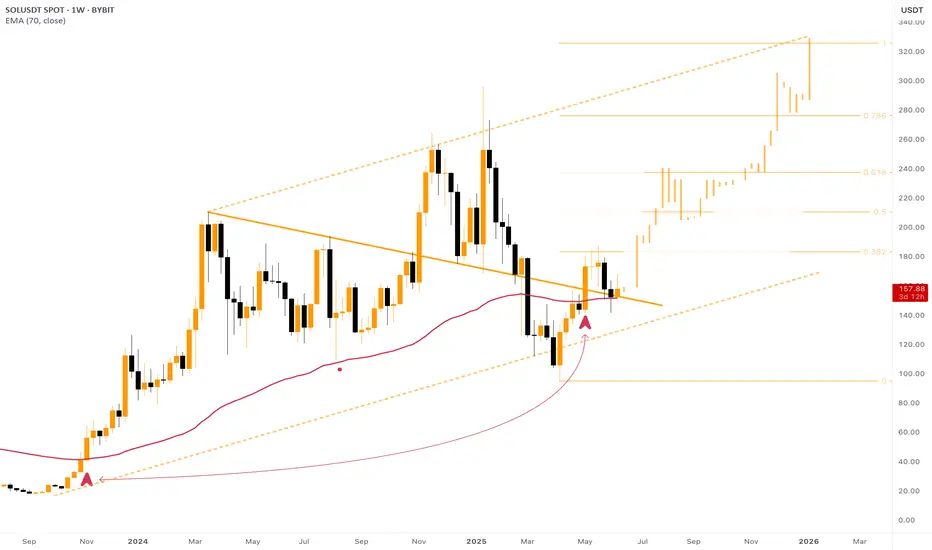
$SOL - Ready for a STRONG Comeback to $300!Throughout 2024 Solana has been moving within the Massive Ascending Channel . It does these days too.
Recently, back in March 2025, there was a fake breakdown of the channel's ascending support. It ended up with a strong pullback above the line. Moreover, the descending trend line that was initially formed in February 2024 was also broken upwards.
Signs of strong bullish volumes.
At the moment the price is consolidating above the EMA500 of 1D chart (EMA70 of 1W) , just as it did back in November 2023 before the famous x7 rally from $30 to $210.
Breakout of the 0.382 lvl by Fibo will mark the beginning of a new rally upwards. Target for this upward movement on CRYPTOCAP:SOL is $320 , must be reached in 2025.
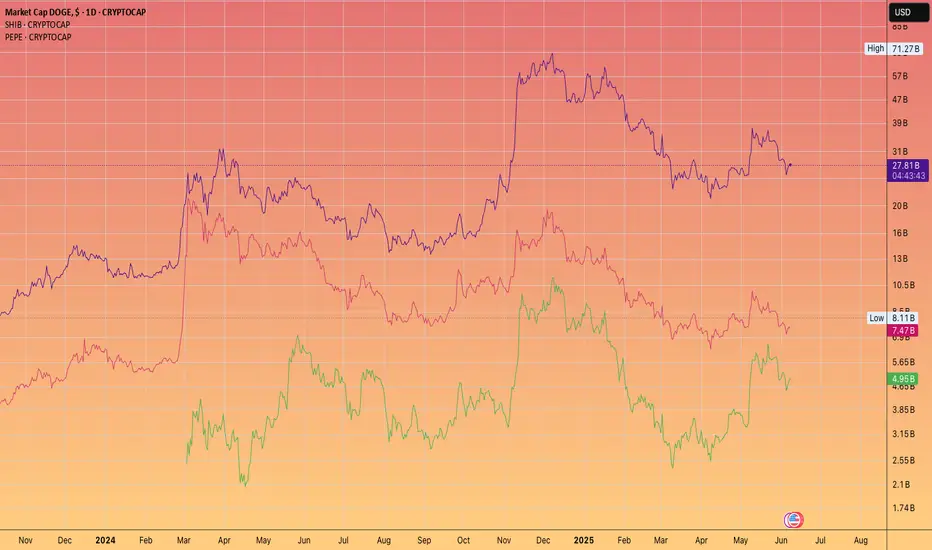
Pepe is going flip SHIB. But can it catch Dogecoin?If Ethereum were to smash $10k
Then it has a genuine chance IMHO
We shall be watching and tracking this as the cycle reaches it's mania phase!
PNUT projects to a Dollar.TWO Clear patterns
Double bottom
and a Bull Flag.
Two respective Log Projections for you to consider.
This suggest strong Solana performance is incoming and another round of #Memecoin frenzy.

DOGE can be worth many DOLLAR'SGrok, the AI supercomputer interface on Elon Musk’s X platform, predicts that Dogecoin might hit $10 between 2029 and 2040.
While I remain hopeful, I believe that a more realistic target could be around 3-5 dollars by the end of this decade. This could potentially trigger a significant blowoff top, leading to an extended bear market for cryptocurrencies.
When you examine this chart, it’s hard not to appreciate its beauty, comparable to Bitcoin, as it showcases a well-defined uptrend and follows cyclical rises and falls. This has resulted in Dogecoin creating numerous millionaires. The pressing question is whether those investors who currently hold 250,000 coins will become the next wave of millionaires in just a few years?

Memecoin: A Modest $60 Trade in Mumu on SolanaMemecoin: A Modest $60 Trade in Mumu on Solana
➖ Bitcoin is growing slowly for now, and today I noticed that altcoins and memecoins have become more active.
➖ I decided to try investing a modest $60 in the memecoin Mumu, which has the potential for a +120% move.
➖ I'm not expecting massive gains; the lows have closed higher, similar to October 2024, with a move toward 161.8% on the Fibonacci retracement. I opened a trade on Solana.
MLong

$BONK here loks good for another 1000%SEED_DONKEYDAN_MARKET_CAP:BONK here looks good for another 1000%; cluster of htf levels with declining sell volume.
A run to ATH is 500%, and beyond to the fibs is over 1000%.
Easy invalidation just below pink yearly line.

MEME: HOW THE HUMAN BRAIN WORKSSuper in-depth infographic detailing how the human brain works. Crypto People TOO! 🤣🤣🤣🤣
You can right-click the image below and select "Save As..." to download and share it with your friends.
Have FUN!
