The Christmas Silver Finally Breaks FreeFor decades, Silver has celebrated the holidays the same way 🎄
Strong rallies.
Rising excitement.
And a familiar ceiling.
🎄 Christmas 1980
Silver climbed like a Christmas tree, fast, vertical, and emotional.
The star was reached at the $50 level.
And just like that, the lights went out ✨
The market peaked and collapsed back into its long-term range.
🎄 Christmas 2010
Different era. Same story.
Once again, Silver rallied into Christmas, lit up the chart, and tested the same $50 level.
The tree was tall.
The star was bright.
But price could not hold above it.
⭐️Why the Star at $50 Always Mattered
That star was not decorative .
It was structural .
The $50 level represented:
• decades of trapped supply
• historical excess from prior cycles
• a psychological round number the market respected
Every Christmas rally stopped at the same place.
Until this one❗️
💫Christmas 2025: The Star Breaks Free
This time, Silver did not just touch the star.
It broke above it and held.
The Christmas tree is no longer capped.
The star has turned into a shooting star ☄️
That is what price discovery looks like.
When a market escapes a level it failed to conquer for decades, it stops trading inside a box and starts trading into open space.
🌌Discovery Mode: The Sky Is the Limit
With the ceiling gone, Silver enters a new phase.
The blue zone ahead is not a prediction .
It is a projection .
A natural expansion toward the next psychological magnet near 100.
Not because history says so.
But because history no longer applies the same way once a multi-decade barrier breaks.
Above the star, there is only sky.
💡The Takeaway
Silver spent decades decorating the same tree.
This Christmas, it finally stepped outside the room 🎄➡️🌌
And once a market reaches open skies,
it does not ask for permission.
It explores .
🧐So here’s the real question:
Where do you see Silver next Christmas?🎄
And where do you think it will be ten Christmases from now?
⚠️ Disclaimer: This is not financial advice. Always do your own research and manage risk properly.
📚 Stick to your trading plan regarding entries, risk, and management.
Good luck! 🍀
All Strategies Are Good; If Managed Properly!
~ Richard Nasr
Metal

Silver & the $100 MagnetFrom a long-term perspective, Silver remains clearly bullish, holding well above the blue rising trendline.
Zooming in, the short-term structure is just as clean. XAGUSD is trading inside a rising red channel, respecting both its upper and lower bounds with precision.
As long as this red channel continues to hold, my focus stays on trend-following long setups. The natural target remains the upper bound of the channel, which aligns perfectly with the $100 level, a round number that has been acting like a magnet for price.
What do you think? Does Silver tap $100 again before any deeper correction? 🤔
⚠️ Disclaimer: This is not financial advice. Always do your own research and manage risk properly.
📚 Stick to your trading plan regarding entries, risk, and management.
Good luck! 🍀
All Strategies Are Good; If Managed Properly!
~Richard Nasr

Silver Long Setup – Support Zone in Play The Silver 4H chart🪙 Silver Long Setup – Support Zone in Play
The Silver 4H chart (XAGUSD) is flashing a compelling long opportunity as price rebounds from a well-defined Support Zone. After a corrective dip, bulls are stepping in near the 74.55–73.73 region, which aligns with structural support and prior accumulation. With volume stabilizing and price reclaiming momentum, this setup offers a clean risk/reward profile for upside continuation.
🟢 Trade Setup Details
- Buy Zone: 74.5592 to 73.7359
- Max. Stop Loss: 73.7359 (conservative SL at 73.8163 also valid)
- Take Profit Targets:
- 🎯 TP1: 79.4363
- 🎯 TP2: 80.5171
- 🎯 TP3: 81.3697
The current price action around 77.98 suggests bullish intent, with a breakout above the descending trendline adding fuel to the move.
🔍 Technical Highlights
- Price has respected the Support Zone, forming a base for potential reversal.
- A descending trendline has been breached, signaling a shift in short-term sentiment.
- Volume shows accumulation behavior, supporting the bullish thesis.
- The profit zone offers a risk/reward ratio near 2:1, ideal for swing entries.
📈 Bullish Scenario
If Silver holds above the support base, we could see a steady climb toward TP1 and TP2, with TP3 as an extended target. Watch for:
- Bullish candles with strong body and volume confirmation
- Retest of broken trendline as support
- Momentum indicators crossing into bullish territory
⚠️ Risk Management
- SL placement below 73.73 protects against deeper pullbacks.
- Consider partial exits at TP1 and TP2 to secure gains.
- Avoid chasing if price runs too far—wait for pullbacks or consolidation near breakout zones.
💡 Summary: Silver is bouncing off a key Support Zone, with bullish structure forming and upside targets clearly mapped. With TP1–TP3 offering layered exits and a tight SL, this setup blends precision with potential.
📊 Whether you're trading the breakout or riding the wave toward 81+, this setup deserves your attention.

Gold - Control vs Patience… Who Wins Next?Gold hasn’t done anything crazy lately, and that’s exactly the point.
Zooming out, the structure is still bullish. Every dip so far has been met with buyers, and the market keeps printing higher highs and higher lows.
Right now, price is sitting inside what I like to call a decision zone. This is where the market usually pauses, shakes out impatient traders, and shows its real intention.
As long as we’re holding above this green zone, bulls are still in control. This looks more like a pause or reload than a reversal.
That said, if price loses this area and starts accepting below it, then the story changes... and a deeper correction would be on the table.
What do you think? Will Gold reload and continue higher, or is this where control shifts? 🤔
⚠️ Disclaimer: This is not financial advice. Always do your own research and manage risk properly.
📚 Stick to your trading plan regarding entries, risk, and management.
Good luck! 🍀
All Strategies Are Good; If Managed Properly!
~Richard Nasr

COPPER - The Metal No One Is Talking About… YetCopper just did something important, it broke above its previous all-time high. That alone puts it back on the radar from a macro perspective.
Structurally, the trend is clearly bullish. Price is respecting the rising trendline, and what we are seeing now is a normal post-breakout reaction, not weakness.
The plan from here is simple: 👇
i will be watching the intersection of the rising trendline and the prior structure zone. That confluence is where risk becomes defined and where trend-following longs make the most sense.
As long as price holds above structure and respects the trendline, the bullish thesis remains intact.
📊 Always follow your trading plan regarding entry, risk management, and trade management.
Good luck! 🍀
All Strategies Are Good; If Managed Properly!
~Richard Nasr

Gold - Breakout, Retest, Reload?Gold continues to respect a clean bullish structure 📈 on the 4H timeframe. After breaking above the previous all-time high, price has shifted that level into demand, confirming strength rather than exhaustion.
⚔️The rising blue trendline remains intact , and every pullback so far has been met with aggressive dip-buying, reinforcing the trend-following environment.
As long as price holds above the highlighted demand zone, the bias remains firmly bullish.
From here, the plan is simple and disciplined:
🏹I’ll be looking for longs on pullbacks into demand, in alignment with the trend, rather than chasing price higher. A clean reaction from this zone keeps the path open for continuation toward new highs.
⚠️ Disclaimer: This is not financial advice. Always do your own research and manage risk properly.
📚 Stick to your trading plan regarding entries, risk, and management.
Good luck! 🍀
All Strategies Are Good; If Managed Properly!
~Richard Nasr

Silver - Strength Speaks Loudest!!🏆Silver has been one of the strongest performers across almost the entire market, consistently outperforming most assets and leading the momentum higher.
📈Structurally, price remains firmly bullish , respecting the rising blue channel with clean impulsive moves followed by shallow corrections. This behavior is exactly what strong trends look like.
🏹As long as this rising blue channel holds , the plan remains straightforward:
I’ll be looking for trend-following longs on every correction, not chasing highs, but waiting patiently for pullbacks into structure.
Only a clear and decisive break below the channel would invalidate this bullish thesis. Until then, Silver remains a buy-the-dip market, favoring continuation rather than reversal.
⚠️ Disclaimer: This is not financial advice. Always do your own research and manage risk properly.
📚 Stick to your trading plan regarding entries, risk, and management.
Good luck! 🍀
All Strategies Are Good; If Managed Properly!
~Richard Nasr

Gold - Pullback or Reload Before the Next Push?📈 Gold remains overall bullish , trading within a well-defined ascending structure.
Price is now approaching a high-confluence area, where the demand zone aligns perfectly with the lower red trendline. This intersection is critical, as it represents a classic trend-following buy zone within a healthy uptrend.
⚔️As long as this zone holds, we will be looking for bullish reactions and continuation setups, aiming for a move back toward the upper side of the channel and the previous highs.
A clean rejection from this level would confirm buyers are still in control.
A decisive breakdown below it would invalidate this bullish scenario.
Is Gold setting up for another trend continuation, or will it surprise the crowd? 🤔👇
⚠️ Disclaimer: This is not financial advice. Always do your own research and manage risk properly.
📚 Stick to your trading plan regarding entries, risk, and management.
Good luck! 🍀
All Strategies Are Good; If Managed Properly!
~Richard Nasr

Copper price predictions from Wall Street Citi forecasts copper reaching USD 13,000 per tonne in early 2026, with a potential move to USD 15,000 by the second quarter, driven by energy transition and AI related demand.
ING also expects higher prices, with its outlook targeting USD 12,000 per tonne in the second quarter of next year.
Deutsche Bank points to supply constraints as a key driver, describing 2025 as a highly disrupted year for mining. The bank sees the market in clear deficit, with the tightest conditions in late 2025 and early 2026, and peak prices in the first half of 2026.
J.P. Morgan thinks demand from China will eventually come into play, too, noting signs of growing pressure on smelters to secure raw material. The bank expects prices to reach USD 12,500 per tonne in the second quarter of 2026, averaging around USD 12,075 for the year.

Silver Extends Gains as Wave Structure Points HigherSilver broke higher last week sharply and decisively, while gold has not followed to the upside as strongly. However, with the gold–silver ratio falling, silver remains the stronger performer at this stage. Because of this relative strength, the move could be wave (3) of an ongoing five-wave bullish impulse, especially given the strong extension higher and the fact that gold is also approaching an all-time high.
Silver may continue to grind higher, and there appears to be room toward the 261.8% Fibonacci extension and the 68–70 zone to complete a lower-degree impulse within wave (3). Currently it can be trading in subwave 3 with room for more gains, just be aware of subwave 4 pullback before a bullish resumption within subwave 5 of (3).

Gold - Bullish Structure Still Intact… Eyes on the Next Higher!!📈Gold remains overall bullish, consistently forming higher lows along its rising trendline. Every time price tapped the lower boundary of the structure, buyers stepped in aggressively, and we may be approaching that point again.
⚔️Price is currently hovering near a blue support zone, which aligns perfectly with the rising trendline. As long as this confluence holds, we will be looking for trend-following longs, targeting the upper resistance zone highlighted in beige.
🏹If buyers defend this area once again, Gold could be preparing its next impulsive leg upward.
Do you expect Gold to print another higher low here? Share your thoughts below 👇
⚠️ Disclaimer: This is not financial advice. Always do your own research and manage risk properly.
📚 Stick to your trading plan regarding entries, risk, and management.
Good luck! 🍀
All Strategies Are Good; If Managed Properly!
~Richard Nasr

SILVER - The ATH Retest Opportunity!!!🚀Silver has officially broken above its all-time high - a major milestone for the metal. But nothing moves in a straight line, and healthy trends always correct before continuing higher.
📉Price is now on its way to retest the previous ATH zone in red, which aligns perfectly with the rising trendline. This creates a powerful confluence area where buyers have historically stepped back in with strength.
⚔️As Silver taps into this intersection, we will be looking for trend-following longs, expecting the bulls to defend the zone and push toward new highs.
🏹The structure is bullish. The trendline is intact. The level is clean.
Now we wait for the reaction… will the bulls reload here? 🤔
⚠️ Disclaimer: This is not financial advice. Always do your own research and manage risk properly.
📚 Stick to your trading plan regarding entries, risk, and management.
Good luck! 🍀
All Strategies Are Good; If Managed Properly!
~Richard Nasr

XAUUSD - The Golden Retest Zone!📈Gold remains overall bullish , respecting its rising structure and printing higher lows along the way. Each corrective dip has been met with strong buying pressure, keeping the broader trend intact.
📉As price pulls back, it is now approaching a key blue structure zone that aligns perfectly with the lower blue trendline. This intersection forms a high-confluence area where we will be looking for trend-following longs.
⚔️As long as Gold holds this zone, the bullish scenario remains dominant, with the next potential push targeting the previous ATH highlighted on the chart.
🏹A clean reaction here could be the catalyst for the next leg of the uptrend.
Will the bulls defend the golden zone again? 🤔
⚠️ Disclaimer: This is not financial advice. Always do your own research and manage risk properly.
📚 Stick to your trading plan regarding entries, risk, and management.
Good luck! 🍀
All Strategies Are Good; If Managed Properly!
~Richard Nasr

Gold Reload Zone… Bulls Waiting Patiently!📈Gold remains overall bullish, respecting both its rising structure and the major support zones beneath current price. After breaking above the light-blue resistance area, XAUUSD is now pushing higher, but a pullback remains very likely before the next impulse.
⚔️On the upcoming retest of the blue structure zone and the rising trendline, we will be looking for trend-following longs. This area has acted as support multiple times and now aligns with the bullish context, making it a high-probability buy zone.
🏹As long as Gold remains above the red demand area and respects the rising structure, the next wave upward toward the 4,385 resistance remains the most likely scenario. Only a clean break below the red zone would weaken the bullish outlook.
For now, patience is key… wait for the retest, then look for longs from structure. 🤔
⚠️ Disclaimer: This is not financial advice. Always do your own research and manage risk properly.
📚 Stick to your trading plan regarding entries, risk, and management.
Good luck! 🍀
All Strategies Are Good; If Managed Properly!
~Richard Nasr

XAUUSD - Bulls Still Stepping In at Demand… Watching the Retest!Gold remains overall bullish, holding firmly above the major support zone around $4,000–$4,050. This entire red area has been acting as a strong demand zone for weeks, with price bouncing from it multiple times, a clear sign that buyers are defending this level aggressively.
📈XAUUSD is also respecting the rising trendline , forming a clean higher-low structure. As long as Gold remains above both the trendline and the support zone, the bullish outlook stays intact. I will be looking for long setups on the next retest of this confluence area.
🏹If buyers step in again, the next move could push toward the previous highs near $4,385. But if price breaks below the support zone and the trendline, the bullish structure would weaken and open the door for a deeper correction.
For now, this zone is the key. Will Gold bounce again… or finally break through support? 🤔
⚠️ Disclaimer: This is not financial advice. Always do your own research and manage risk properly.
📚 Stick to your trading plan regarding entries, risk, and management.
Good luck! 🍀
All Strategies Are Good; If Managed Properly!
~Richard Nasr

LONG ON GOLD XAU/USDGold has swept sell side liquidity and has given us a choc (change or character) to the upside.
There is tons of buyside liquidity to the upside with huge FVG's (Fair value gaps) and equal highs (double top) that need to be mitigated.
I am buying gold looking to catch over 200-300 points.
That's 2000-3000 pips.

Palladium - The Calm Before the Next Surge!🏹Palladium has been on a strong bullish run , riding within a clean rising channel. After a sharp impulse, price is now cooling off — and this pullback might just be the calm before the next surge.
⚔️The metal is approaching a major intersection zone where the rising trendline meets a strong demand and structure area, a confluence that has previously sparked powerful rallies. As long as this intersection holds, I’ll be watching for bullish confirmations to join the trend.
A healthy correction into this zone could set the stage for the next impulsive wave, with potential upside targets around $1,550 and even $1,700 if momentum kicks in.
In short, Palladium remains overall bullish, and this upcoming retest could be the perfect reload zone before the next big move north.
📊All Strategies Are Good; If Managed Properly!
~Richard Nasr

COPPER - Following Gold?Hello TradingView Family / Fellow Traders. This is Richard, also known as theSignalyst.
📈 COPPER has been overall bullish, trading inside the rising wedge pattern in blue.
At present, COPPER is undergoing a correction phase and it is hovering around the lower bound of the wedge.
Moreover, it is retesting a massive support zone marked in green.
🏹 Thus, the highlighted blue circle is a strong area to look for buy setups as it is the intersection of the green support and lower blue trendline acting as a non-horizontal support.
📚 As per my trading style:
As #COPPER approaches the blue circle zone, I will be looking for bullish reversal setups (like a double bottom pattern, trendline break , and so on...)
📚 Always follow your trading plan regarding entry, risk management, and trade management.
Good luck!
All Strategies Are Good; If Managed Properly!
~Rich

Gold’s Golden Retest?Gold continues to trade within a rising blue channel, maintaining its overall bullish structure.
Currently, price is retesting the intersection between the lower blue trendline and the red structure zone, which has acted as strong support multiple times.
As long as this confluence area holds, I’ll be looking for trend-following longs targeting the upper boundary of the channel.
A break and close below this zone would temporarily pause the bullish momentum and open room for a deeper correction.
⚠️ Disclaimer: This is not financial advice. Always do your own research and manage risk properly.
📚 Stick to your trading plan regarding entries, risk, and management.
Good luck! 🍀
All Strategies Are Good; If Managed Properly!
~Richard Nasr

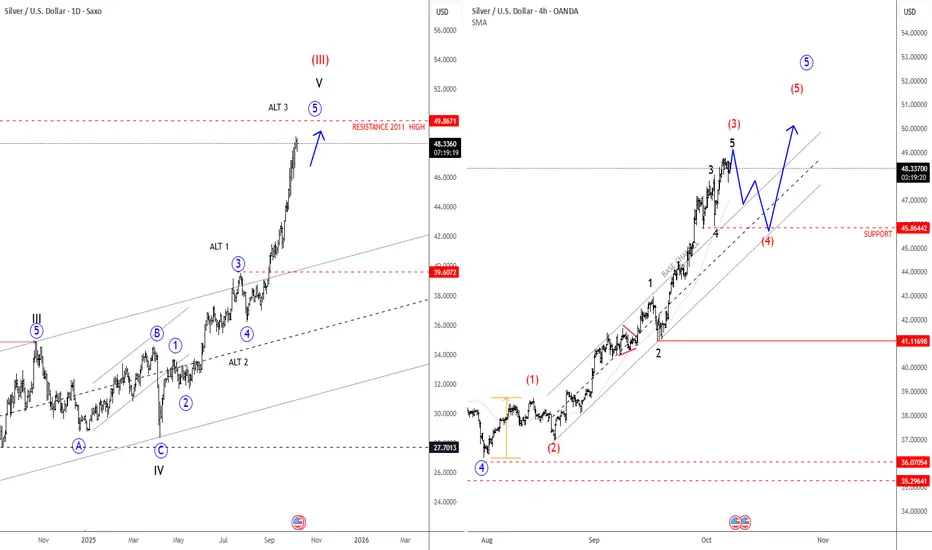
Silver Is Extending Impulsively Higher; All-Time Highs SoonSilver Is Extending Impulsively Higher, which can push the price into all-time highs from a technical point of view and by Elliott wave model.
Silver is on the rise and has been outperforming gold quite a lot over the last week, and it looks like an extended leg up is still in progress; seems like wave three of an extended impulse, therefore more gains are possible after next three-leg retracement. Based on the 4-hour chart, there is a chance that price goes towards 50usd, but there can be some new pullback first. Ideally red wave (4) could stabilize near 45.86. Only a sharp impulse down closer to 43 level will be an indication that higher degree wave four has started.
Higher Time frame charts show an ongoing bull cycle that is now targeting the high from April 2011, which could be the next major level and a potential area for a new retracement, maybe sometime in 2026.
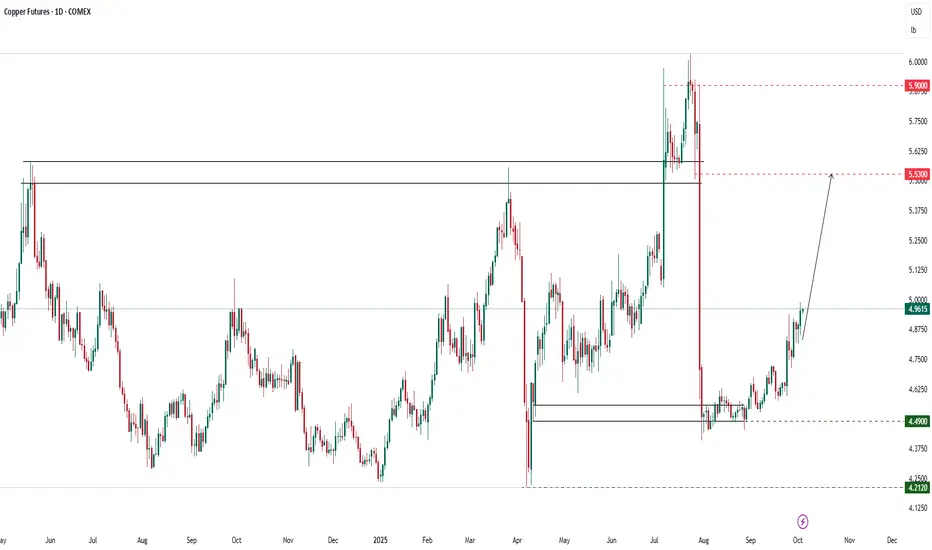
Analysis techniques – Copper Futures (Dec 2025)Analysis techniques – Copper Futures (Dec 2025)
Date: 03/10/2025 | Timeframe: D1 | Contract Code: HGZ25
1. Trend Overview and Price Structure
December copper rose slightly to 4.9610 USD/lb (+0.14%), sustaining its strong rebound from 4.49 support after a prolonged consolidation in August–September. The price has broken above short-term resistance and is approaching the psychological 5.00 mark. Medium-term structure remains bullish, targeting the key resistance zone of 5.53 – 5.90, a previous cycle high.
2. Key Technical Levels
Resistance: 5.53 – 5.90 – 6.00
Support: 4.90 – 4.49 – 4.21
3. Detailed Technical Analysis
Short-term trend: Breakout from the 4.49 – 4.70 base favors further upside toward 5.53.
Volume: Rising on the breakout, signaling fresh inflows.
Wave structure: Copper appears in a medium-term recovery wave (wave 3), with theoretical targets around 5.53 – 5.90 before a pullback.
Confirmation signals: Sustained closes above 5.00 would confirm momentum; failure below 4.90 risks a retracement to 4.70 – 4.49.
4. VNC View
Short term: Positive outlook as metals attract flows amid a softer USD.
Medium term: Refined copper supply disruptions in South America and persistent green demand (EVs, renewables) underpin prices.
Risks: Potential demand weakness from China could trigger volatility.
5. Suggested Technical Strategies
Preferred Long Setup:
Entry: 4.95 – 5.00
TP: 5.53 – 5.90
SL: 4.90
Probability: 65%
Counter-trend Short Setup:
Entry: 5.50 – 5.53
TP: 5.20 – 4.95
SL: 5.90
Probability: 40%
6. Corporate Hedging Guidance
Copper importers (Asia, Vietnam): Lock in purchases near 4.90 – 5.00 to mitigate upside risk.
Producers/sellers: Delay sales until prices approach 5.53 – 5.90 resistance for better margins.
GOLD => $4000 The MagnetGold has been pushing higher within its bullish log-chart structure, moving inside two rising channels (red short-term and blue long-term).
The interesting part? The $4000 level is acting like a magnet, and it happens to intersect with the upper bound of both channels. This rare confluence makes $4000 a key level to watch.
As long as the bullish momentum holds, Gold remains on track toward this magnet level. But once there, the reaction will be critical, a clean breakout could open the door for fresh highs, while a rejection may trigger a correction before continuation.
⚠️ Disclaimer: This is not financial advice. Always do your own research and manage risk properly.
📚 Stick to your trading plan regarding entries, risk, and management.
Good luck! 🍀
All Strategies Are Good; If Managed Properly!
~Richard Nasr

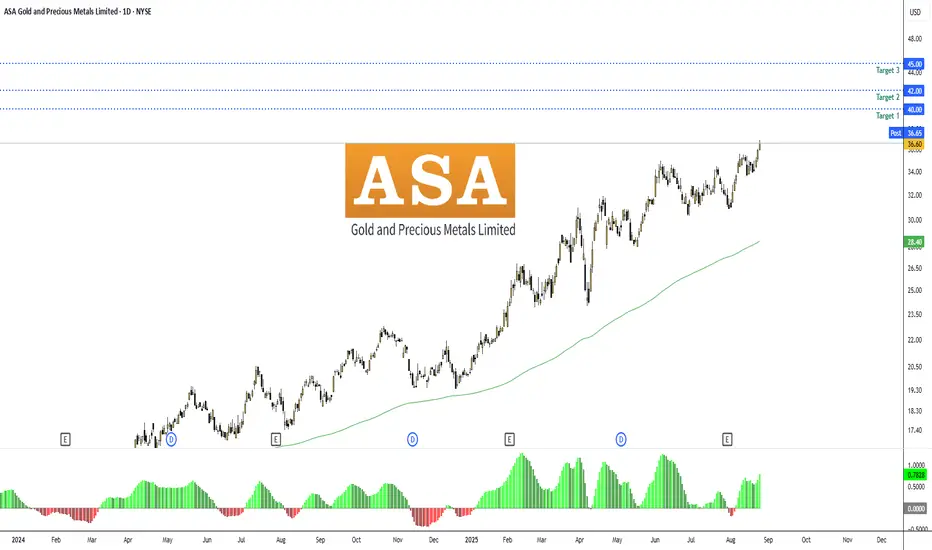
Insider: ASA Gold and Precious Metals LimitedNYSE:ASA #ASA — ASA Gold and Precious Metals Ltd | Financial | Closed-End Fund - Equity | USA | NYSE | August 25, 2025.
Insider Purchase and Company Overview
Recent insider filings for ASA Gold and Precious Metals Limited (NYSE: ASA), a closed-end investment fund focused on companies engaged in the exploration, mining, or processing of gold and other precious metals, reveal aggressive accumulation by major shareholder Saba Capital Management, L.P. As a 10% owner, Saba executed two notable purchases in late August 2025: on August 21, 2025, acquiring 6,710 shares at $35.05 per share for a total value of $231,380, and on August 22, 2025, adding 4,632 shares at $35.97 per share for $166,181.
These transactions, disclosed via SEC Form 4 on August 25, 2025, boosted Saba's total holdings to 4,077,634 shares, representing a significant stake in the fund. This activity is part of a broader pattern of buying by Saba throughout August 2025, including larger acquisitions such as 9,943 shares on August 19 at $33.99, 18,310 shares on August 15 at $34.24, 8,310 shares on August 14 at $33.89, 1,836 shares on August 13 at $35.11, 354,169 shares on August 12 at $35.39, and a substantial buy on August 11 valued at approximately $11.4 million at $35.00 per share.
Saba Capital, led by activist investor Boaz Weinstein, has been increasing its position amid an ongoing proxy battle and governance disputes with ASA's board, signaling strong conviction in the fund's undervaluation relative to its net asset value (NAV) and the bullish outlook for precious metals. No other significant insider purchases from executives or directors were reported in August 2025, but institutional interest is evident, with Sprott Inc. maintaining a $8.45 million stake as of recent filings.
➖ www.nasdaq.com
➖ www.marketbeat.com
News Analysis
August 2025 news for ASA has been dominated by governance changes and activist developments. On August 22, 2025, the company announced the resignation of directors William Donovan and Mary Joan Hoene, alongside the appointment of Karen Caldwell to the board—a move that may reflect ongoing pressure from Saba Capital to refresh leadership and address the fund's persistent discount to NAV (historically trading at 10-20% below its underlying assets).
Earlier in the month, ASA filed an 8-K on August 7, 2025, likely related to operational updates, and released its August Gold Chart Book on August 1, highlighting positive trends in gold mining equities amid rising metal prices. Saba's activism, which includes a dropped lawsuit in July 2025 over expired anti-takeover measures (poison pills) and ongoing proxy proposals to expand the board, underscores their push for value unlocking, such as potential conversions or mergers.
No other major insiders or traders reported buys in August, but Saba's consistent accumulation (totaling over $20 million in value across the month) positions them as the dominant force, with holdings now exceeding 4 million shares. This activist involvement could catalyze premium narrowing or strategic actions, boosting shareholder value.
Charts:
• (1D)
• (3D)
SEC From 4:
www.sec.gov
Forecast:
Replicating Saba's recent buys at an average entry of ~$35.50 (blending the August 21-22 transactions), the setup offers solid upside potential in a precious metals bull market, supported by technical strength and activist catalysts. I estimate a 15-30% growth potential over the next 3-6 months, assuming gold prices remain elevated above $3,364/oz and Saba's activism yields positive outcomes like board expansions or discount-narrowing measures.
Entry Price: $35.50. (current/insider level).
Recommended Exit Targets:
➖ Conservative Target 1: $40.00 (13% profit, +$4.50/share)
➖ Moderate Target 2: $42.00 (18% profit, +$6.50/share)
➖ Aggressive Target 3: $45.00 (27% profit, +$9.50/share)
Stop-Loss: $32.00 (10% downside risk, -$3.50/share) – Below 20-day SMA to guard against pullbacks.
Overall Potential: 15-30% growth, with a risk-reward ratio of ~1:2 at the moderate target.
Risks include gold price volatility, failed activism (e.g., prolonged proxy fights), or broader market corrections in commodities. Position sizing should be 1-3% of portfolio given the fund's sensitivity to metal prices.