Meta - Preparing a major buying opportunity!🤩Meta ( NASDAQ:META ) is clearly heading higher:
🔎Analysis summary:
Just recently Meta once again retested the major resistance trendline. This retest was followed by a decent correction of about -25%, perfectly playing out. Now, Meta is retesting major support and is already setting up for another potential buying opportunity.
📝Levels to watch:
$650 and $500
SwingTraderPhil
SwingTrading.Simplified. | Investing.Simplified. | #LONGTERMVISION
Metaplatform

META: Impulsive Recovery Signals Momentum ShiftMETA has staged a strong recovery from its recent lows, with price action showing a clear impulsive push higher and improving momentum. The structure suggests buyers have regained control after a period of weakness, transitioning the market into a more constructive phase. Rather than a random bounce, the move reflects renewed participation, with price now working through the next stage of its broader developing structure.
Disclosure: We are part of Trade Nation's Influencer program and receive a monthly fee for using their TradingView charts in our analysis.

META Momentum Builds! Bullish Swing Trade Roadmap🚀 META: The Layered Entry Swing Play - AI Momentum Revival 📈
Executive Summary 💼
META Platforms sits at a pivotal technical juncture where institutional AI capex demand collides with short-term profit-taking. This swing trade targets the $720 resistance breach using a disciplined layered entry methodology — perfect for risk-managed traders seeking 3-5% upside with controlled downside.
📊 Trade Setup | Master Plan
Asset: 🔵 META (NASDAQ) | Meta Platforms, Inc.
Timeframe: Swing Trade (4-6 weeks)
Bias: 🟢 BULLISH (Support Zone Recovery)
Risk Appetite: Moderate to Aggressive
🎯 Entry Strategy | The Intelligent Layering System
Rather than chasing a single entry price, we employ a pyramiding buy-in method across key support zones. This reduces emotional trading and improves risk-reward at scale.
Multi-Layer Entry Points (Buy in Tranches):
Layer 1 (Initial Position): $638.50 — 2% account risk
Layer 2 (Dip Catch): $630.00 — 2% account risk
Layer 3 (Strength Reload): $650.00 — 2% account risk
Layer 4 (Breakout Confirmation): $660.00 — 1.5% account risk
Total Allocation: ~7.5% per full setup (adjust per your risk tolerance)
Rationale: Layering avoids the emotional cost of "missing" an entry and distributes your execution cost—professional traders call this dollar-cost averaging on entries.
🛑 Stop Loss | Discipline Wins Wars
Hard Stop: $610.00
Reasoning: Below this level, the daily chart's support at the 200-EMA fails. Loss = ~4-5% from average entry ($645), which is reasonable swing risk.
⚠️ DISCLAIMER: This stop-loss level is MY analysis only. You remain fully responsible for your risk. Consider your account size, leverage, and emotional tolerance before committing capital. Never risk more than 2% per trade.
🎪 Target Strategy | Know When to Take Profits
Primary Target (Resistance Police Force): 📍 $720.00
Why $720 Matters:
328-Period SMA (4-hour chart) typically acts as resistance during consolidated ranges
Overbought Territory Signal: RSI creeping above 70 = profit-taking zone
Technical Trap Warning: Large sellers often cluster here after gaps up
Psychological Level: Round numbers ($720) trigger algorithmic selling
Escape Plan: When price approaches $720, take 50% off the table to lock profits. Let remaining 50% run with a trailing stop at +3% below entry.
⚠️ DISCLAIMER: This target is NOT guaranteed. META could face: regulatory headwinds, macro rate shock, or competitor moves. You decide your exit—never marry a target. Protect your capital first.
📡 Related Pairs to Monitor (Correlation Watch) 🔗
1️⃣ NASDAQ:GOOG (Google / Alphabet Inc.) — POSITIVE CORRELATION (+0.82)
Key Insight: Both compete in AI advertising and data-center infrastructure. If GOOG rallies, META usually follows.
Watch: GOOG breaks above $200 = risk-on sentiment for META.
2️⃣ NASDAQ:TSLA (Tesla, Inc.) — MODERATE POSITIVE CORRELATION (+0.71)
Key Insight: Both are "mega-cap AI/Tech bets." TSLA weakness can drag META down (flight to safety).
Watch: TSLA support breaks = potential META correction into your layers.
3️⃣ NASDAQ:AMZN (Amazon.com) — POSITIVE CORRELATION (+0.76)
Key Insight: AWS AI infrastructure play; if AMZN capex concerns flare, META suffers (shared narrative).
Watch: AMZN guidance = signal for META's data-center spend outlook.
4️⃣ AMEX:SPY (S&P 500 ETF) — MODERATE CORRELATION (+0.68)
Key Insight: Macro beta. Fed rate decisions move SPY; SPY moves all mega-caps.
Watch: CPI data Dec 18, 2025 at 8:30 AM ET = critical catalyst.
5️⃣ TVC:VIX (Volatility Index) — NEGATIVE CORRELATION (-0.55)
Key Insight: Rising VIX = fear. META can gap down on broad market panic.
Watch: VIX above 20 = consider tightening your stop or waiting for another layer signal.
💡 Key Technical Confluences
✅ Why This Setup Works:
Layered entries = you're never "too early" or paying too much
52-week range sits between $480–$796 (META has room to $720) 📈
Analyst consensus = "Strong Buy" with targets ~$832 median
AI capex narrative = earnings growth driver into Q1 2026
Dividend pay date Dec 23 = pre-holiday consolidation likely
❌ Risks to Abort:
Breaking below $610 = trade is invalid; exit immediately
Regulatory shock (FTC enforcement) = gap down risk
Macro CPI shock Dec 18 = volatility surge, potential liquidation
Competitive loss to GOOG/AMZN AI = narrative reversal
📈 Risk Management Checklist
Before you trade this setup:
Do you understand layering reduces timing risk? ✅
Is your stop at $610 within your risk tolerance? ✅
Have you calculated max loss? (e.g., 7.5% × 2% per layer = ~$150 per $1000 risked) ✅
Is $720 target realistic in 4-6 weeks? (YES—analyst upside + technical confluence) ✅
Will you stick to your exit plan, or will greed override? ⚠️ (This is the real test!)
🎬 Action Plan | Execution Timeline
Week 1 (Dec 18–22): Place Layer 1 & 2 buy orders. Watch CPI data (Dec 18, 8:30 AM ET).
Week 2–3: Scale into Layers 3 & 4 on any dips. Monitor GOOG/AMZN correlation.
Week 4–6: Approach $720; take 50% profit at resistance. Manage trailing stop on remainder.
Exit Plan: TP hit = reduce risk. SL hit = accept loss, move on. No "hope trading."
📝 Disclaimer & Fun Caveat
🎭 This is a "playful but serious" swing-trade idea. It's designed for entertainment AND education—think of it as how a mischievous but disciplined trader (our "thief trader OG") approaches META with style, humor, and risk management.
✨ Closing Thought
If you find value in this analysis, a 👍 and 🚀 boost is much appreciated — it helps me share more setups with the community!
#META #SwingTrade #TechStocks #AITheme #LayeredEntry #TradingView #StockMarket #NASDAQ #Bullish #MoneyManagement
#RiskManagement #ProfitTaking #TechnicalAnalysis #StockAnalysis #TradeSetup #LongBias #2025Trading

META Pullback or Power Move? Technical Structure Decides🎯 META PLATFORMS INC. (NASDAQ) | THE THIEF'S PROFIT PLAYBOOK 💰
Bullish Swing Trade Setup | Supertrend + Triangular Moving Average Pullback
📊 SETUP OVERVIEW
This analysis presents a disciplined swing trading strategy on META (NASDAQ: Meta Platforms Inc.) leveraging proven technical indicators combined with strategic entry layering methodology.
Current Market Context: 🔍
Current Price: ~$625.24 (as of Nov 9, 2025)
RSI Status: Oversold Territory (<30) ⚠️
52-Week High: $796.25 | 52-Week Low: $479.80
Analyst Target: $824.02 (+32.54% potential upside) 📈
Sentiment: 44 Analysts = "Strong Buy" Rating ✅
🎬 ENTRY STRATEGY: THE LAYERING APPROACH
Rather than risking a single entry, this "Thief" methodology utilizes multiple limit order layers for optimal risk-adjusted position building:
Primary Entry Layers (Building Position Gradually):
Layer 1️⃣: $590 | Entry volume allocation: 25%
Layer 2️⃣: $600 | Entry volume allocation: 25%
Layer 3️⃣: $620 | Entry volume allocation: 25%
Layer 4️⃣: $630 | Entry volume allocation: 15%
Layer 5️⃣: $640 | Entry volume allocation: 10%
💡 Strategy Rationale: Layering captures value through market dips while maintaining capital preservation. Adjust layer counts/prices based on your risk tolerance and account size.
🛑 RISK MANAGEMENT
Stop Loss Level: $560 🛑
Represents approximately -10.4% from current price
Protects against breakdown of support structure
Triggered if key technical support fails
⚡ IMPORTANT DISCLAIMER: Stop loss placement is a personal decision based on your risk appetite. The 560 level is suggested only—manage YOUR risk YOUR way.
🎁 PROFIT TARGET
Primary Target: $730 🚀
Represents +16.8% upside potential from current levels
Aligns with resistance confluence + technical overbought signals
Incorporates trap avoidance in highly contested resistance zones
🎯 Exit Strategy Note: Take profits strategically as price approaches target. Don't get greedy—serious resistance + market structure at these levels. The $730 zone is crowded; exit positions intelligently.
⚡ DISCLAIMER: Target selection is your own. Book profits when comfortable—risk management requires personal decision-making, not blind following.
🔗 RELATED PAIRS TO WATCH (TECH SECTOR CORRELATION)
Monitor these correlated assets for confirmation signals:
📱 NASDAQ:GOOGL (Alphabet Inc.) - Tech sector bellwether; typically leads META moves in AI narrative
Correlation: Strong positive | If GOOGL struggles, META upside may be capped
Watch: Positive correlation breakouts suggest sector momentum
💻 NASDAQ:NVDA (NVIDIA Corp.) - AI chip leader; META's infrastructure partner
Correlation: Strong positive | NVDA strength = confidence in AI capex spending
Watch: NVDA drops could signal META weakness despite fundamentals
🤖 NASDAQ:MSFT (Microsoft Corp.) - Competing AI ecosystem player
Correlation: Moderate positive | Sector rotation indicator
Watch: MSFT outperformance = potential META underperformance
📊 NASDAQ:QQQ (Nasdaq-100 ETF) - Tech sector aggregate
Correlation: Very strong | META weighted ~4.7% in QQQ
Watch: If QQQ breaks down, META faces headwinds regardless of company-specific factors
🌐 NASDAQ:SMH (Semiconductors ETF) - Supply chain health indicator
Correlation: Moderate positive | AI infrastructure demand gauge
Watch: SMH weakness signals potential capex disappointment
📈 TECHNICAL ANALYSIS FRAMEWORK
✅ Supertrend Confirmation: Bullish alignment detected—uptrend structure intact
✅ Triangular Moving Average (TMA) Pullback: Price respecting key moving average zones, setting up continuation
✅ Oversold RSI: Current market conditions suggest reversal potential
✅ Support Structure: $560 level acts as psychological + technical floor
🎓 WHY THIS SETUP WORKS
Entry Discipline: Layering reduces emotional decision-making; mechanical execution improves psychology
Risk Control: Multiple entries allow tighter overall stop losses while maintaining position exposure
Technical Confirmation: Supertrend + TMA alignment = higher probability setups
Sector Tailwinds: META's $600B AI investment announcement provides fundamental support
Oversold Bounce Potential: RSI <30 historically precedes relief rallies in strong companies
⚠️ RISK FACTORS & CONSIDERATIONS
🔴 Key Risks:
Meta's aggressive capex spending concerns some investors—watch for guidance revisions
Regulatory pressure on AI/advertising practices could derail momentum
Macro headwinds (interest rates, economic data) always threaten growth narratives
Market structure at $730 is HEAVY—resistance may be tougher than expected
Position sizing matters: don't over-leverage this trade
💼 Trade Management Checkpoints:
Scale in via layering rather than going all-in
Monitor daily closes near stop loss; don't let winners turn into losers
Consider taking partial profits as price approaches resistance zones
Watch related pairs ( NASDAQ:QQQ , NASDAQ:NVDA ) for confirmation/divergence
💡 PRO TIPS FOR THIEF TRADERS
🔓 Lock in Partial Gains: At $670 level, consider closing 40% of position to secure profits
🔓 Trail Your Stop: Once price establishes above $650, move stop to breakeven to protect capital
🔓 Watch Earnings Calendar: Next catalyst could accelerate move—prepare position accordingly
🔓 Timeframe Matters: This is swing trade—target 2-4 week holding period
🔓 Keep Thesis Tight: Market conditions change—be prepared to exit if setup breaks
📌 FINAL NOTES
This analysis is provided for educational & entertainment purposes only. ✨
Every trader must make independent decisions regarding position sizing, entry levels, exit targets, and risk management. What works for one trader's account may not work for another. Test strategies on smaller positions first; respect your stops; manage your risk.
Remember: The best trade isn't always the one that makes the most money—it's the one that lets you live to trade another day.
📢 SUPPORT THE ANALYSIS
✨ If you find value in this analysis, a 👍 and 🚀 boost is much appreciated — it helps me share more setups with the community!

Meta - The major triangle rejection!💡Meta ( NASDAQ:META ) will reverse soon:
🔎Analysis summary:
Just a couple of months ago we witnessed a textbook all time high break and retest on Meta. This retest was followed by a major rejection higher and the second retest of the triangle resistance trendline. Therefore, Meta is very likely to create another rejection.
📝Levels to watch:
$750 and $500
SwingTraderPhil
SwingTrading.Simplified. | Investing.Simplified. | #LONGTERMVISION

Meta Platforms (META) shares plunge 11%Meta Platforms (META) shares plunge 11%
On Wednesday, Meta Platforms (META) released its quarterly report, which included several positive highlights:
→ revenue rose to $51.2 billion (forecast: $49.5 billion);
→ the size of the daily active audience increased to 3.54 billion people.
However, META’s share price fell below the psychological threshold of $700, hitting its lowest level in almost five months. This drop was triggered by two unpleasant surprises revealed in the report.
Tax write-offs
According to media reports, due to new US tax legislation (referred to as the “One Big Beautiful Bill Act”), the company recorded a one-off income tax expense of $15.93 billion.
Because of this write-off, earnings per share (EPS) came in at $1.05 (analysts had expected $6.72). However, the company clarified that excluding this one-off item, EPS would have been $7.25, which would have been a very strong result.
AI-related expenses
Another factor that may have alarmed shareholders is that Mark Zuckerberg’s company raised its capital expenditure forecast for 2025 to $70–72 billion. These funds will go towards building data centres and purchasing AI chips.
In essence, Meta Platforms is striving to take a leading position in the AI space and is prepared to spend tens of billions to achieve that goal. For shareholders, this means that even as revenue grows, net profit is being eroded by massive spending—and it remains unclear when these costs will pay off.
Technical analysis of META’s chart
When analysing META’s chart in mid-August, we:
→ drew an ascending channel (shown in blue);
→ pointed out signs of weakness (including a bearish gap¹, shown in orange);
→ suggested that the balance could shift in favour of the bears, which might trigger a noticeable correction in META’s share price.
This scenario played out as a decline from A → B. After rebounding from the key line of the blue channel, the price rose towards the bearish gap¹, forming a lower high C. The downward movement then continued, and the channel was extended with a lower low D.
The large bearish gap² that formed this week could also act as resistance (as in the previous case), and this effect is likely to be more pronounced near the $700 psychological level.
Overall, the picture looks extremely negative:
→ the sequence of lower highs and lows A → D is likely to continue with a new lower low F;
→ the price remains in the lower half of the red channel, drawn along this sequence.
From a bullish perspective:
→ $650 serves as a psychological support level;
→ if the rise from the April low to peak A is viewed as an impulse, then the decline A → F is approaching $640, corresponding to the 50% Fibonacci retracement level.
Given the above, it is reasonable to assume that the market will now reassess the new factors revealed in the report. From a charting standpoint, this could mean a period of consolidation, with META’s share price fluctuating between the red median line and the current support level of $650.
This article represents the opinion of the Companies operating under the FXOpen brand only. It is not to be construed as an offer, solicitation, or recommendation with respect to products and services provided by the Companies operating under the FXOpen brand, nor is it to be considered financial advice.

META Platforms — Can Bulls Escape With $800 Loot?📈 META Money Heist: Bullish Thief Swing/Day Trade Plan! 💰🔥
Date: 08 September 2025
Asset: META Platforms, Inc.
Trading Style: Money Heist Plan with Thief Strategy (Swing/Day Trade) 🦹♂️
Plan: Bullish (Pullback in the LSMA Moving Average) – Bulls charging for upside momentum! 🚀
🎯 Entry: Any Price Level – Thief Using Layer Strategy
Deploy multiple limit orders (layering style entries) at $730.00, $740.00, $750.00 (scale up layers based on your preference).
Be a stealthy trader, sniping entries during pullbacks for max profits! 🕵️♂️
🛑 Stop Loss: Thief SL at $710.00
Dear Ladies & Gentlemen (Thief OG's), adjust your SL based on your strategy and risk tolerance. Protect your loot! 🛡️
Please adapt your SL to your own strategy, risk appetite, and style — take profits when it makes sense for you.
🎯 Target: Resistance + Overbought Zone + Trap Ahead
Escape with your stolen profits before the trap! Aim for $800.00 target. 🏃♂️💨
📝 Note: Dear Thief OG's
I’m not dictating your TP – it’s your heist! Take profits at your own risk and make the market your playground. 💸
💡 Why This Plan? Thief Strategy + Market Edge
The Thief Plan is a cunning, layered approach to "steal" profits from market pullbacks, aligning with META’s bullish technicals (near 52-week highs, above 200-day SMA). By stacking limit orders, you capitalize on dips in the LSMA moving average, riding the bulls’ strength with precision. Backed by strong fundamentals, macro trends, and greedy sentiment, this setup is primed for a high-reward heist! 🤑
📊 META Stock Sentiment & Market Outlook (08 Sept 2025)
🔢 Real-Time Data Overview
📈 Day Change: +0.51% (↑ $3.80)
📏 52-Week Range: $479.80 - $796.25
💰 Market Cap: $1.89T 🏆
😊 Investor Sentiment Outlook
Retail & Institutional Mood
🟢 Consensus Sentiment: Bullish (Greed Phase)
Analysts’ Price Target Avg: $822.41 (9.30% upside).
42/47 analysts rate META as "Buy" 🟢.
Institutions love AI-driven ad growth + strong cash flow. 💪
Fear & Greed Index
⚖️ Stock Market Sentiment Score: 53/100 (Neutral to Greed)
Driven by market momentum, options activity, and low volatility.
🔄 Crypto Sentiment: Neutral (53/100).
📉 Fundamental & Macro Score Points
Fundamental Strength ✅
💸 Valuation:
P/E Ratio: 27.32 (below peers’ avg 35.47).
Free Cash Flow: $57.63B (projected to hit $198.64B by 2035).
Profit Margin: 39.99% (industry leader).
🚀 Growth Catalysts:
AI boosting ad engagement.
Reality Labs innovation (long-term bet).
⚠️ Risks:
Regulatory scrutiny (antitrust/data privacy) 🚨.
High reliance on ad revenue (98% of total).
Macroeconomic Factors 🌍
📅 Upcoming Events:
CPI Inflation Report (11 Sept).
Fed Meeting (16-17 Sept) 🏦.
📊 Market Volatility: VIX stable (low fear).
🐂 Overall Market Outlook: BULLISH (LONG)
⏳ Short-Term: ✅
Price near 52-week high + above 200-day SMA.
Target upside: $900+ (Bank of America, DBS Bank).
📅 Long-Term: ✅
AI monetization + metaverse potential.
Undervalued by 29% (DCF model).
🎯 Key Takeaways
😊 Sentiment: Greed-driven optimism (institutional + retail).
💰 Fundamentals: Strong cash flow + EPS growth ($27.54).
🌍 Macro: Monitor CPI/Fed for volatility triggers.
⚠️ Risk: Regulatory risks offset by growth bets.
✅ Verdict: Bullish alignment across sentiment, fundamentals, and technicals.
📡 Related Pairs to Watch (in USD)
NASDAQ:AAPL
NASDAQ:GOOGL
NASDAQ:MSFT
NASDAQ:AMZN
NASDAQ:NVDA
✨ “If you find value in my analysis, a 👍 and 🚀 boost is much appreciated — it helps me share more setups with the community!”
#META #MoneyHeistTrade #BullishSetup #ThiefStrategy #SwingTrading #DayTrading #AIStocks #TechStocks #TradingView #StockMarket #FearAndGreed #BullMarket

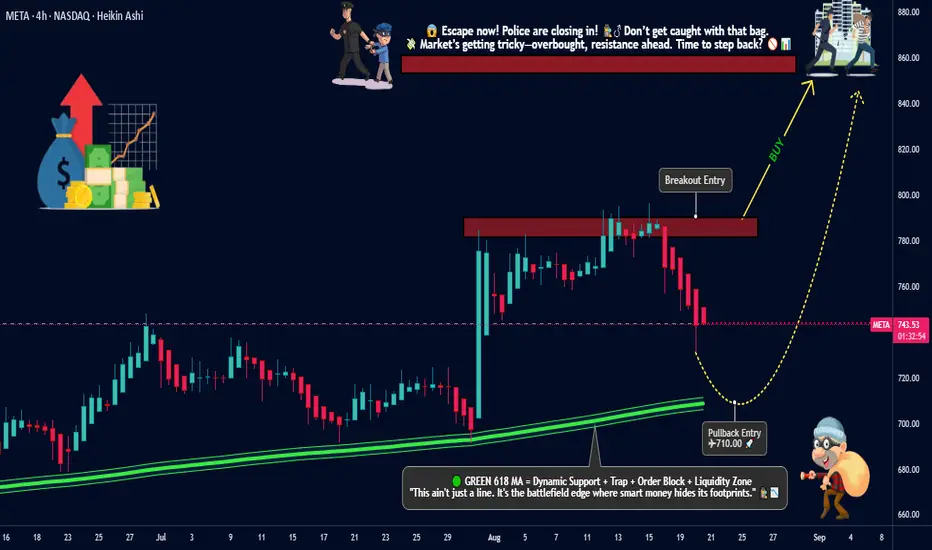
META Platforms Inc. Heist: Breakout Loot vs Pullback Entry🚨META Platforms Inc. Stock Heist Plan🚨
💎Asset: META Platforms Inc. (Swing Trade Robbery)
💎Plan: Bullish Break-In
📈 Breakout Entry: 790.00 (Vault Door Break)
📉 Pullback Entry: 710.00+ (Sweet Spot for the Thieves)
🔑 Any perfect pullback after 710.00, OG thieves may layer orders at chosen levels – stack the loot, DCA style!
🛑 Stop Loss (SL): Thief SL parked @ 675.00 (but remember OG’s—adjust based on your risk appetite & personal robbery strategy).
🎯 Target (Escape Point): 850.00 (Police barricade spotted! Don’t get greedy—take the cash and run before sirens go off 🚔💨).
🕵️♂️ Thief Trader Notes:
Use layering method (multiple limit orders) for maximum loot collection.
Don’t panic if guards (market makers) try to set traps; patience is the true thief’s weapon.
Adjust SL to protect your robbery stash.
Stay sharp—volatility = more doors to break in!
⚠️ Trading Alert for OG’s:
News & earnings reports are like security alarms—avoid entering new trades at that time.
Use a trailing SL to lock in profits once you’re in the getaway car 🚗💨.
💥 If you like this META Heist Plan, smash the Boost Button 💥 and join the robbery crew. Together we loot the markets, one breakout at a time! 🤑💰🏆
Meta Platforms (META) Shares Decline Amid AI ConcernsMeta Platforms (META) Shares Decline Amid AI Concerns
Shares of US tech giant Meta Platforms (META) fell by around 3% after media reports revealed that the company plans to reorganise its artificial intelligence operations for the fourth time in six months. The news has raised investor concerns over whether Meta’s AI strategy is on the right track.
Meanwhile, Bloomberg reports that Meta intends to begin selling its first smart glasses with a built-in display next month. However, the price may come in lower than expected — at $800 — as the company is willing to accept slimmer margins to stimulate demand (and, consequently, lower its profit outlook).
Technical Analysis of META Stock
In our previous analysis of META’s chart, we outlined an ascending channel and suggested that the bulls might attempt to push the price higher within this structure, supported by strong fundamentals following the company’s quarterly earnings release.
Since then, the price has climbed to new record highs (with the all-time peak now above $790). However, the technical outlook appears uncertain, with several bearish signals emerging:
→ Selling pressure may arise around the psychological $800 level.
→ The upper boundary of the channel is acting as resistance, and the price has formed a bearish double top pattern (as indicated by the arrows).
→ A bearish gap (highlighted in orange) may also act as an obstacle to further upward movement.
Additionally, adding an intermediate ascending trendline to the chart reveals the formation of a bearish rising wedge pattern.
At present, the price is hovering around the channel’s median line, but given the above factors, we could assume that the balance could shift in favour of the bears. In this case, META’s share price may undergo a significant correction.
Should this scenario unfold, the bulls could become active again around the support level at $747 or at the lower boundary of the channel.
This article represents the opinion of the Companies operating under the FXOpen brand only. It is not to be construed as an offer, solicitation, or recommendation with respect to products and services provided by the Companies operating under the FXOpen brand, nor is it to be considered financial advice.
Meta Platforms (META) Shares DeclineMeta Platforms (META) Shares Decline
Shares of the US tech giant Meta Platforms (META) hit a record high last week, climbing above $780 following the release of a strong earnings report:
→ Earnings per share (EPS) came in at $7.14, significantly exceeding the forecast of $5.88.
→ The company also outperformed expectations on key metrics related to advertising growth.
→ Additionally, the media has highlighted the growing importance of AI technology to Meta’s business.
However, shortly after reaching an all-time high, META shares began to show bearish momentum.
Technical Analysis of the META Chart
On the four-hour chart, the following signals are visible:
→ A bearish engulfing pattern formed on Thursday;
→ A bearish gap appeared at Friday’s market open, followed by a continuation of the downward move.
This represents a notable pullback from the historical peak — potentially indicating that the initial bullish reaction to the earnings report has faded. The share price decline suggests a correction from overbought territory, as confirmed by the RSI indicator.
The $740 level appears to be a key support zone — previously acting as major resistance before the breakout. Bulls could also find support from the median line and the lower boundary of the ascending channel that has been developing since mid-May.
Given this context, a scenario in which bulls attempt to resume the uptrend within the ascending channel cannot be ruled out, especially considering the company’s strong fundamentals and the presence of multiple technical support levels.
This article represents the opinion of the Companies operating under the FXOpen brand only. It is not to be construed as an offer, solicitation, or recommendation with respect to products and services provided by the Companies operating under the FXOpen brand, nor is it to be considered financial advice.
Meta - The breakout in question?🪓Meta ( NASDAQ:META ) is retesting major structure:
🔎Analysis summary:
After Meta perfectly retested a major previous support trendline in 2022, the trend shifted bullish. We have been witnessing an incredible rally of about +700% with a current retest of the previous all time highs. Time will tell but a bullish breakout remains quite likely.
📝Levels to watch:
$750
🙏🏻#LONGTERMVISION
Philip - Swing Trader

META Platforms Long Setup – Ready for the Next Move?💣 META Masterplan: Bullish Break-In Activated! 💼📈
🌟Hi! Hola! Ola! Bonjour! Hallo!🌟
Dear Money Makers & Silent Strategists, 🤑💰💸✈️
We’ve locked in on our next high-value digital vault: META Platforms Inc.
Built on our signature Thief Trading Style™ — where fundamentals meet stealth technical precision — this is your map to the bullish jackpot.
📍 ENTRY PLAN – Door’s Unlocked!
✅ Enter at any level — this heist is already in motion.
OR
🎯 Set your Buy Limit on a 15m/30m swing low or high — classic pullback infiltration.
🛑 STOP LOSS – Your Exit Route
Before breakout? Hold the line.
After breakout? Drop your SL at the recent 4H swing low – and size it to your risk appetite.
This isn’t luck — it’s calculated theft. 🔐
🎯 TARGET ZONE – Grab & Vanish
🎯 Aim: 770.00
But if the cops (aka sellers) show up early, get out with your loot — no shame in a clean getaway.
“Profit is the win. Perfection is fantasy.”
⚡ SCALPERS' TIPS – Quick In & Out
💵 Big wallet? Enter now.
💳 Tight budget? Follow the swing team.
Either way — longs only, and trailing SL is your safety rope.
📊 WHY META? – Intel Behind the Mission
🔍 This plan is reinforced by:
🔥 Strong Fundamentals
📈 Sentiment Signals
🧠 Quantitative + Macro Flow
💼 COT Data
🌐 Intermarket Correlations
It’s all aligning — the pressure’s building, and the breakout door is creaking open...
🚨 TRADING ALERT – Stay Outta Trouble
💥 Avoid placing new trades during major news drops.
🎯 Use trailing SL to protect and lock profits — your getaway vehicle must be ready.
💖 Support the Heist? Smash Boost!
Fuel the mission — every Boost empowers the crew.
This is Thief Trading Style — we don’t chase, we plan, strike, and vanish with the win. 🏆💪🐱👤
📡 Another breakout mission incoming. Stay hidden. Stay profitable. 🤑🚀

Meta Platforms (META) Shares Surge Over 3% in a DayMeta Platforms (META) Shares Surge Over 3% in a Day
Shares of American tech giant Meta Platforms (META) rose approximately 3.6% yesterday, continuing their upward trend after gaining about 18% in May.
Why Is META Stock Rising?
Reports emerged yesterday that the company plans to fully automate the ad creation process using artificial intelligence.
According to the Wall Street Journal, Meta Platforms (META) is developing a system that will allow ads to be fully created and targeted using artificial intelligence tools by the end of next year.
How Could AI-Based Social Media Advertising Work?
A brand provides a product image and budget, and Meta’s AI then:
→ generates ads that include images, videos, and text;
→ identifies the target audience across Instagram and Facebook (with a combined audience of over 3 billion users);
→ enables advertisers to personalise ads so that users see different versions of the same ad in real-time, based on factors like geolocation.
Technical Analysis of META Chart
From a bearish perspective:
→ the price has reached a line that previously acted as support but has now shown signs of becoming resistance (as indicated by arrows);
→ the round $700 level is seen as a psychological barrier, which the price failed to break above in February.
From a bullish perspective, a key support zone lies between the psychological level of $600 and the upper boundary of the bullish gap from 12th May around $622.
It’s worth noting that META's stock rally is underpinned by strong fundamentals:
→ the latest earnings report exceeded analysts’ expectations;
→ optimistic revenue forecasts through the end of the year;
→ hopes that trade wars will have minimal impact on social media platforms.
Therefore, it’s reasonable to assume that buyers may retain control and push towards new all-time highs above $700.
This article represents the opinion of the Companies operating under the FXOpen brand only. It is not to be construed as an offer, solicitation, or recommendation with respect to products and services provided by the Companies operating under the FXOpen brand, nor is it to be considered financial advice.

Meta Platforms:From Struggle to Surge - 2024 Investment OutlookIn 2022, Meta Platforms faced turbulent market conditions amid doubts surrounding CEO Mark Zuckerberg's metaverse ambitions, resulting in a significant 64% decline in share prices. However, the company's trajectory has undergone a remarkable transformation since hitting rock bottom, with shares soaring by 321% since the close of 2022.
Despite this impressive rebound, Meta's shares continue to present an attractive investment opportunity, supported by several compelling factors.
Meta stands out as one of the top-performing stocks in 2023, trading at a forward price-to-earnings ratio of 25.6, representing a discount compared to the Nasdaq-100 index's average forward P/E of 30.4. Wall Street analysts anticipate significant growth for the company, with projected compound annual rates of 14% for revenue and 21.3% for earnings per share over the next three years.
Moreover, Meta's unparalleled dominance in the social media landscape is a key driver of its appeal. With Facebook, WhatsApp, Instagram, and Messenger boasting over 4 billion monthly active users collectively, Meta's reach is unmatched, engaging nearly half of the global population.
The company benefits from formidable competitive advantages, including powerful network effects and a substantial data advantage, positioning it as a leader in digital advertising. With $132 billion in revenue in 2023, Meta has become the preferred platform for advertisers seeking targeted advertising and value for their spending.
Meta's robust financial performance further enhances its investment appeal, with a 2023 operating margin of 35% and $43 billion in free cash flow. The company's strong finances enable it to return capital to shareholders through stock buybacks and dividends, reflecting its commitment to delivering value to investors.
In conclusion, Meta Platforms emerges as a compelling investment opportunity in 2024, offering an appealing valuation, unparalleled social media reach, and robust financial performance. With its leadership position in the digital landscape and strategic investments in the metaverse, Meta is poised for continued growth and success in the years to come.

META Analysis! Trend Reversal!META Weekly Analysis!
Inverted Head and Shoulders Pattern Formation in META!
Trend Reversal in META!
META was in a clear downtrend. After it has made a Inverted Head and Shoulders pattern on a weekly timeframe. It has given a breakout to it's neckline and retested it so it can be act like a next support level which i've extended. Inverted Head and Shoulders pattern is a Trend Reversal Pattern. Now we can see a strong bullish momentum. The important upside levels are marked on the chart so please have a look on it and one more important thing is we can set a stop loss below the neckline.
Thank You!
Disclaimer = All my analysis are for Educational Purpose only. Before entering into any trade - 1) Educate Yourself 2) Do your own research and analysis 3) Define your Risk to Reward ratio 4) Don't trade with full capital

META Technical Analysis and Trade Idea#META has experienced a remarkable bullish surge. However, the 1D timeframe indicates potential weakness as we see the trend ranging sidweays creating lower highs. We are considering a possible retracement towards the 50-61.8% Fibonacci zone potentiall trading through the gap evidenced on the chart. This area typically attracts increased liquidity due to sell stops, potentially encouraging long positions from institutional traders.
Trading Considerations Meta Platforms:
Counter-Trend Short: Explore a short entry near the current price level, strategically placing a stop-loss above the recent highs. Maintain a 1:1 risk-reward ratio for this trade.
Fibonacci Buy: Target a potential buy opportunity close to the 61.8% Fibonacci retracement level. This aligns with the possible accumulation of long positions by larger market players. Utilize a stop-loss below the recent swing low, and define target levels as shown on the screenshot.
Disclaimer: This analysis offers my personal market interpretation for educational purposes and should not be considered direct financial advice. Always prioritize your own independent research and thorough risk assessment before making any trading decisions.

Meta - Buy The DipHello Traders, welcome to today's analysis of Meta Platforms.
--------
Explanation of my chart analysis:
During 2022 Meta Platforms declined massively and dropped more than -70% all the way down to the previous support at the psychological $100 level. From there we saw a pump of more than 250% after which we could now see a short term pullback followed by new all time highs.
--------
I will only take a trade if all the rules of my strategy are satisfied.
Let me know in the comment section below if you have any questions.
Keep your long term vision.

🚨♾Meta Platforms(META)♾ will Go Down at least ➖20%🚨🏃♂️♾ Meta Platforms(META) ♾ is moving near the 🔴 Resistance zone($332-$315) 🔴.
💡Also, we can see Regular Divergence (RD-) between two consecutive peaks .
In terms of Elliott wave theory , the Meta Platforms(META) seem to have completed the main wave 3 at the 🔴 Resistance zone($332-$315) 🔴 with the help of the Expanding Ending Diagonal Pattern .
🌊It is interesting to note that in the middle of main wave 3 , the main Bullish Long Island Pattern can be seen, which confirms our wave count.
🔔I expect the Meta Platforms(META) to lose at least ➖20% of its value after breaking the lower line of the Expanding Ending Diagonal and reaching the 🟡 Price Reversal Zones(PRZ) 🟡, Support line(1) and 🔵 200_SMA(Weekly) 🔵.
📚If you want to know about the types of Gaps , you can read the following article.👇
Meta Platforms( METAUSD) Analyze, Daily time frame⏰.
Do not forget to put Stop loss for your positions (For every position you want to open).
Please follow your strategy; this is just my Idea, and I will be glad to see your ideas in this post.
Please do not forget the ✅' like '✅ button 🙏😊 & Share it with your friends; thanks, and Trade safe.


META - KEYLEVELS 1htfMETA - KEYLEVELS 1htf
Meta is strong on his up trend , also beacuse we have a broken resitance on weekly time frame.
But now this zone looks more and more like a distribution zone , carefful on short META , if you wanna do it, maybe you need to wait for a broken red line ( neckline ) with a scalp trade.

Meta Platforms Analysis 13.12.2022Hello Traders,
welcome to this free and educational analysis.
I am going to explain where I think this asset is going to go over the next few days and weeks and where I would look for trading opportunities.
If you have any questions or suggestions which asset I should analyse tomorrow, please leave a comment below.
I will personally reply to every single comment!
If you enjoyed this analysis, I would definitely appreciate it, if you smash that like button and maybe consider following my channel.
Thank you for watching and I will see you tomorrow!

Trading The Correction In Meta PlatformsIn this update we review the recent price action in Meta Platforms and identify the next high probability trading opportunity and price objectives to target

FB Meta Platforms earnings todayIf you haven`t shorted FB at $341:
Look at the comments as well.
Then you should know that even Google`s YouTube was threatened by TikTok rise!
On the other hand a recent leaked documents claim lost control of user data from Facebook.
FB is closer to our buy area of $140-155.
Looking forward to read your opinion about it.
