Mastering MFI: The Money Flow Index as a Momentum, Volume...🔵 Mastering MFI: The Money Flow Index as a Momentum, Volume & Trend Framework
Difficulty: 🐳🐳🐳🐳🐋 (Advanced)
The Money Flow Index (MFI) is often overlooked, yet it combines price and volume into a single oscillator. This makes it one of the few indicators capable of revealing not just momentum — but participation and pressure behind price movement.
🔵 WHAT IS MFI AND WHY IT IS DIFFERENT
The Money Flow Index (MFI) was developed by Gene Quong and Avrum Soudack .
It is sometimes called the volume-weighted RSI because it blends momentum with volume.
Unlike RSI, which only measures price speed, MFI answers a deeper question:
Is money actually flowing into or out of the market?
MFI uses:
Typical price
Volume
Positive and negative money flow
This makes MFI especially useful for:
Detecting accumulation and distribution
Confirming trend strength
Spotting hidden divergence
Measuring volume pressure inside trends
🔵 WHY MOST TRADERS MISUSE MFI
Most traders use MFI like this:
MFI above 80 = sell
MFI below 20 = buy
This creates the same problem as RSI misuse:
Shorting strong trends
Buying weak trends
Ignoring money flow context
MFI is not an overbought/oversold oscillator by default.
It is a money flow and pressure indicator.
🔵 1. MFI AS MONEY FLOW (WHO IS BUYING AND SELLING)
At its core, MFI tracks whether volume is entering or exiting the market.
Rising MFI
Buyers are dominant
Volume supports price movement
Accumulation is occurring
Falling MFI
Sellers are dominant
Volume confirms distribution
Capital is leaving the market
Key insight:
Price can rise without MFI rising — this often signals weak participation.
🔵 2. MFI TREND REGIMES (TREND FOLLOWING WITH VOLUME)
Just like RSI, MFI forms regimes — but with volume confirmation.
Bullish MFI Regime
MFI holds above 50
Pullbacks stall around 40–50
Breaks above 60 show strong inflow
Bearish MFI Regime
MFI holds below 50
Rallies fail near 50–60
Breaks below 40 show strong outflow
Why this matters:
Trend continuation without money flow is fragile.
🔵 3. MFI DIVERGENCE (PRICE VS MONEY)
MFI divergence is more powerful than RSI divergence because it includes volume.
Bullish MFI Divergence
Price makes lower low
MFI makes higher low
Selling pressure is weakening
Bearish MFI Divergence
Price makes higher high
MFI makes lower high
Buying pressure is weakening
Hidden MFI Divergence (Trend Continuation)
Price makes higher low, MFI makes lower low
Price makes lower high, MFI makes higher high
🔵 4. MFI AS VOLUME PRESSURE INSIDE TRENDS
One of the most underrated uses of MFI is tracking pressure during pullbacks.
Healthy Trend Pullback
Price pulls back
MFI stays elevated
Volume does not flip aggressively
Weak Trend Pullback
Price pulls back
MFI collapses sharply
Volume exits the move
This helps separate correction from distribution.
🔵 5. MFI VS RSI (WHY THEY DIVERGE)
RSI and MFI often disagree — and that disagreement is information.
RSI rising + MFI flat/falling = price moving without volume
RSI flat + MFI rising = accumulation under the surface
RSI falling + MFI rising = absorption
Indicator disagreement often signals transitions.
🔵 6. MULTI-TIMEFRAME MFI ALIGNMENT
Professional rule:
Trade lower timeframe signals only when higher dominant timeframe MFI supports the direction.
HTF MFI rising = prioritize longs
HTF MFI falling = prioritize shorts
HTF MFI flat = expect range or traps
🔵 EXAMPLE TRADING FRAMEWORK
Bullish Setup Checklist
MFI above 50
Pullback holds 40–50 zone
Price forms higher low
MFI turns up before price
Bearish Setup Checklist
MFI below 50
Rally fails near 50–60
Price forms lower high
MFI turns down before price
🔵 COMMON MFI MISTAKES
Using MFI only as overbought/oversold
Ignoring volume context
Trading divergence against strong trend
Using MFI without structure confirmation
🔵 CONCLUSION
The Money Flow Index is far more than a simple oscillator.
It allows traders to:
Track real participation
Detect accumulation and distribution
Confirm trend strength with volume
Spot early momentum shifts
Filter false price moves
Price shows where the market moved.
MFI shows whether money agreed with that move.
How do you use MFI? Divergence, trend filtering, or volume pressure? Share your experience below.
MFI

Understanding Money Flow Index In TradingMoney Flow Index (MFI) is a volume-weighted oscillator (0–100) that blends price and volume to show where real buying or selling pressure is building. By comparing positive vs. negative money flow from the Typical Price ((H+L+C)/3) and volume, MFI acts like a volume-aware RSI .
Traders use it to spot overbought/oversold zones (commonly >80/<20), confirm trend regimes around the 50 line, and catch divergences that often precede reversals. It’s simple, fast, and works across stocks, crypto, and FX—best used with a clear market structure and disciplined risk management.
1) Why is MFI important in trading?
MFI blends price and volume into a single oscillator, helping you spot exhaustion, confirm trends, and catch divergences earlier than price-only tools. Think of it as a volume-weighted RSI that validates whether a move is backed by real participation.
Captures “true” buying/selling pressure via volume.
Flags overbought/oversold zones more selectively than RSI.
Great for divergences, regime reads, and pullback timing.
2) MFI Components
Typical Price (TP): (High + Low + Close) / 3
Raw Money Flow (RMF): TP × Volume
Positive/Negative MF: Sum RMF on up-TP vs down-TP bars
Money Flow Ratio (MFR): PMF / NMF
MFI Line (0–100): RSI-style transform of MFR
Default length: 14 (common, tweakable)
3) MFI Formula
//@version=5
// Formula sketch (not an executable script)
TP_t = (high + low + close) / 3
RMF_t = TP_t * volume
// Over N bars:
PMF = sum( RMF_t where TP_t > TP_{t-1} )
NMF = sum( RMF_t where TP_t < TP_{t-1} )
// If TP_t == TP_{t-1}, ignore bar
MFR = PMF / NMF
MFI = 100 - (100 / (1 + MFR))
4) Interpreting MFI signals
Here’s how to read the line like a pro.
Zones: Overbought > 80 (extreme > 90), Oversold < 20 (extreme < 10)
Divergences: Bearish = price HH while MFI LH; Bullish = price LL while MFI HL
Midline/Regimes: Above 50 favors bulls; below 50 favors bears
Failure swings: Overbought → pullback → lower MFI high while price retests = caution
5) Trend & Momentum Analysis
Use MFI to confirm trend strength and quality.
Bullish ranges: MFI oscillates ~40–90 in uptrends; 50 often holds on dips
Bearish ranges: MFI oscillates ~10–60; rallies stall near 50–60
Momentum bursts: Fast pushes into 80–90 after consolidation often precede breakouts
Multi-timeframe: Align higher-TF MFI regime (e.g., 1D) with lower-TF entries (e.g., 1H)
6) MFI-Based Trading Strategies
Practical, testable rules you can refine.
A) Mean Reversion (Counter-Trend)
Entry: MFI < 20 → bullish reversal candle or break of minor swing high
Invalidation: Below the setup candle’s low or last swing low
Exits: MFI back to 50–60, or retest of VWAP/mid-channel
B) Breakout Confirmation
Precondition: Sideways range, contracting volatility
Trigger: Close outside the range and MFI > 55–60 (or spike > 80)
Exits: Trail behind structure/ATR; partials at measured move of the range
C) Trend Pullback Buy
Context: Uptrend with MFI mostly > 50
Entry: Pullback drives MFI into 40–50 then curls up; enter on HH/HOC close
Exits: Prior high, Fib extensions, or when MFI loses 50 again
D) Divergence Reversal
Trigger: Clear price/MFI divergence + break of a micro trendline or last swing
Risk: Tight stop past divergence origin
Targets: Midline 50 first, then opposing extreme 80/20
Confluence ideas: Pair with RSI, OBV, Bollinger Bands, or Volume Profile; require session/time filters for intraday assets.
7) Limitations of MFI
Know where it can mislead you.
Strong trends can pin MFI at extremes (overbought can stay overbought).
Volume quality matters (tick volume ≠ , centralized exchange volume).
Parameter sensitivity: too short = noise; too long = lag.
Data irregularities (thin books, outages, rollovers) can skew readings.
8) Optimization
Smart tweaks that actually help in live markets.
Dynamic Zones: Replace fixed 80/20 with rolling percentiles (e.g., 90th/10th of last 252 bars).
Adaptive Length: Tie MFI length to ATR/realized vol to reduce whipsaws.
Session Filters: Act only during liquid sessions; avoid lunch hours/illiquid opens.
Walk-Forward Testing: Validate across regimes; don’t overfit one market.
Risk First: Size by ATR; plan partials; use time-based exits to avoid stagnation.
9) Key Takeaways
Wrapping it up with what matters most.
MFI is a volume-aware oscillator that improves on RSI in participation-heavy moves.
Use 50 as a regime filter; use 80/20 (or dynamic zones) for edges.
Best signals: divergences, trend-pullback resets, and breakouts with MFI thrust.
Respect limitations: trends can pin MFI; validate with structure and clear risk controls.
Optimize with percentile zones, adaptive lengths, and session filters—then forward-test.
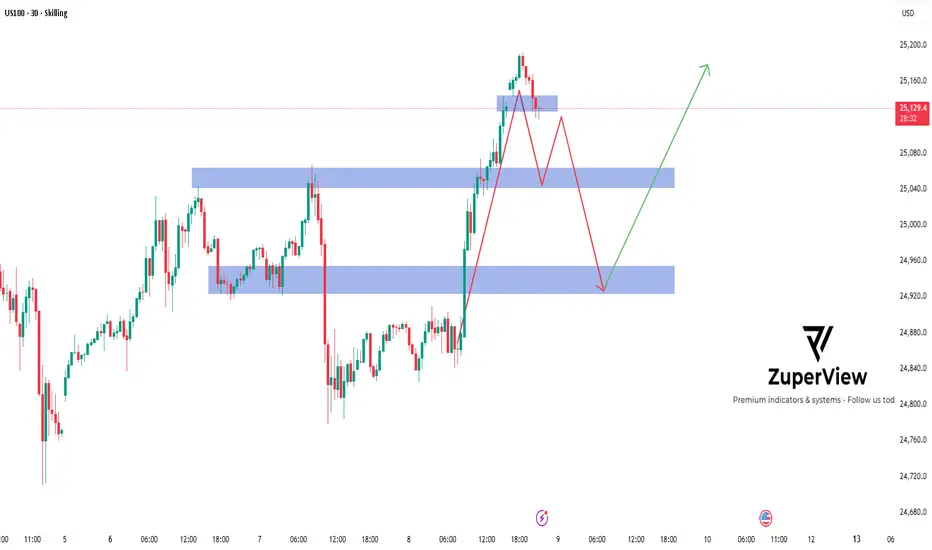
US100: Potential reversal from overbought zone
Symbol: SKILLING:US100
Timeframe: 30 Minutes
Indicators: OB/OS Overlap (RSI, MFI, Stochastic) + S/R
________________________________________
🔍 Quick Summary
After a strong rally 🚀 from the 24,750–24,800 support area, US100 has reached the 25,280–25,300 resistance zone — where multiple oscillators are showing overbought signals.
This suggests potential profit-taking or a technical correction may occur soon.
________________________________________
📊 Price Structure
• Price formed a temporary top after tapping the overbought area, with clear rejection candles near resistance.
• A pullback toward the first support zone around 25,000–25,050 could occur before the next move.
• If selling pressure continues, the next target area lies near 24,800–24,850, where previous structure and demand overlap 📉.
________________________________________
🧩 Technical Highlights
• OB/OS Overlap: RSI, MFI, and Stochastic are all in overbought territory (3/3 alignment) — a strong early signal of potential short-term exhaustion.
• Price Action: A minor double top or bearish divergence may be forming if momentum indicators continue to decline.
• Key Zones: Blue zones on the chart mark areas of potential buyer reaction (demand).
________________________________________
🧭 Scenario Outlook
Main Scenario (🔻 Pullback Expected):
Price could retrace toward 25,000–24,850 before buyers attempt a rebound.
Alternative Scenario (🚀 Continuation):
If the price holds above 25,100 and breaks 25,280, the bullish momentum might continue short-term.
________________________________________
⚙️ Risk Note
This analysis is for educational purposes only and not financial advice.
Always manage risk carefully and align your trade plan with your own strategy 📘💡.
Market conditions can change rapidly — stay flexible and objective!
Please like and comment below to support our traders. Your reactions will motivate us to do more analysis in the future 🙏✨
Harry Andrew @ ZuperView
JUPUSDT Swing Long IdeaJupiter is the second largest DEX on Solana and its price has been ranging for almost 1 year.
If all of crypto is getting ready to bounce JUP looks primed to breakout of the range,
RSI is crossing above the RSI MA and midpoint,
MFI is crossing above the midpoint,
JUP has outperformed TOTAL according to MA Based relative performance,
We recently saw the largest ever volume and volume MA.
All of this makes me think JUP wants to breakout from this range soon, hopefully TOTAL and BTC will allow that to happen.

RNDR Chart AnalysisLets break it down:
Structure and Price Action:
**Rising Wedge Formation**:
The chart shows a **rising wedge**, which is typically a bearish reversal pattern. Price is currently trading near the lower boundary of the wedge, increasing the likelihood of a breakdown.
**Red Resistance Zone**:
The price rejected the key **red resistance zone** between $10.0–$11.0, indicating strong selling pressure.
**Higher Lows**:
Despite rejection at resistance, the price has maintained **higher lows**, signaling bullish attempts to sustain the uptrend.
**Bearish Momentum Developing**:
Price is now testing the rising support line. A breakdown here could lead to a reversal toward lower levels.
Support and Resistance:
**Immediate Resistance**: $10.0–$11.0 (red resistance zone where sellers are dominant).
**Key Support Levels**:
$8.50: Rising support line and psychological level.
$7.50–$7.00: Green order block area where buyers previously stepped in.
Below $7.00: Strong support near $5.50–$5.00 (historical support zone).
Indicators:
Moving Averages (EMA 20/50/100/200):
Price remains above the **EMA 20** ($8.96) and EMA 50 ($7.82), showing bullish bias in the short-term trend.
The **EMA 100/200** at $7.03 and $6.68, respectively, provide stronger long-term support.
Money Flow Index (MFI):
**58.08** indicates neutral momentum but leaning slightly toward bullish, suggesting buyers still have some control.
Stochastic RSI:
The Stochastic RSI is currently near **oversold territory** (11.56), suggesting a potential bounce from support levels.
However, if price fails to hold support, oversold conditions can persist, leading to further downside.
Volume:
Volume during the recent move upward has been declining, suggesting weakening bullish momentum.
Watch for a volume spike on any breakout or breakdown to confirm direction.
Pattern Analysis:
The **rising wedge** pattern signals caution as it leans bearish. A breakdown below the wedge's lower trendline would confirm a reversal.
Rejection at the red resistance zone strengthens the bearish outlook unless bulls regain control.
Probabilistic Outlook:
Bearish Breakdown (Primary Scenario):
If price breaks below the rising support line (~$8.50), bearish momentum will increase.
Key downside targets:
**First Target**: $7.50 (order block zone).
**Second Target**: $7.00–$6.50 (EMA 100/200 levels).
**Third Target**: $5.50–$5.00 (major historical support).
Bullish Continuation (Alternate Scenario):
If price reclaims $10.0–$11.0 with strong volume, the uptrend will resume.
Key upside targets:
**First Resistance**: $11.50.
**Second Resistance**: $12.00–$12.50 (previous highs).
Key Signals to Watch:
A breakdown below the rising support line (~$8.50) = **Bearish confirmation**.
A breakout above $10.0–$11.0 resistance = **Bullish continuation**.
Volume spike during breakout or breakdown will confirm the move.
Conclusion:
The chart shows a **rising wedge** with weakening bullish momentum, increasing the probability (~65–70%) of a bearish breakdown. A decisive break below $8.50 would target lower levels at $7.50 and beyond. Conversely, a breakout above $10.0–$11.0 could invalidate the wedge and continue the uptrend toward $12.00.

BDL - On the Recovery ModeCurrently we can see many of stocks which had substantially come down from their highs are in the recovery mode. We will be covering some of these in the coming few days. We will start with the first one which is Bharat Dynamics Ltd.
The stock saw a bearish down move of more than 15% and ended up below the 200 DMA. Now it looks like it is on the recovery mode. It has crossed above the 200 DMA and the short-term moving averages. Also, it has broken the supply line as well. We can see good volume support coming in. All key parameters like the relative strength, money flow, buying pressure and the volume adjusted momentum all seem to be favouring the up move. The stocks saw a quick up move, then it saw a small consolidation and has started resuming the up move. We can see a break of structure on the daily time frame. Now the stock is making a higher high and higher low structure and is likely to continue the up move. We could see a substantial up move and the stock could test the previous high of 1770. Of course, the overall market situation should also support the move. However, the downside is now capped and we can see more upside only.

HUDCO - On the recovery Path ? The next recovery stock which we are going to look at is HUDCO or the Housing and Urban Development Corporation Limited. The stock saw a drop or reversal of 15% and was pushed below the 200 DMA and from there it has been recovering. As you can see now, it is above the 200 DMA and also the short-term moving averages. It has started making a higher high on the daily. It is also making a higher high on the weekly as well. All the supporting key parameters are all positive, the relative strength, the money flow, buying pressure, all are quite positive and is supporting further up move. We can see good increase in the delivery volumes indicating committed buying. So, the stock could test the previous high of 350 levels. Of course, it is not going to be a quick up move, it is going to be a grinding up move, but definitely it is likely to move up. The risk reward ratio also is looking quite good at this moment. So, this is a stock to be watched.

Selling opportunity in Bitcoin?I don't know if the price will go up or down. But I think buying now in areas of multiple resistances is a bit risky.
Any divergence in either the MFI or the RSI indicating buying exhaustion, I believe it is a good time to sell. As happened on July 28th.

BLS INTL SERVICES - Ready for a short term Up MoveThe stock had undergone a big correction even before the recent small cap index correction. The stock fell almost 28% from 475 to 340. It was pushed below the 200 DMA, from where it has been recovering. Even during the recent correction in the small cap index, the stock was in fact showing lot of strength and the relative strength compared to the small cap index is positive now. It is also making higher highs in the daily frame while it is still continuing to make the higher highs and higher lows in the weekly time frame as well. Now, it has also crossed above the short-term moving averages and the previous daily pivot. So, the stock looks likely to test 475 levels. So, I am looking at 15% returns in the short term from the stock. Of course, one has to always keep in mind the overall market weakness.

BOMBAY DYEING - Ready to Move to the Next OrbitThe stock after facing price rejection in the range of 224 to 241 was pushed down to the 50 DMA. It moved almost sideways in the last three months. Recently we saw some interest coming back into the stock with the relative strength and the money flow turning positive and the volume was also increasing. The stock remained very strong during the recent weakness we saw in the overall market. Now finally it has crossed above the price rejection zone with good volume support. The delivery volumes saw substantial increase recently. All other parameters like the buying pressure, volume adjusted momentums, absolute momentum everything seem to be favouring further up move. Looks like the stock is ready to move to the top into the next orbit.

TDPOWER SYSTEMS - Likely to resume the Up Trend?The stock was in an uptrend and met with some price rejection in the range of 436 to 451, then it was pushed down to below 50 DMA. Then we saw some strength coming back below the 50 DMA and then today we saw an “Effort to move up” bar. Now the price is at the supply line and once the supply line is broken then we can see the stock testing the previous rejection zone and with some momentum it could take out the Price Rejection Zone and move up. Now the buying pressure and the money flow are positive while the relative strength is on the verge of turning positive. There is some good volume support as well. We also could see some committed buying coming in terms of delivery volumes. So, looks like the momentum is building up and this should see a stock being pushed up to test the rejection zone and further up. In other words the stock look likely to resume the Up Trend.

RADICO - In to the next orbit ?The stock has been moving almost sideways with a upward bias for the last eight months. However, recently you can see that in the weekly it has been making a higher, high and higher lows. Now the stock has successfully moved out of this sideways range and also it has crossed above the supply line in the top. The move was with very high volumes. You can see a positive money flow in the weekly. On the daily you can see that the relative strength, absolute strength and the money flow has been positive. So, it looks like that stock is now ready to go into the next orbit. However, the ultra-high volume calls for some caution. So, one has to wait till the stock crosses above 1973 which is a high of the “BC” like bar of the last day. Relative strength turning positive on the weekly will add to the conviction.

UPL - Finally out of the woods?The stock had been in a downtrend for more than 15 months, losing almost 45% in value. In the last three months it was seeing some recovery and finally now it seems to be out of the woods. We can see the stock is making a higher high and higher low on the weekly and we can see a change of character in the weekly as well. Now finally the stock is decisively going above the 200 DMA and also the short-term moving averages. The relative strength and the money flow is also positive. Even the buying pressure and the absolute strength are also positive. It is showing a positive momentum as well. We can now confirm that the stock is finally ready to move up further and eventually the stock should be testing 800 levels.

SYNGENE - Gearing up for higher MoveThe stock after nearly 10 months of consolidation had come out of the consolidation zone and now it is attempting to take out the previous supply zone as well. As we can see in the weekly chart, the relative strength and the money flow index are positive. In the daily chart as well, you can find the relative strength, the buying pressure are all positive. However, the money flow has not picked up. Given these conditions, once the money flow also picks up, the stock is likely to go up higher after breaking out of the price rejection zone or the supply zone. A positive close above 858 level, will add to the conviction.

MINDA CORP - Gearing up for More Upside ?After almost two months of side ways move the stock is on the verge of taking out the previous Price Rejection Zone. My checklist all ticked right
Relative Strength
Buying Pressure
Increased volume
Money Flow
Absolute Momentum
Increased Delivery volumes
There is a high probability of the stock moving into the next Higher trajectory. A positive close above 527 will add more conviction.

Tata Consumer Products Ltd. This is one of the very few stocks that stood strong in a very weak market. Today when most of the stocks were going down heavily, this one stood quite strong. It has also made a very nice consolidation pattern, almost a cup and handle pattern. So, any good move above the handle would propel the stock to much higher levels. The Positivity will really come into play above the level 1250. This is a stock to watch.

KNR CONSTRUCTION - Moving to next orbit ?The stock, after a long consolidation of more than 2 years, made an impressive up move in late May, early June period. Then it met with supply around 344-410 levels. Then again it consolidated for almost 2 months taking support in the previous Major PRZ. Now it is trying to move out of this supply zone. All the other parameters like relative strength, money flow, buying pressure, the volumes, all look positive and likely to aid further up move. So, looks like the stock is going to go into the next higher orbit.

MOTILALOFS - Ready for 15% up move?The stock was already in a up trend. It faced Price Rejection around 720 level and retreated. Took support at the previous support zone and gearing to move up. Money flow is positive. RS is also on the verge of turning positive. We can good delivery volumes indicating interest longer term buyers. Now likely to test the PRZ . Hence we could see a quick 10-15% up move.

HBL POWER - High Probability for further up MoveThe stock faced price rejection around 612 on its upward journey and it was pushed down to the 200 DMA levels. And it moved almost sideways for 6 months. Multiple attempts to take out the rejection zone failed and recently it did succeed in moving out of the rejection zone. But it again went back to test the rejection zone. Now again it is moved up above the rejection zone and also the supply shadow of the BC bar of the 15th of July. As you can see the money flow is positive and the relative strength is also positive now. Th e volume has substantially increased and also the delivery volumes have increased in the recent past. All this does indicate that this current breakout of the rejection zone will sustain and it is highly probable that the stock will move up further.

When $ETH Money Flow Index turns green, new ATH! CRYPTOCAP:ETH has scaped the downward channel, but is still inside the horizontal channel (both in yellow)
Note the blue diamond from Detonator A Indicator forming now, indicating a possible local end of trend
Price will need to retest the support of downward channel first, as it coincides with both EMA200 (green tick line) and MA200 (red line)
After that retest, price will follow to the upper resistence level of the horizontal channel as the ATH box is a attractor for price because former trends have targets over the ATH box (those purple arrows)
When MFI (Money Flow Index, below pannel) turns green again, you know we will reach new heighs!

AFFLE - A stock to watchThe stock has been moving almost sideways for more than two years. Early this year it attempted to take out the old price rejection zone of two years at 1336 level, it failed and it was pushed down again below the 200 DMA. From there it started recovering and in the month of May the stock did make an attempt to take out this price rejection zone. It failed and again was pushed down below the 200 DMA. Now again it is making an attempt and it is crossed the rejection zone with a “Buying Climax” like Bar with a with widespread up bar on very high volume. Now the level 1390 is very significant now because once the price goes above this level it would cross the previous resistances from 2022 and also it would go above the supply shadow of the “BC” like bar which happened today. A bullish close above 1390 will take the stock higher. All other parameters like Relative strength, Money Flow, Buying Pressure and Momentum seem to support. The up move could struggle till 1510 level above which the ease of movement would be much better.

BLS - Gearing up for 15% - 20% move ?In early Feb, the stock faced price rejection around 430 levels and was pushed back to the 200 DMA levels. From there, it has been consolidating for almost three months. Now it is attempting to move up, it is about to cross the current price rejection level at 358. The relative strength is also turning positive and the money also started flowing into the stock. The volumes have been increasing including the delivery volumes indicating committed buyers are stepping in. The momentum has and Buying Pressure have been increasing recently. Once we have a positive close above 358 levels, we could see the stock testing the supply zone around 430 levels. This is a stock to watch.

CENTUARY PLY - Moving out of the Accumulation Zone. The stock has finally moved out of the consolidation zone. Late last December, the stock met with price rejection around 850 levels and it was pushed down below the 200 DMA levels. Then it started consolidating for almost three months now. The money flow had started increasing for the past month and the relative strength also started showing signs of recovery. Today, the stock moved out of the consolidation zone with a gap-up opening and a widespread up-bar. Of course, it did meet some supply. as we can see, the close was almost in the upper mid of the bar. The stock also moved above the short-term and the long-term moving averages and we can see the convergence of the averages as well. The relative strength also is moving into the positive territory. The volume has also started increasing and we can see increase in delivery volumes as well. The momentum has been positive for almost a month now. Looks like the stock is now poised to test the rejection zone at 850 again. However, we need to see some increase in the relative strength and the momentum as well. There is also a possibility of a retest of the accumulation zone.
