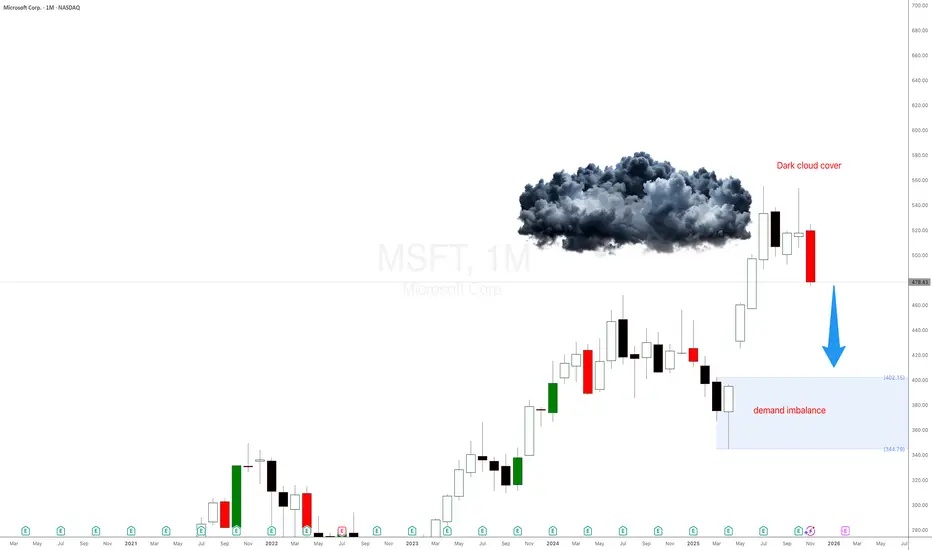
Microsoft $MSFT finally reached the strong monthly demand $396Microsoft NASDAQ:MSFT stock has finally reached the strong monthly demand $396. We talked about this imbalance a few weeks ago in another analysis after seeing the dark cloud cover bearish piercing pattern in the monthly timeframe.
It took a few months half a year to pull back to this imbalance. Hopefully Microsoft stock will start to rally from this imbalance the same way Meta Platforms did.
Microsoftanalysis

Microsoft - The worst day in 5 years!🚀Microsoft ( NASDAQ:MSFT ) remains bullish despite the crash:
🔎Analysis summary:
Today Microsoft created its worst day in five years. But at the same time, Microsoft is also approaching a significant confluence of support. And if we soon see bullish confirmation, Microsoft will just create another bullish all time high break and retest.
📝Levels to watch:
$430
SwingTraderPhil
SwingTrading.Simplified. | Investing.Simplified. | #LONGTERMVISION

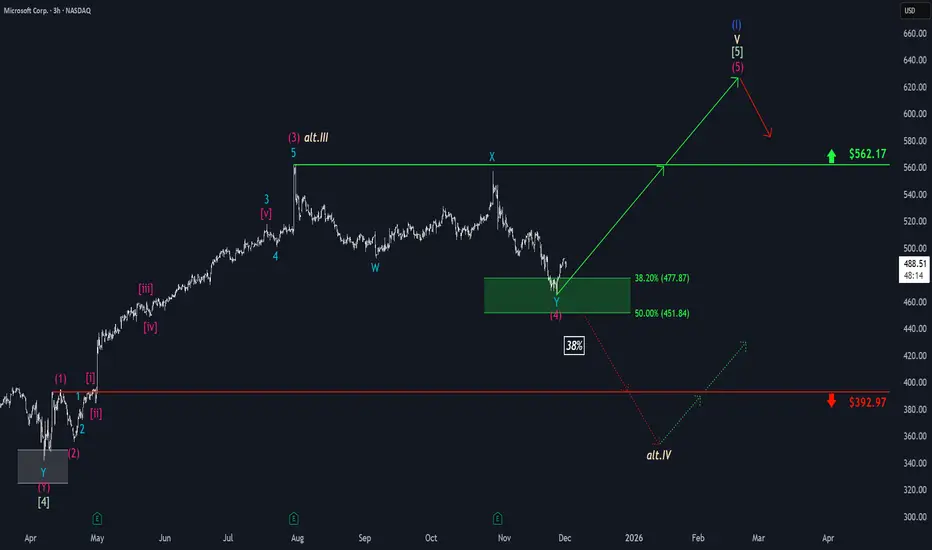
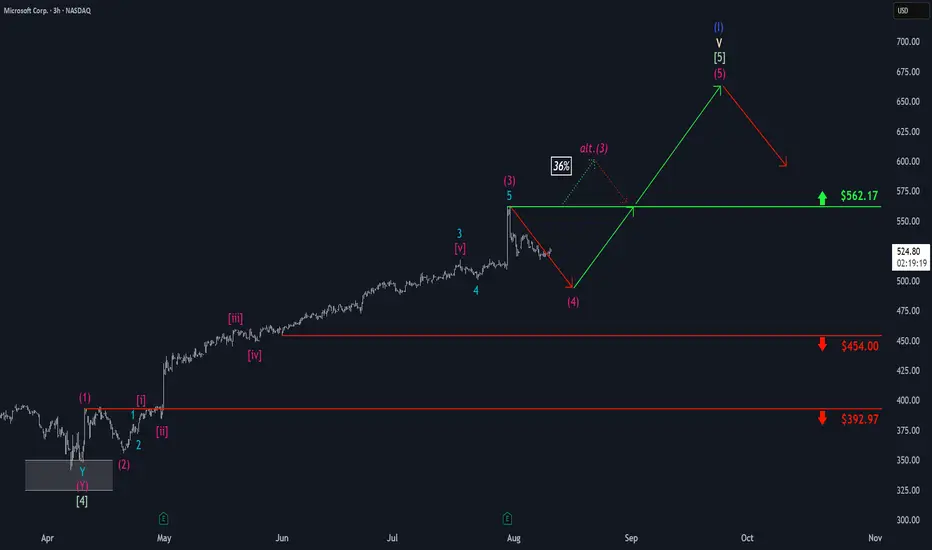
Microsoft: Back in the Target Zone!Microsoft’s stock has slid back, settling again within our green Target Zone between $477.87 and $451.84. We anticipate an imminent upward movement as part of the magenta wave (5), which is expected to push price beyond the resistance at $562.17. Just above this level, the large blue wave (I) is likely to complete before a significant correction begins. There’s also a 38% chance of additional selling pressure below the support at $392.97. In this case, the high of $562.17 would align with the beige wave alt.III , while the low of wave alt.IV would form below $392.97.

Microsoft: Target Zone Hit!Microsoft has reached our green Long Target Zone between $451.84 and $477.87 as anticipated. In the meantime, the stock has successfully completed the magenta wave (4) and has since broken out of the Target Zone to the upside. We now expect further gains as wave (5) unfolds, targeting a move above the resistance at $562.17, where the larger blue wave (I) is expected to conclude. After that, we anticipate a pronounced correction phase. However, there remains a 38% chance that MSFT could break down through the Target Zone and fall below the support at $392.97. In this case, we would reclassify the last significant high at $562.17 as the top of the beige wave alt.III and prepare for a new low in wave alt.IV .
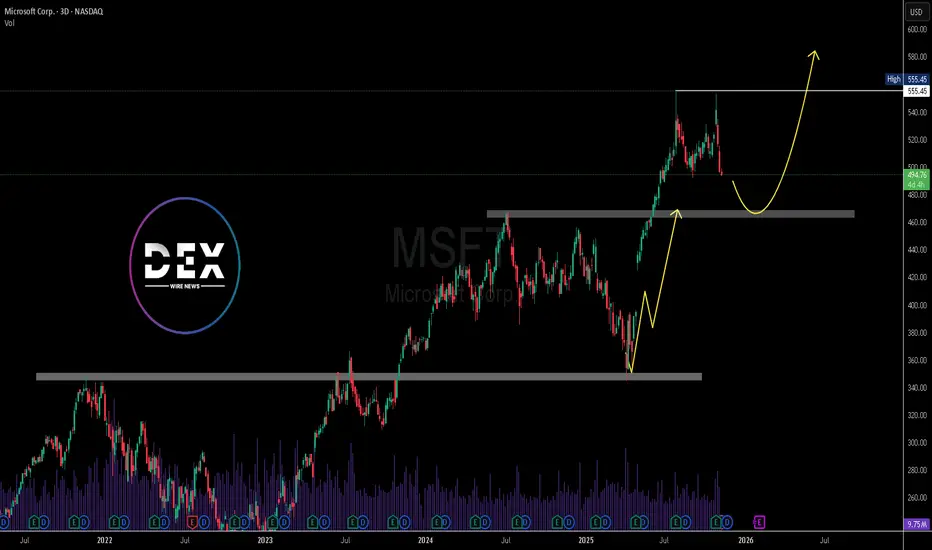
Why is Microsoft Stock $MSFT dropping hard?Microsoft just did what every impatient trader hates… after a massive rally, the candles are shrinking, emotions are rising, and here comes the correction everyone said ‘couldn’t happen.’ Today I’ll show you—using pure supply and demand—why MSFT is being magnetically pulled back into the monthly demand imbalance like a toddler to a candy shop. No fundamentals, no drama… just price action, imbalances, and patience. Let’s dive in.
Microsoft Monthly Supply & Demand Analysis
After Apple’s strong monthly correction setup, Microsoft (MSFT) is showing the exact same pattern — but even cleaner.
This is what I love when I teach traders to learn to trade stocks using pure price action and supply and demand imbalances. You don’t need news, earnings, or any guru opinion — everything is already priced in at the higher timeframes. Just like I explained in the Supply and Demand Free Course , the bigger timeframes tell you what the professionals already did months ago.
Let’s break it down.
Candles Shrinking = Momentum Weakening
Fast-forward to mid/late 2025:
- The wide-bodied candles disappeared
- Small-bodied candles appeared
- Then came the big bearish candle
This is classic momentum decay. This is exactly when most traders start acting emotionally:
- They zoom into 5-minute charts
- Their IQ drops by 50 points
- They forget the trend
- They forget the imbalance
- They become chart zombies
But price action never lies — we’re simply seeing exhaustion after a massive markup.
Microsoft Approaches Key Level, Expands Xbox Design Lab GloballyMicrosoft has announced a major expansion of its Xbox Design Lab through a new global partnership with ESW, significantly widening its international ecommerce footprint. Xbox Design Lab allows gamers to create personalized Xbox Wireless Controllers and Elite Series 2 controllers. With ESW now serving as the Merchant of Record, Xbox can efficiently handle cross-border payments, logistics and compliance, key components for scaling internationally.
The relaunch extends Xbox Design Lab access to 27 countries, including major markets across North America, Europe and APAC. Countries such as the U.S., Canada, Japan, Singapore, Australia, South Korea, Germany and the U.K. are all included in the upgraded rollout. ESW’s ecommerce infrastructure also enables Microsoft to customize checkout flows and streamline international operations under tight timelines. A joint roadmap promises expanded payment options and future global growth.
This move strengthens Xbox’s global branding at a time when personalization and gamer-focused experiences are becoming central to console ecosystems. With Xbox hardware sales stabilizing and Game Pass continuing to anchor recurring revenue, this expansion supports Microsoft’s broader gaming strategy. It also enhances Xbox’s competitive positioning against Sony by offering deeper personalization options and global accessibility. Fundamentally, Microsoft remains a high-margin, high-cash-flow giant with strong performance across cloud, AI, enterprise software and gaming, making this expansion another bullish development.
Technically, Microsoft’s stock maintains a long-term bullish structure. Price is currently trading near $505, trading towards $465 support zone after pulling back from the $555 high. The chart shows clean support and resistance levels that act as strong levels. As long as this $465 support holds, the larger bullish structure remains intact.
If buyers defend the $640–$660 region, a rebound toward $813 becomes the next upside target. A breakout above that level could lead to fresh all-time highs. If support breaks, next levels sit at the trendline near $600 or deeper support around $550. Overall bias remains bullish.
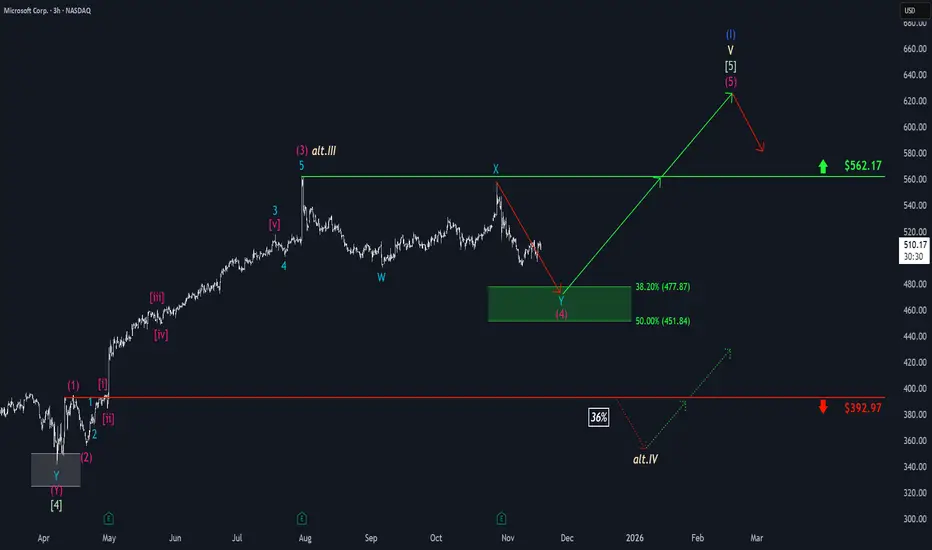
Microsoft: Stuck in Sideways PatternMicrosoft shares have continued to show weakness recently, although the stock has shifted into more of a sideways pattern. In the near term, we anticipate another downward move, which should establish the low for wave (4) in magenta within our green Target Zone between $477.87 and $451.84. From our perspective, this range remains attractive for long entries, as we expect a new upward impulse to follow as part of magenta wave (5). This move should push the stock above resistance at $562.17 and complete the larger blue wave (I). Alternatively, there is a scenario in which the high at $562.17 marks the end of beige wave alt.III (probability: 36%). In that case, we would expect a substantial decline below support at $392.97, where the low of wave alt.IV would be found.
Microsoft - This bullrun will end soon!💊Microsoft ( NASDAQ:MSFT ) might reverse soon:
🔎Analysis summary:
Microsoft created a textbook bullish break and retest back in the beginning of 2025. After this retest, we then witnessed a major rally of about +50% over the past couple of months. But considering the recent weakneses and resistance, this rally might be over very soon.
📝Levels to watch:
$550
SwingTraderPhil
SwingTrading.Simplified. | Investing.Simplified. | #LONGTERMVISION

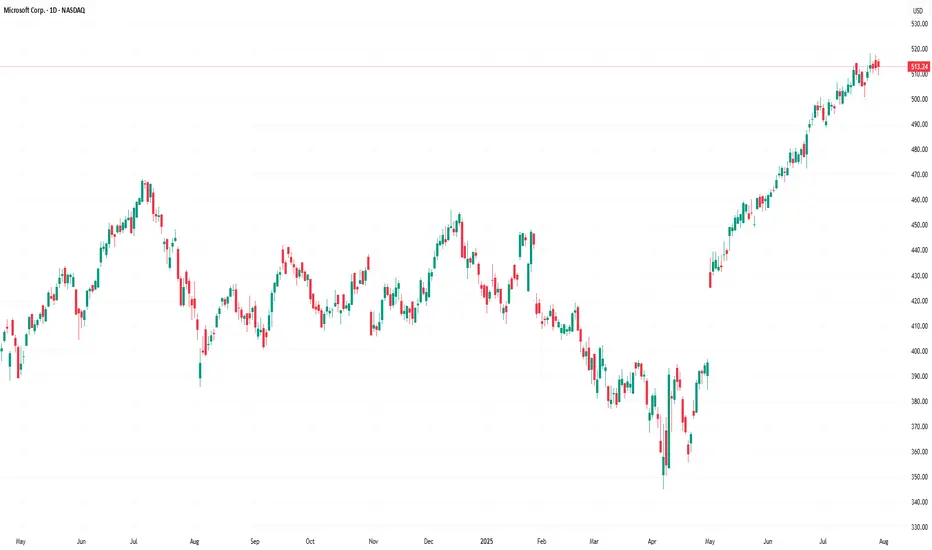
Microsoft Corp.($MSFT) Pullback Forms as AI Momentum Face Test Microsoft Corp. (Nasdaq: NASDAQ:MSFT ) stock slipped 0.34% to $495.43 on Thursday, extending its recent decline from October highs near $555. The retreat reflects broader consolidation in large-cap tech after months of AI-driven gains, with investors reassessing valuations ahead of the company’s next earnings release expected in late January 2026.
The pullback comes as Microsoft’s AI ecosystem continues to evolve rapidly. The company has integrated OpenAI-powered tools across its product lineup, including Microsoft 365, Azure, and GitHub, solidifying its leadership in enterprise AI solutions. However, concerns over slowing cloud revenue growth and competition from Amazon and Google have sparked short-term caution among traders.
Microsoft’s Intelligent Cloud segment remains a core growth driver, generating over $26 billion last quarter. Yet analysts have warned that enterprise clients may delay large-scale AI spending as they evaluate efficiency gains from early deployments. That has prompted expectations for slightly softer Azure revenue growth in the coming quarters.
From a technical perspective, the MSFT chart indicates a potential corrective phase after a strong two-year rally. The price has retreated from resistance around $555, with the next significant support seen near $460, a level that previously acted as a breakout zone. The projected yellow path on the chart suggests a possible retest of that support before a renewed advance toward $580.
Overall, Microsoft’s long-term trend remains bullish, driven by its expanding AI infrastructure, consistent cash flow, and dominant software ecosystem. However, near-term volatility could persist as the market digests regulatory updates and adjusts to a more moderate growth outlook in the AI sector.
Microsoft: Wave X Top Confirmed! As primarily anticipated, Microsoft shares recently reached the high of turquoise wave X just below resistance at $562.17 before quickly reversing lower. This decline, part of the same-colored wave Y, is likely to bottom within our magenta long Target Zone between $477.87 and $451.84, where we also expect the low of magenta wave (4). In our view, this range presents attractive opportunities for long positions, as we anticipate a renewed upward move during magenta wave (5) to follow. This rally should push price above the $562.17 resistance and complete the larger blue wave (I). Alternatively, we see a scenario in which the high at $562.17 marked only the end of beige wave alt.III (probability: 36%). In this case, a drop below the $392.97 support would be expected to form the low of wave alt.IV.

Microsoft: New Target Zone in PlaySince our last update, Microsoft shares have continued to decline, but there is still potential for an upside move. We do not yet consider the turquoise wave X to be complete. Once its high is established below the resistance at $562.17, we expect price to head lower toward the wave Y low. Our revised magenta long Target Zone is set between $477.87 and $451.84. The formation of this low should also mark the completion of magenta wave (4). Afterward, we anticipate the start of a new upward impulse within wave (5), which should push the stock above the $562.17 resistance and complete the larger blue wave (I). Alternatively, we assign a 36% probability to a scenario in which the recent high at $562.17 marked the end of beige wave alt.III . In this case, a decline below the support at $392.97 would be expected, forming the low of wave alt.IV .

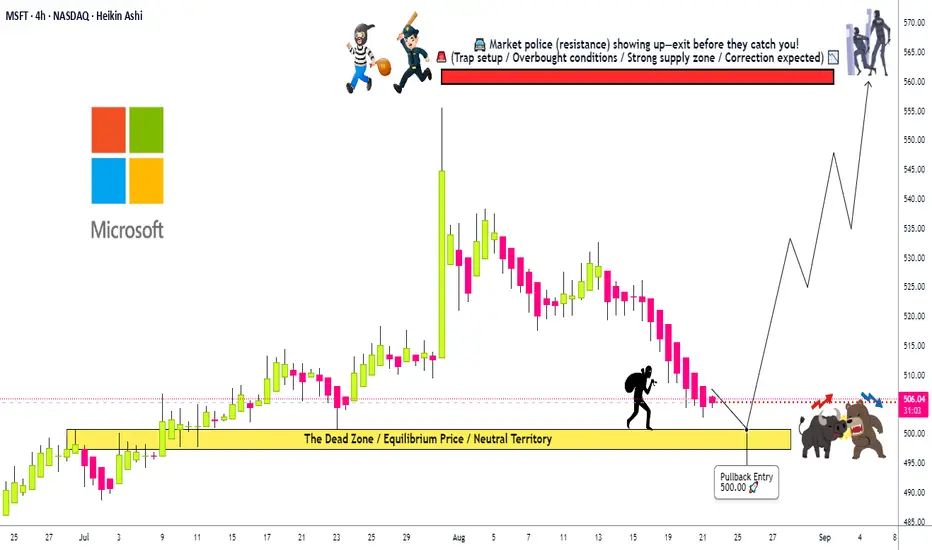
Microsoft: The Perfect Pullback Is Coming. Are You Ready?🌟 MSFT HEIST ALERT! 🌟 Steal from the Cops, Not from the Citizens! 🚔➡️🤑
Dear Ladies & Gentleman of the Thief Trading Guild, 🎩👒
Based on the 🔥Thief Trading Style Analysis🔥, here is our master plan to heist the Microsoft Corporation (MSFT) fortress. Our intel confirms a BULLISH ambush is setting up! It's time to loot! 💰💸✈️
🦹♂️ THE HEIST PLAN (SWING TRADE) 🦹♂️
Entry Point: The Perfect Pullback Loot Zone! 🎯
We're waiting for the asset to pull back to our LAYERED LIMIT ORDER TRAP! 🪤 Thief OG's use multiple entries to maximize the steal!
LAYER 1: 510.00 (First dibs!)
LAYER 2: 505.00 (Loading the bag!)
LAYER 3: 500.00 (MAIN HEIST - Perfect Pullback!)
LAYER 4: 498.00 (Bonus loot! Add more layers based on your own risk, thieves!)
Stop Loss: The Getaway Car Location! 🛑🏎️
This is Thief SL @ 485.00. This is where the trade idea is invalidated. Dear Thieves, adjust your final SL based on your own risk, strategy, and how many layers you used. Don't get caught! 👮♂️🚔
Target: The Police Barricade! 🚧🚨
Intel shows a major resistance wall (Police Barricade) at 565.00. Our mission is to escape with the stolen money BEFORE we get there! Escape Target: 560.00! Count your profits and live to trade another day! 💵🎉🤝
📢 THIEF'S BROADCAST 📢
Yo! Listen up, crew! 🗣️ If you're placing limit orders on this pullback, your stop loss should be set ONLY AFTER your order is filled! You feel me? Now, if you're smart, you'll place that stop loss where I told you 📍, but if you're a rebel, you can put it wherever you like 🤪 - just remember, you're playing with fire 🔥, and it's your risk, not mine! 👊
⚠️ TRADING ALERT : EARNINGS & NEWS ⚠️
MSFT is a big cap stock, and news/earnings can cause extreme volatility! To protect your stolen loot:
Avoid entering new layers before major news.
Consider taking some profit before earnings.
Use trailing stop-loss orders to protect running positions!
💖 Supporting our robbery plan = 💥Hitting the Boost Button💥 It fuels our getaway car and helps us find the next big heist! Let's make stealing money look easy! 🏆💪❤️🎉
I'll see you at the next heist, so stay tuned! 🤑🐱👤🤗🤩
Microsoft - A very profitable repetition!💰Microsoft ( NASDAQ:MSFT ) just repeats the cycle:
🔎Analysis summary:
At this exact moment, Microsoft is once again retesting the upper channel resistance trendline. Following all previous cycles, there is a 100% chance that we will see a short term retracement. Since the trend remains bullish, the all time high break and retest will follow.
📝Levels to watch:
$450, $700
SwingTraderPhil
SwingTrading.Simplified. | Investing.Simplified. | #LONGTERMVISION

Microsoft - This chart is too obvious!💡Microsoft ( NASDAQ:MSFT ) perfectly respects structure:
🔎Analysis summary:
Back in April of 2025, Microsoft created a textbook all time high bullish break and retest. After this move, Microsoft started a rally of +50%, perfectly in conformity with the rising channel pattern. The trend remains bullish for now, but a shorter term correction will follow quite soon.
📝Levels to watch:
$650
SwingTraderPhil
SwingTrading.Simplified. | Investing.Simplified. | #LONGTERMVISION

Microsoft: Wave (3) Complete – Wave (4) Pullback in ProgressAs Microsoft has reached a pronounced peak, followed by a notable move to the downside, er now consider wave (3) finished. Thus, we see price currently in the corrective phase of wave (4), which still has some immediate downside potential but should hold above support at $454. The subsequent wave (5) is expected to mark the high of the broader blue wave (I). At this point, we assign a 36% probability to the scenario where wave alt.(3) makes a higher high above the new resistance at $562.17.
Microsoft Soars to Record High Following Strong Earnings ReportMicrosoft Stock (MSFT) Soars to Record High Following Strong Earnings Report
As the chart illustrates, Microsoft (MSFT) shares surged sharply after the close of the regular trading session – an immediate market reaction to the company’s strong quarterly results.
According to available data, MSFT's post-market price jumped to $555 per share, exceeding its previous all-time high by more than 8%.
Why Did MSFT Share Price Rise?
The quarterly report provided several reasons for optimism, including:
→ Earnings per share (EPS) came in at $3.65, beating analysts’ expectations of $3.37 by over 8%. Revenue also exceeded forecasts, totalling $76.4 billion versus the projected $73.9 billion.
→ Microsoft’s cloud revenue rose by 27% to $46.7 billion, while Azure’s annualised revenue exceeded $75 billion, driven by growing demand for AI-related services.
In response to these results, Barclays analysts quickly raised their price target for Microsoft shares from $550 to $625.
Technical Analysis of MSFT Chart
It is worth noting that the previous quarterly report was also strong, resulting in the formation of a large bullish gap on 1 May, followed by a sustained upward trend (highlighted by the purple trendline S). Importantly, the gap in the $395–425 range remains unfilled.
Yesterday’s report is also likely to result in a large bullish gap at the market open today, though this time, the market context could lead to a different scenario.
The key factor here is the long-term ascending channel (shown in blue), which reflects MSFT’s price movements throughout 2024–2025. After the previous strong report, the share price moved from the median to the upper boundary of the channel without setting a new record high. However, following the most recent report, the price has surged deep into overbought territory, potentially setting a multi-month high on the RSI and achieving a significant breakout to a new record.
As a result, once the initial excitement around the earnings subsides – and the desire of investors to close long positions intensifies – MSFT could undergo a correction from the upper boundary of the channel. In this scenario, the following support levels could come into play:
→ The psychological level of $550 in the short term;
→ The S trendline, as a possible support during a deeper correction.
This article represents the opinion of the Companies operating under the FXOpen brand only. It is not to be construed as an offer, solicitation, or recommendation with respect to products and services provided by the Companies operating under the FXOpen brand, nor is it to be considered financial advice.
Microsoft: Progress!Microsoft successfully completed the magenta wave (2) and made further progress during the subsequent wave (3). Imminently, this wave (3) has some more room to rise, and after a temporary pullback in the following wave (4), the price should eventually overcome the resistance at $456.16. On the other hand, our 31% likely alternative scenario envisions a new low for the green wave alt. and would include a detour below the support at $348.18. Primarily, we consider the regular wave as already completed (in our previous Target Zone).

Microsoft (MSFT) Becomes the World’s Most Valuable CompanyMicrosoft (MSFT) Becomes the World’s Most Valuable Company
According to financial data, Microsoft’s market capitalisation currently stands at approximately $3.24 trillion, while the valuations of Apple and Nvidia — second and third on the list respectively — remain below $3 trillion.
This follows a sharp surge in Microsoft’s share price (MSFT), which has risen by over 26% from its April low.
Why has Microsoft’s share price risen?
The main driver behind the MSFT stock rally was last week’s quarterly report, which outperformed analysts’ expectations:
→ Earnings per share: actual = $3.46, forecast = $3.22;
→ Revenue: actual = $70 billion, forecast = $68.4 billion.
As reported in the media, investors responded positively to a notable increase in revenue from Azure cloud services.
Technical Analysis of Microsoft (MSFT) Shares
A wide bullish gap — over 7% — pushed the price above a key support line that had underpinned the 2024 uptrend in Microsoft stock.
However, following the report’s release, the price stabilised just below a resistance line drawn through previous key highs.
This provides grounds to interpret the current setup as a symmetrical triangle pattern with an axis around the $427 mark, suggesting short-term price consolidation within the defined boundaries.
Going forward, further key news related to Microsoft — a company less exposed to trade war impacts than Apple — could:
→ help maintain its status as the world’s most valuable firm;
→ support a potential bullish breakout through the resistance line and a continuation of the 2024 uptrend.
This article represents the opinion of the Companies operating under the FXOpen brand only. It is not to be construed as an offer, solicitation, or recommendation with respect to products and services provided by the Companies operating under the FXOpen brand, nor is it to be considered financial advice.

Microsoft (MSFT) Share Price Jumps Nearly 9% – What’s Next?Microsoft (MSFT) Share Price Jumps Nearly 9% – What’s Next?
As the chart shows, Microsoft (MSFT) shares surged sharply, forming a large bullish gap: while trading closed around $391 on 30 April, yesterday’s candlestick closed just below the $425 mark.
What Drove the Rally in Microsoft Shares?
Microsoft released its financial results for the first quarter of 2025, exceeding Wall Street expectations on both revenue (actual = $70.1 billion, 2.4% above forecasts) and earnings per share (actual = $3.46, 7.4% above forecasts).
Particular attention was drawn to the strong performance of Azure – revenue from Azure and other cloud services soared by 33% year-on-year. A significant part of this growth was fuelled by robust demand for artificial intelligence services, which helps ease concerns about the return on large-scale infrastructure investments related to AI.
In addition, Microsoft issued an upbeat outlook for the next quarter, which ultimately triggered the sharp rise in its share price.
Technical Analysis of MSFT Chart
Yesterday’s candlestick closed near its low (highlighted by the arrow), indicating that bears were active during the trading session. From a technical analysis perspective, this can be explained by the proximity of the price to two key resistance lines:
1 → The upper boundary of a descending channel drawn from significant price action patterns (marked in red). The relevance of this channel is confirmed by the price’s behaviour near its median line (dashed).
2 → A former trendline that served as support throughout 2024.
Therefore, a short-term correction cannot be ruled out following the sharp rally in MSFT shares, potentially tempering some of the enthusiasm generated by Microsoft’s strong quarterly report.
This article represents the opinion of the Companies operating under the FXOpen brand only. It is not to be construed as an offer, solicitation, or recommendation with respect to products and services provided by the Companies operating under the FXOpen brand, nor is it to be considered financial advice.

Is Microsoft really going to start moving up?After feeling like it has been in a never ending sideways cycle is Microsoft ready to start moving up again or is the company happy sleeping still?
We are at a demand zone maybe we can get a push up from here.....

Microsoft (MSFT) Shares Drop Over 6% After Earnings ReportMicrosoft (MSFT) Shares Drop Over 6% After Earnings Report
According to the Microsoft (MSFT) stock chart:
→ The candle on 29 January closed around $441 before the company released its Q4 2024 earnings report.
→ As a result, the 30 January session opened with a significant bearish gap and closed lower at around $415, marking a total decline of over 6%, despite the company exceeding analysts' expectations.
Media reports indicate:
→ Earnings per share (EPS) stood at $3.23, surpassing the forecast of $3.11.
→ Total revenue reached $69.63 billion, beating the projected $68.78 billion.
However, investor concerns arose due to slowing growth in Microsoft's Azure cloud segment and rising AI development costs. Business Insider reports that Microsoft plans to spend $80 billion on AI infrastructure this financial year. While this substantial investment aims to strengthen its AI position, doubts remain about its long-term profitability.
The technical analysis of the Microsoft (MSFT) stock chart presents a concerning picture, as the price has dropped to a key support level—the lower boundary of the upward channel (shown in blue). This channel was formed by a strong bullish impulse in early 2024 (indicated by an arrow), driven by AI enthusiasm. However, sentiment has shifted, with AI now acting as a selling trigger, increasing the risk of MSFT breaking below this key support.
If this happens, MSFT may test the psychological level of $400 per share once again. Notably, in 2024, the price has not stayed below this level for long.
Despite the recent decline, analysts remain optimistic about MSFT stock. According to a TipRanks survey:
→ 27 out of 30 analysts recommend buying MSFT.
→ The average 12-month price target for MSFT is $508.
Trade on TradingView with FXOpen. Consider opening an account and access over 700 markets with tight spreads from 0.0 pips and low commissions from $1.50 per lot.
This article represents the opinion of the Companies operating under the FXOpen brand only. It is not to be construed as an offer, solicitation, or recommendation with respect to products and services provided by the Companies operating under the FXOpen brand, nor is it to be considered financial advice.

Microsoft - We Will See A Correction!Microsoft ( NASDAQ:MSFT ) can actually create a correction:
Click chart above to see the detailed analysis👆🏻
Microsoft is one of the strongest stocks over the past decade and also over the past couple of months, there was no clear sign of weakness. Therefore, it is actually not extremely likely that a correction will happen, but if it does, this will offer a long term texbook trading opportunity.
Levels to watch: $420, $350
Keep your long term vision,
Philip (BasicTrading)

Microsoft (MSFT): What’s Next? Will It Break $455.34 Morning, Trading Family! Let’s Talk About Microsoft (MSFT): Will It Break $455.34 or Head Lower?
Microsoft’s stock is at a key level, and the next move could set the tone for what’s ahead. The magic number right now is $455.34. Will we see a breakout to new highs, or could the price dip lower before bouncing back? Let’s break it down step by step so everyone’s ready!
If Microsoft Breaks Above $455.34
If the stock moves above $455.34 and holds steady, it could signal that buyers are in control.
What could happen?
The price might head up toward $460 or even $465. These levels could be the next spots where the stock takes a breather.
What should we watch?
Look for strong movement above $455.34 with good trading volume (lots of action). If the price quickly dips back below, it could mean the breakout isn’t real yet.
How can we trade it?
If the price holds above $455.34, it might be a good time to think about buying with a target around $460. Just make sure to use a stop-loss in case the trade doesn’t go as planned.
If Microsoft Drops Below $455.34
If the stock struggles to stay above $455.34, we could see a pullback.
The first key level:
Watch $449. This is the next area where buyers might step in to stop the price from falling.
If $449 doesn’t hold:
The price could drop further, landing somewhere in the $443–$438 range, where stronger support is likely.
How can we trade it?
Be patient! If the price dips, wait for signs that it’s stabilizing at a support level before making any moves.
What If the Price Drops Below $438?
If MSFT falls below $438, it could mean the stock is turning more bearish. At that point, we’ll need to step back and reassess the trend.
Tips for Today’s Trading
If you’re bullish: Wait for the price to break and hold above $455.34 before jumping in.
If you’re bearish: Watch for a clean break below $449 for potential short opportunities.
Always: Use stop-losses to protect yourself and trade with a plan!
Bottom Line:
The $455.34 level is the line in the sand. If we break above, it’s good news for the bulls. If not, we could see a dip to $449 or lower.
Kris/ Mindbloome Exchange
Trade What You See
