STRATEGY Mirror crash with 2022 to $60 has started.Michael Saylor won't like this. But the chart is what it is and that's an objective dynamic.
** The 5-year Channel Up and Bear Cycle **
Strategy (MSTR) has been trading within almost a 5-year Channel Up since the February 2021 Top of its previous Cycle. Within this lines, it has had its latest top (Higher High) on the week of November 18 2024 and since then it has been on a structured strong decline.
This decline has gotten even stronger once the price broke below its 1W MA50 (blue trend-line). So far, the 2025 correction is mirroring the 2021 one, which was the start of a 2-year (2021/21) Bear Cycle.
** The three Stages **
Based on that, we have valid reasons to expect that 2026 will also mirror the past Bear Cycle. What stands out on this analysis is that we have classified the whole Bear Cycle into three Stages. Based on that, we have now already entered Stage 2 as the price has broken below its 1W MA50 (and should stay as the Resistance for the remainder of the Cycle) and almost touched its 1W MA200 (orange trend-line). When that happened in January 2022, the market rebounded towards the 1W MA50 where it was rejected and when it broke below the 1W MA200 as well, Stage 3 started. This Stage made the Bear Cycle bottom on the 1M MA250 (red trend-line) after a -90% decline in total. It was completed when the price broke above the 1W MA50 again, essentially confirming the start of the new Bull Cycle.
** Where is the bottom now? **
As a result, we may now see a short-term rebound, limited by the 1W MA50, which after it gets rejected and breaks below the 1W MA200, Stage 3 may start. If this Bear Cycle also crashes by -90%, we should then be expecting a bottom at $60 (at least), supported by the 1M MA250 again.
Notice also the striking symmetry among the 1W RSI patterns of the two Cycle fractals. The 1W RSI has currently hit the 30.00 oversold barrier (similar to Jan 2022) and it was a second break and then a Higher Lows Bullish Divergence that confirmed the bottom of the Bear Cycle, essentially turning Strategy Inc. into a long-term buy opportunity again.
---
** Please LIKE 👍, FOLLOW ✅, SHARE 🙌 and COMMENT ✍ if you enjoy this idea! Also share your ideas and charts in the comments section below! This is best way to keep it relevant, support us, keep the content here free and allow the idea to reach as many people as possible. **
---
💸💸💸💸💸💸
👇 👇 👇 👇 👇 👇
Microstrategysignals

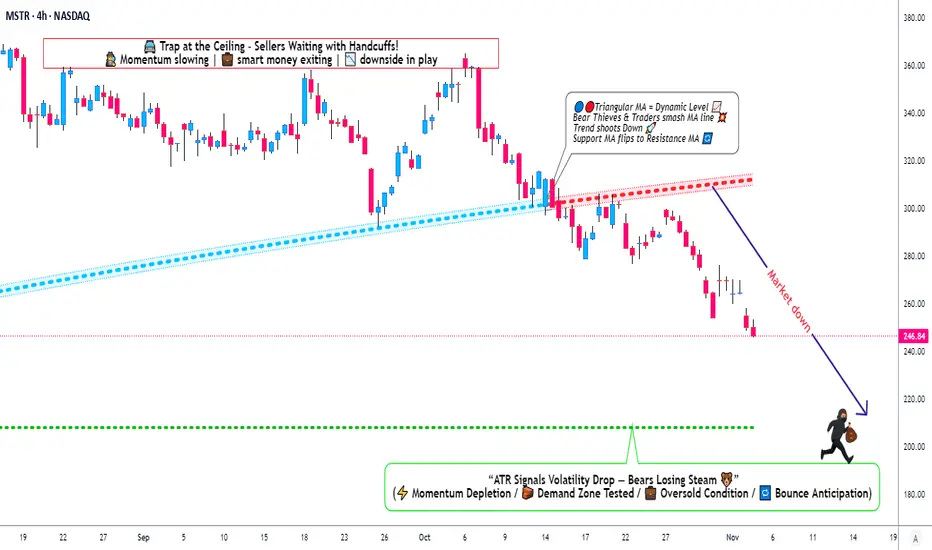
MicroStrategy Under Pressure: Bearish Playbook in Action🎯 MSTR: The "Thief's Playbook" - Strategic Bear Trap Setup! 💰🔥
📊 Asset Overview
MicroStrategy Inc. (MSTR) - Bitcoin's Proxy Play in the Stock Market
🎭 The Setup: When Bears Come to Party
Alright folks, gather 'round! We've got ourselves a textbook triangular moving average breakdown on MSTR that's screaming "short opportunity" louder than my portfolio after a bad trade week! 😅
Current Market Sentiment: 🐻 BEARISH CONFIRMED
The technicals are aligning like planets before a lunar eclipse - and trust me, this eclipse might cast some shadows on those long positions!
🎯 The "Thief Strategy" Game Plan
🚪 Entry Zones - The Layering Approach
Here's where it gets spicy! 🌶️ Instead of going all-in like a degen at a casino, we're using the "Thief Layering Method" - multiple limit sell orders to scale into this position:
Suggested Entry Layers:
🥇 Layer 1: $300
🥈 Layer 2: $290
🥉 Layer 3: $280
💎 Layer 4: $270
🔥 Layer 5: $260
Pro Tip: You can add MORE layers based on your risk appetite and account size. More layers = Better average entry = Smoother sleep at night! 😴
🛡️ Risk Management - The "Oh Sh*t" Line
Stop Loss: 🚨 $320
⚠️ IMPORTANT NOTICE: Dear Thief OGs, Ladies & Gentlemen! This SL is MY line in the sand. YOU need to decide YOUR own risk tolerance. Trade at your own risk, manage your own money, and don't blame me if things go sideways! This ain't financial advice - it's entertainment with charts! 🎪
🎁 Target Zone - Where We Cash Out
Take Profit Target: 🎯 $210
Why $210?
💪 Strong historical support level
📉 Oversold territory expected
Classic bull trap zone where longs get liquidated
⚠️ ANOTHER IMPORTANT NOTICE: Thief OGs! This is MY target. You do YOU! If you see profits earlier and want to secure the bag - DO IT! Don't be greedy. Take profits when YOU feel comfortable. Your account, your rules, your responsibility! 💼
🔗 Related Assets to Watch - The Correlation Game
Keep your eyes on these bad boys for confirmation:
📈 Direct Correlations:
NASDAQ:MARA (Marathon Digital) - Bitcoin miner, moves with crypto sentiment
NASDAQ:RIOT (Riot Platforms) - Another BTC miner, similar volatility pattern
NASDAQ:COIN (Coinbase) - Crypto exchange, sentiment indicator
CRYPTOCAP:BTC (Bitcoin spot) - The godfather! MSTR holds massive BTC, direct correlation
🧠 Key Points:
MSTR trades with ~1.5x-2x Bitcoin beta (more volatile than BTC itself)
When Bitcoin dumps, MSTR often dumps HARDER 📉
Watch BTC support at $60K - if it breaks, MSTR likely follows to our target zone
Tech sector weakness ( NASDAQ:QQQ , AMEX:SPY ) adds bearish pressure
⚡ Trading Psychology - The "Thief Mindset"
Look, this setup requires PATIENCE! 🧘♂️ Don't FOMO in at market price. Layer in like a professional thief planning a heist - calculated, methodical, strategic! This isn't gambling; it's probability management with a side of humor! 😎
🎪 Final Word from Your Friendly Neighborhood Chart Thief
Remember: Markets are wild, unpredictable, and don't care about your feelings OR your bills! This analysis is for educational and entertainment purposes ONLY. The "Thief Strategy" is MY trading style - it's risky, it's aggressive, and it's definitely NOT for everyone!
Do your own research. Manage your own risk. Trade what you can afford to lose. And for the love of all that's holy, don't mortgage your house based on some random internet chart analysis! 🏠❌
✨ If you find value in my analysis, a 👍 and 🚀 boost is much appreciated — it helps me share more setups with the community!
🏷️ #MSTR #MicroStrategy #ShortSetup #BearishBreakdown #SwingTrade #DayTrade #ThiefStrategy #BitcoinStocks #TechnicalAnalysis #MovingAverageCrossover #LayeringStrategy #RiskManagement #StockMarket #TradingIdeas #BTC #CryptoStocks #BearTrap #SupportAndResistance #ChartAnalysis #TradeSmart
🎯 Trade smart, layer in, manage risk, and may the profits be ever in your favor! 💰🚀
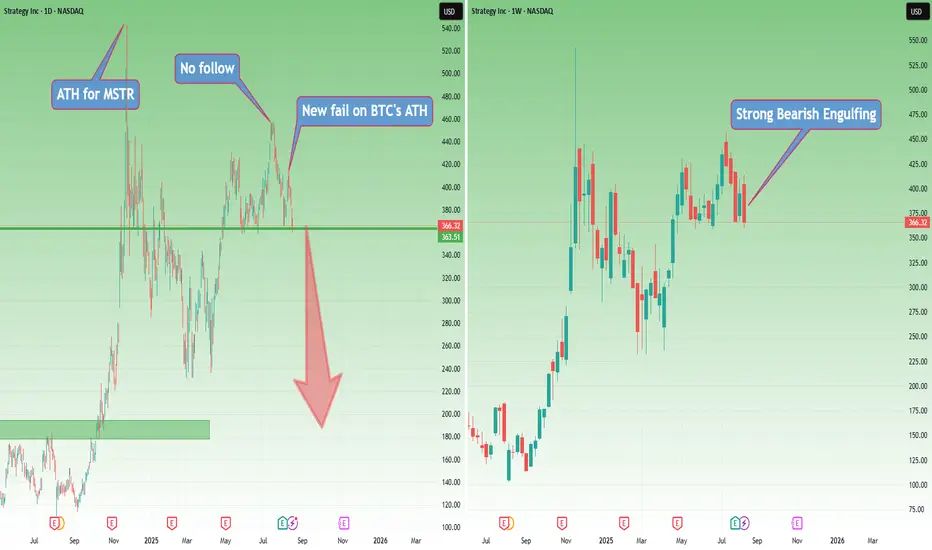
MSTR: A Giant with Feet of ClayExactly two weeks ago, I wrote an article with a rhetorical question: “Why should you buy Strategy if you want exposure to BTC?” and argued that MSTR could fall—and fall hard.
Two days ago, BTC printed a new ATH. That move was visible in MSTR as well; however, we’ve got a lower high and a new fail for the stock.
Even more, this fail has formed the right shoulder of an H&S pattern.
On the weekly chart, there’s a strong bearish engulfing that ended exactly at the neckline of the pattern.
This type of price action is far from bullish, regardless of what one may want to dream of.
BTC is above confluence support. If it breaks this level, Strategy will fall even harder.
In my last post, out of 12 comments, 5 were hate comments—because “how can I say such enormities, that Strategy could fall.”
The answer is simple: the chart doesn’t look good at all.
Even if BTC reverses from this support, in my opinion the reflection in MSTR will be minimal.
And anyway, I trade what I see, not what Saylor sells me.
That being said, a drop of BTC under confluence support will most probably lead to a break below the neckline for Strategy. And if BTC delivers a meaningful correction, Strategy will fall like a giant with feet of clay that it is.
MICROSTRATEGY Can $2000 be its next High?Microstrategy (MSTR) followed the exact trading pattern we suggested on our last analysis (December 27 2024, see chart below) as it made its technical correction December through March and rebounded aggressively in April:
Back then we called this a shift to a new paradigm and is no different than the April 1999 bounce than led to the eventual massive rally that made the Dotcom Bubble burst.
Since the recent All Time High (ATH) broke above the (blue) 23-year Channel Up, we applied the Fibonacci Channel levels all the way from its March 2000 Dotcom High. The fractal we mentioned before shows that the stock's next Target, and possibly this Cycle's High, can be on the 0.618 Fib at $2000.
-------------------------------------------------------------------------------
** Please LIKE 👍, FOLLOW ✅, SHARE 🙌 and COMMENT ✍ if you enjoy this idea! Also share your ideas and charts in the comments section below! This is best way to keep it relevant, support us, keep the content here free and allow the idea to reach as many people as possible. **
-------------------------------------------------------------------------------
💸💸💸💸💸💸
👇 👇 👇 👇 👇 👇

Strategic $MSTR Accumulation: $340 Break for Macro ContinuationDecided to start buying back some $MSTR. I’ve been waiting since late December to begin accumulating, and I initially thought it would stay above $300, forcing me to jump back in.
Now that it's in an optimal buy area with enough confluence on the weekly timeframe, I’m accumulating under $250. I’ll add the last chunk once it breaks above $340.
Just keep in mind there’s a strong weekly downtrend in play, but it’s already hit the first target, so I expect a bounce. If it reclaims the POC at $340, it would invalidate the downtrend. So, I'm taking my chances on a possible invalidation and a continuation of the macro trend.

Turning BTC into Revenue: MicroStrategy's Innovative ApproacMicroStrategy's Wild Ride: Navigating Bitcoin's Volatility with a "Yield" Strategy
MicroStrategy (MSTR), the enterprise software company that famously pivoted to a Bitcoin acquisition strategy, has seen its stock price plummet by roughly 16% year-to-date. This downturn mirrors the broader volatility experienced by Bitcoin, which has faced significant headwinds amidst rising interest rates and macroeconomic uncertainty. However, despite the short-term turbulence, a significant portion of stock analysts remain bullish on MicroStrategy's long-term outlook, primarily due to the company's innovative "Bitcoin yield" strategy.
MicroStrategy's bold decision to adopt Bitcoin as its primary treasury reserve asset, spearheaded by former CEO Michael Saylor, has inextricably linked its fortunes to the cryptocurrency's performance. When Bitcoin surges, MSTR typically follows suit, and conversely, downturns in the crypto market exert downward pressure on the stock. This direct correlation has made MSTR a high-beta play on Bitcoin, offering investors amplified exposure to the digital asset's price fluctuations, both positive and negative.
The recent decline in MSTR's stock price can be attributed to several factors. Firstly, the Federal Reserve's aggressive interest rate hikes to combat inflation have dampened investor appetite for riskier assets, including cryptocurrencies. This has led to a significant sell-off in the crypto market, dragging down Bitcoin's price and, consequently, MSTR's valuation.
Secondly, concerns about regulatory scrutiny in the cryptocurrency space have added to the market's unease. Increased regulatory oversight and potential crackdowns on crypto exchanges and projects can create uncertainty and dampen investor confidence.
Lastly, general market sentiment towards growth stocks and technology companies has been bearish, further contributing to MSTR's decline. As a company closely associated with the tech sector and the volatile cryptocurrency market, MicroStrategy has been particularly vulnerable to these broader market trends.
Despite these challenges, the bullish sentiment from stock analysts stems from MicroStrategy's unique approach to generating "Bitcoin yield." This strategy involves utilizing the company's substantial Bitcoin holdings to secure loans and generate revenue through various financial instruments.
One key component of this strategy is the use of Bitcoin-backed loans. MicroStrategy has successfully leveraged its Bitcoin holdings to obtain loans at favorable interest rates, effectively monetizing its digital assets without selling them. This allows the company to generate cash flow while maintaining its long-term Bitcoin position.
Furthermore, MicroStrategy is exploring other avenues to generate Bitcoin yield, such as participating in staking and lending platforms. These activities allow the company to earn interest or rewards on its Bitcoin holdings, further enhancing its revenue streams.
Analysts argue that this "Bitcoin yield" strategy provides MicroStrategy with a sustainable business model, even during periods of Bitcoin price volatility. By generating revenue from its Bitcoin holdings, the company can mitigate the impact of price fluctuations and maintain its financial stability.
Moreover, the company's continued accumulation of Bitcoin, even during price downturns, demonstrates its long-term commitment to the cryptocurrency. This unwavering belief in Bitcoin's future potential is seen by many analysts as a strong signal of confidence.
However, the "Bitcoin yield" strategy is not without its risks. The crypto lending market is still relatively nascent and subject to regulatory uncertainties. Counterparty risk and the potential for loan defaults are also factors that could impact MicroStrategy's financial performance.
Another element that is important to consider is the level of debt Microstrategy has taken on. The company has funded its Bitcoin purchases through debt offerings, and while the "Bitcoin yield" strategy is designed to cover the interest payments, a prolonged bear market could put pressure on the company's balance sheet.
The success of MicroStrategy's strategy hinges on the long-term appreciation of Bitcoin. If Bitcoin's price continues to rise, the company's Bitcoin holdings will increase in value, and its "Bitcoin yield" strategy will become even more profitable. However, if Bitcoin's price stagnates or declines, the company's financial performance could be negatively impacted.
In conclusion, MicroStrategy's stock price has experienced significant volatility in line with Bitcoin's performance. While the recent downturn has raised concerns, stock analysts remain optimistic about the company's long-term prospects, citing its innovative "Bitcoin yield" strategy. This strategy, which involves leveraging Bitcoin holdings to generate revenue, provides MicroStrategy with a unique business model that could potentially mitigate the impact of Bitcoin's volatility.
However, investors should be aware of the risks associated with this strategy, including regulatory uncertainties, counterparty risk, and the potential for loan defaults. The success of MicroStrategy's strategy ultimately depends on the long-term trajectory of Bitcoin's price. As the cryptocurrency market continues to evolve, MicroStrategy's ability to adapt and navigate these challenges will be crucial to its future success.

Microstrategy likely to $20 soonI see Microstrategy pushing up to hit the above TL soon.
There is likely a push higher because of the incoming US president.
Entry: $333
Stop loss: $322
TP1 : $360
Dont risk all your equity for one trade this year. Be a risk manager.

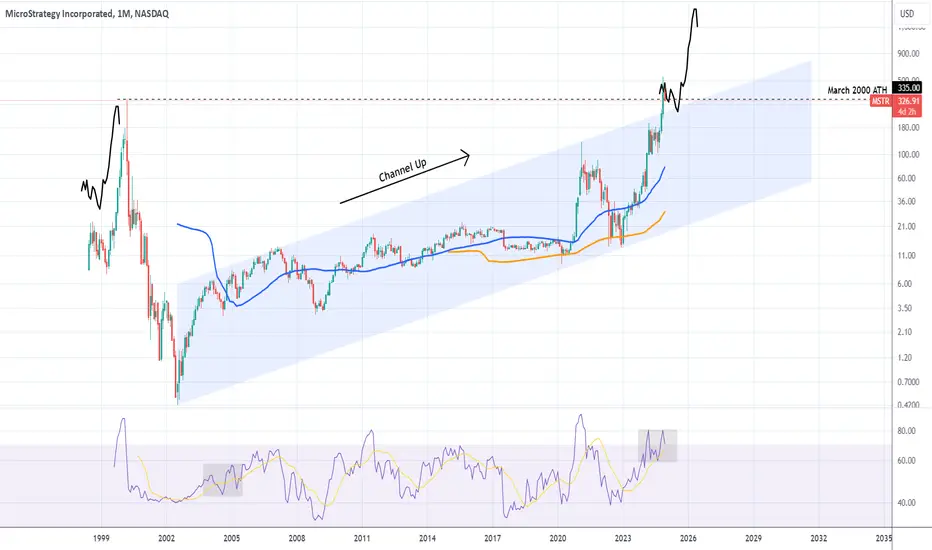
MICROSTRATEGY Is it shifting towards a new paradigm?Microstrategy (MSTR) is defying all odds during this bull run and recently it achieved perhaps its most important one: it broke above its All Time High (ATH) of $335.00 registered in March 2000. This historic feat took place on the same month (November) that it broke and closed above its historical Channel Up pattern, which has been dictating its trend since the bottom of the Dotcom Bubble correction in 2002.
This is perhaps ushering a new era for the company. Along with Bitcoin it may be shifting to a new paradigm and the uptrend may be accelerated in a similar way as it did in 1998 - 2000. Technically we will be in a position to know that if the current pull-back bounces of the top of the former historic Channel Up.
-------------------------------------------------------------------------------
** Please LIKE 👍, FOLLOW ✅, SHARE 🙌 and COMMENT ✍ if you enjoy this idea! Also share your ideas and charts in the comments section below! This is best way to keep it relevant, support us, keep the content here free and allow the idea to reach as many people as possible. **
-------------------------------------------------------------------------------
💸💸💸💸💸💸
👇 👇 👇 👇 👇 👇
MICROSTRATEGY Bottom on Inverse Head and Shoulders. Eyeing $2000MicroStrategy Inc. (MSTR) is about to complete the Right Shoulder of an Inverse Head and Shoulders (IH&S) pattern, which is a bottom formation technically. The Head was formed on the 4H MA200 (orange trend-line), a long-term Support for the stock, while the price is now testing the 4H MA50 (blue trend-line) as Resistance.
We saw this exact same behaviour on MSTR's previous bottom (May 01) and right when it broke above the 4H MA50, it peaked marginally above the 1.618 Fibonacci extension level. As a result, we expect a similar development and our Target is $2000.
Notice also that right when the price was testing the 4H MA50 last time, the 1D MACD formed a Bullish Cross, which is what it is currently doing. Strong similarities everywhere.
-------------------------------------------------------------------------------
** Please LIKE 👍, FOLLOW ✅, SHARE 🙌 and COMMENT ✍ if you enjoy this idea! Also share your ideas and charts in the comments section below! This is best way to keep it relevant, support us, keep the content here free and allow the idea to reach as many people as possible. **
-------------------------------------------------------------------------------
💸💸💸💸💸💸
👇 👇 👇 👇 👇 👇

MicroStrategy Owns About 1% of Bitcoin’s Total SupplyMicroStrategy ( NASDAQ:MSTR ), under the leadership of CEO Michael Saylor, has made waves yet again in the cryptocurrency market with its latest strategic move. The company has solidified its position as a major player in the Bitcoin space by acquiring an additional 9,245 Bitcoins, bringing its total holdings to a staggering 214,246 Bitcoins. With this acquisition, MicroStrategy ( NASDAQ:MSTR ) now possesses over 1% of the entire Bitcoin market supply.
The decision to invest heavily in Bitcoin is a testament to MicroStrategy's ( NASDAQ:MSTR ) unwavering confidence in the long-term value and potential of the leading cryptocurrency. Despite recent market fluctuations, MicroStrategy has continued to double down on its Bitcoin holdings, demonstrating its commitment to diversifying its assets and hedging against fiat currency depreciation.
The funding for this significant purchase was secured through a combination of sources, including a substantial convertible debt offering totaling $592.3 million and allocation from surplus cash reserves. This bold move underscores MicroStrategy's proactive approach to capital allocation and its willingness to leverage debt to capitalize on strategic investment opportunities.
However, the announcement of MicroStrategy's latest Bitcoin acquisition was met with mixed reactions from investors. Despite the company's bullish outlook on Bitcoin, MicroStrategy's stock experienced a 13% decline following the news, coinciding with a downturn in Bitcoin's price. This reaction highlights the inherent volatility and risk associated with cryptocurrency investments, despite their potential for substantial returns.
Looking ahead, MicroStrategy ( NASDAQ:MSTR ) has outlined its plan to repay its borrowed funds in a unique manner, offering investors the option to swap cash loans for MicroStrategy shares. This innovative approach to debt repayment reflects MicroStrategy's commitment to shareholder value and its confidence in the company's long-term growth prospects.
As MicroStrategy ( NASDAQ:MSTR ) continues to navigate the evolving cryptocurrency landscape, its bold Bitcoin investments serve as a testament to its visionary leadership and strategic foresight. With its substantial Bitcoin holdings and innovative approach to capital management, MicroStrategy is poised to remain a dominant force in the digital asset space for years to come.
By seizing opportunities in the volatile yet promising world of cryptocurrencies, MicroStrategy is setting a precedent for corporate adoption of digital assets and paving the way for a new era of financial innovation and opportunity.

MICROSTRATEGY Top of the Channel. Time for a shortterm pullback?MicroStrategy Inc. (MSTR) has been trading inside a logarithmic Channel Up on the 1D time-frame since the December 30 2022 bottom. The price is currently at the very top (Higher Highs trend-line) of the pattern and that is a technical bearish signal on its own.
It gets increasingly relevant though if we consider the 1D RSI which is overbought and at its highest level since November 13 2023 and more importantly, the remarkable symmetry among the phases of the Channel Up.
As you ca see the price action from the October 04 2023 Higher Low until today is very similar with the price action from the December 30 2022 bottom until (so far) the April 14 2023 High. Both started on a +136.17% rise then -40% correction and a Channel Up rebound for a new Higher High. The symmetry is evident among the 1D RSI sequences as well.
If this continues to hold, we should be expecting a -22.88% pull-back followed by a +77.48% rally that will break above the long-term Channel Up, which would inevitably do at some point since the stock price is so positively correlated to Bitcoin's price.
-------------------------------------------------------------------------------
** Please LIKE 👍, FOLLOW ✅, SHARE 🙌 and COMMENT ✍ if you enjoy this idea! Also share your ideas and charts in the comments section below! This is best way to keep it relevant, support us, keep the content here free and allow the idea to reach as many people as possible. **
-------------------------------------------------------------------------------
💸💸💸💸💸💸
👇 👇 👇 👇 👇 👇
