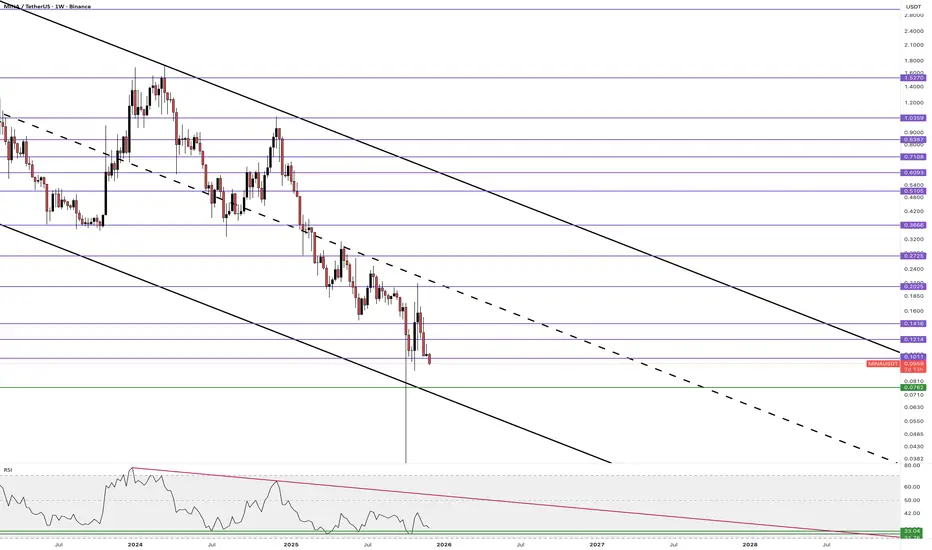
MINA/USDT — Market StructureMINA remains in a persistent downtrend.
A large amount of supply has been distributed from $0.20 and above.
Until price breaks and holds above this range, medium-term long positions are not justified.
🎯 A bounce can only be taken after a clear reversal setup forms — and there is none yet.
Also worth noting: weekly RSI is approaching oversold levels.
The 31–33 zone has historically produced bounces.
MINAUSDT
MINAUSDT Forming Bullish MomentumMINA/USDT is showing clear signs of bullish momentum, and the fundamentals strongly support a longer-term uptrend. The protocol is unique: it’s one of the lightest blockchains in the industry thanks to its use of recursive zk-SNARKs, meaning every node only needs to store a very small proof to verify the entire network. This architecture gives Mina a real scalability and decentralization edge — full participation without huge hardware demands.
Recently, Mina completed a major upgrade that unlocked full zk-app programmability. This means developers can now build and deploy zero-knowledge smart contracts (zkApps) on Mina’s mainnet, using off-chain execution while only submitting proofs on-chain. That’s a powerful paradigm shift: smart contracts become more scalable, private, and efficient. The roadmap for 2025 is also very aggressive, with o1Labs pushing hard on developer tooling like o1js, and the protocol targeting interoperability, new proof types, and a significantly deeper zk ecosystem.
On the institutional side, Mina is gaining traction: it recently secured support for institutional custody and staking via Cupper, which could unlock greater capital inflow. ( ) Meanwhile, on-chain activity appears to be ramping up, and more developers are building zkApps across voting, digital identity, gaming, and other verticals. ( )

Mina , the game changer .It’ll probably be wise to have some in this price. The tech behind it is crazy although it held down for long , the first ones always made huge profits made for investors sadly for mina it launched in a terrible time with the team underestimated the complexity of delivering promises for an advanced tech like Mina . I’m personally in a deep loss despite adding frequently from 0.60 $ .
The first zk layer 1 constant size blockchain which you can build almost everything in crypto world zero to the top ZK .
It’s no doubt undervalued and probably one of the most undervalued projects in the market .
With the geek genius team busy coding and transparent governance it’ll find the real price soon .

#MINA/USDT Bullish Impulse, New All-Time High Late 2025#MINA
The price is moving in a descending channel on the 1-hour timeframe and is expected to break out and continue upwards.
We have a trend to stabilize above the 100-period moving average again.
We have a downtrend on the RSI indicator, which supports an upward move if it breaks above it.
We have a key support zone in green that pushed the price higher at 0.1500.
Entry price: 0.1735
First target: 0.1894
Second target: 0.2026
Third target: 0.2115
For risk management, don't forget your stop-loss and money management.
The stop-loss is below the support zone in green.
Upon reaching the first target, take some profit and then change your stop-loss order to an entry order.
For any questions, please comment.
Thank you.

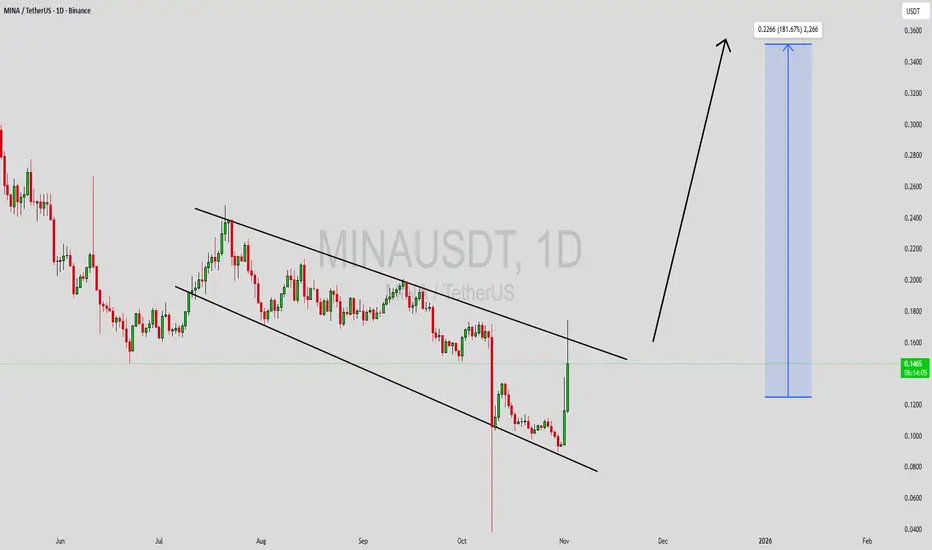
MINAUSDT Forming Falling WedgeMINAUSDT is forming a clear falling wedge pattern, a classic bullish reversal signal that often indicates an upcoming breakout. The price has been consolidating within a narrowing range around $0.163 USDT, suggesting that selling pressure is weakening while buyers are beginning to regain control. With consistent volume confirming accumulation at lower levels, the setup hints at a potential bullish breakout soon. The projected move could lead to an impressive gain of 140% to 150%+ once the price breaks above the wedge resistance, attracting searches for MINAUSDT price prediction.
This falling wedge pattern is typically seen at the end of downtrends or corrective phases, and it represents a potential shift in market sentiment from bearish to bullish. Traders closely watching MINAUSDT are noting the strengthening momentum as it nears a breakout zone near $0.17. The good trading volume adds confidence to this pattern, showing that market participants are positioning early in anticipation of a reversal in this zk-proof blockchain token.
Investors’ growing interest in MINAUSDT reflects rising confidence in the project’s long-term fundamentals and current technical strength, particularly with lightweight verification features for scalable dApps. If the breakout confirms with sustained volume, this could mark the start of a fresh bullish leg. Traders might find this a valuable setup for medium-term gains, especially as the wedge pattern completes and buying momentum accelerates in falling wedge breakout crypto plays.
✅ Show your support by hitting the like button and ✅ Leaving a comment below! (What is You opinion about this Coin) Your feedback and engagement keep me inspired to share more insightful market analysis with you!

MINAUSDT UPDATE#MINA
UPDATE
MINA Technical Setup
Pattern: Falling Wedge Pattern
Current Price: $0.563
Target Price: $1.13
Target % Gain: 100.93%
Technical Analysis: MINA is breaking out of a falling wedge pattern on the 1D chart, signaling a strong bullish reversal. The breakout is supported by growing volume and bullish momentum, confirming strength as price moves above key resistance.
Time Frame: 1D
Risk Management Tip: Always use proper risk management.

MINAUSDT Forming Bullish WaveMINAUSDT is currently showing strong bullish signs as it forms a bullish wavelling wedge pattern, which typically indicates a potential trend reversal and continuation of upward momentum. This pattern reflects consolidation within a narrowing range, suggesting that buyers are preparing for a breakout. The current structure hints that MINA may soon experience a surge in buying pressure as the wedge approaches its breakout zone. With volume remaining solid, the technical setup signals that traders and investors are positioning themselves for a significant move upward.
A confirmed breakout above the wedge resistance could trigger a powerful rally, aligning with the expected gain of 140% to 150%. The combination of steady volume, a strong technical pattern, and increasing interest from market participants provides a favorable environment for potential bullish momentum. Traders observing key resistance levels will likely look for confirmation before entering long positions, as MINA’s structure shows the potential to sustain upward movement once momentum builds.
The investor sentiment surrounding MINAUSDT continues to grow as this project gains more visibility in the market. The recent pattern formation combined with healthy accumulation points to confidence among both retail and institutional participants. If the bullish wave continues, this setup could mark the beginning of a major uptrend phase for MINA, making it an attractive pair to watch closely in the coming sessions.
✅ Show your support by hitting the like button and
✅ Leaving a comment below! (What is You opinion about this Coin)
Your feedback and engagement keep me inspired to share more insightful market analysis with you!
FREE SIGNALHello friends
You see that after a great growth we had, the price formed a flag and now the resistance has been broken and you can enter the trade with risk and capital management and move with it to the specified targets.
*Trade safely with us*

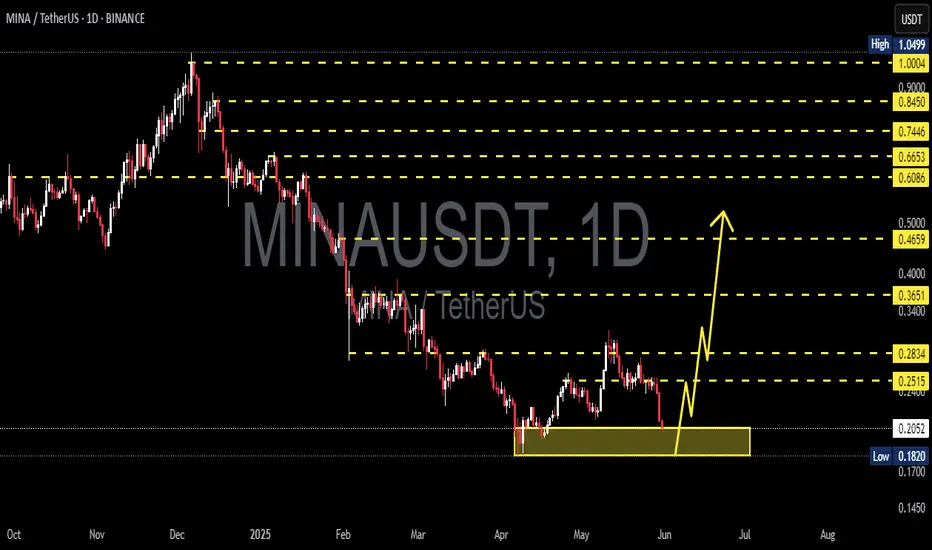
MINAUSDT — Descending Triangle: Approaching a Major Decision?🔎 Macro Structure
Since early 2025, MINA has been trending downward, consistently capped by a descending trendline (yellow).
Despite the ongoing bearish pressure, price has established a strong demand zone between 0.1650 – 0.1825, acting as a solid floor for nearly three months.
This structure forms a classic descending triangle:
Lower highs aligned with the descending trendline.
Flat support within the demand box.
In other words, price action is being “compressed,” signaling an imminent breakout or breakdown with high momentum.
---
🟢 Bullish Scenario
If buyers manage to break out above the descending trendline and secure a daily close above 0.2093, then:
The structure may shift into a short-term bullish reversal.
Step-by-step upside targets:
0.2370 → first resistance.
0.2984 → measured move target from the triangle height.
0.3638 – 0.4511 → potential higher resistance zones if momentum accelerates.
Such a breakout could mark the start of a trend shift from bearish to neutral-bullish.
---
🔴 Bearish Scenario
If sellers reclaim control and price breaks down below 0.1650, then:
The descending triangle breakdown confirms continuation of the broader downtrend.
Downside targets:
0.1459 → last significant low.
0.120 – 0.121 → projected target based on the triangle height.
A sustained breakdown below these levels could trigger a capitulation phase before discovering new support.
---
📊 Pattern & Market Psychology
Buyers are still defending the demand box, suggesting accumulation interest at discounted levels.
Sellers, however, remain dominant with continuous lower highs, reflecting downward pressure.
The descending triangle embodies this tug-of-war. Typically, the longer the consolidation, the stronger the breakout or breakdown that follows.
---
⚖️ Conclusion
At this stage, MINA is at a critical decision point:
Bullish case: A confirmed breakout above 0.2093 opens the door to 0.2370 and 0.2984.
Bearish case: A breakdown below 0.1650 paves the way to 0.1459 and potentially 0.120.
📌 The best approach now is patience — waiting for a clear daily close confirmation before committing to a major position, as this zone could spark MINA’s next big wave.
#MINA #MINAUSDT #CryptoAnalysis #PriceAction #DescendingTriangle #SupportResistance #BreakoutTrading #CryptoTA #ChartAnalysis
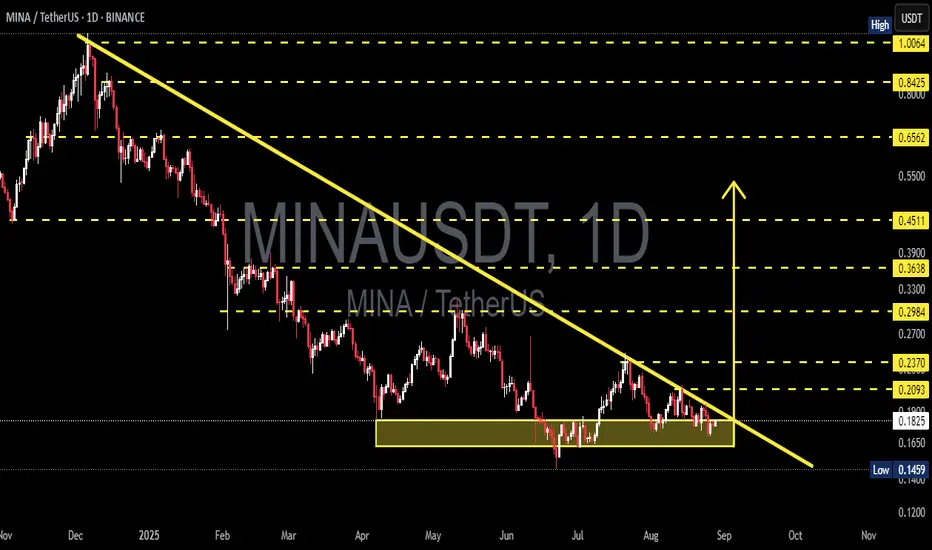
MINA/USDT – Major Downtrend Breakout! Early Signs of Reversal?📈 Full Technical Analysis – MINA/USDT (1D Timeframe)
After enduring a prolonged downtrend since late 2024, MINA is now showing strong technical signs of a potential trend reversal. A decisive breakout above the long-term descending trendline suggests that bullish momentum may be gaining traction.
🟨 Consolidation Phase & Strong Breakout
Price was previously stuck in an accumulation zone between $0.18 and $0.21 for several weeks.
The breakout occurred right after a successful retest of this key support zone, confirming it as a new demand area.
The structure also validates the formation of a descending broadening wedge, a bullish pattern that often signals exhaustion of selling pressure and the start of a new uptrend.
🟢 Bullish Scenario
If bullish momentum continues, here are the next key resistance levels to watch:
1. $0.2984 – Minor resistance and a psychological barrier.
2. $0.3686 – Previous swing high.
3. $0.4511 – Primary technical target based on the wedge height.
4. $0.6562 and $0.8425 – Potential mid-term targets if momentum accelerates.
✅ A daily candle closing above $0.25 with strong volume would further confirm the bullish case.
🔴 Bearish Scenario (Risk Case)
Despite the breakout, a failed continuation could still trigger a bearish move:
If price falls back below $0.21 and fails to hold the newly established support zone ($0.18–$0.21), this would suggest a false breakout.
A drop below $0.18 may retest the recent low at $0.1459, bringing back bearish sentiment.
⚠️ Watch closely for volume confirmation and rejection signs to avoid a potential bull trap.
🔍 Pattern in Play:
Descending Broadening Wedge ➜ Typically signals a bullish reversal after a downtrend.
Breakout + Successful Retest ➜ One of the strongest technical signals, indicating that previous resistance has turned into support.
🧠 Market Sentiment & Strategy:
Current Sentiment: Moderately Bullish
For short-term traders: Entries on pullbacks near $0.21–$0.22 with targets at $0.298–$0.368.
For swing traders: Hold positions while price remains above the breakout zone; aim for $0.45 or higher.
🔖 Conclusion:
MINA has delivered a powerful breakout from a long-standing downtrend, supported by a successful retest and a solid bullish structure. As long as the breakout holds, there's strong potential for a trend reversal and mid-term upside continuation. However, discipline and risk management remain essential in this volatile crypto environment.
#MINA #MINAUSDT #CryptoBreakout #TrendReversal #TechnicalAnalysis #Altcoins #WedgePattern #BullishBreakout #SwingTrade #CryptoSignals #PriceAction

MINAUSDT: The Ground is ShiftingIn markets filled with noise, clarity comes from listening to the chart's subtle whispers. For MINA, those whispers are growing louder.
Let's look at the evidence. The Orderflow is no longer a one-way street; we are seeing signs of strength returning. At the same time, Volume is starting to build. This isn't a spike of panic or euphoria, but the steady hum of accumulation—a sign of quiet confidence.
When the ground begins to shift, a good trader doesn't jump blindly. They have a plan.
The blue boxes on the chart highlight two logical areas of interest for potential longs.
The upper blue box is the first zone of potential support, an area where buyers may show their hand soon.
The lower blue box represents a deeper foundation of value. An entry here would require more patience but could be built on stronger ground.
The idea is simple: have a plan, watch for the price to enter these areas of interest, and act with discipline. A plan without a pre-defined exit for when you're wrong is just a wish. The goal isn't just profit; it's the peace of mind that comes from trading with a clear map.
The chart is telling a story of a potential turn. Are you prepared to listen?
📌I keep my charts clean and simple because I believe clarity leads to better decisions.
📌My approach is built on years of experience and a solid track record. I don’t claim to know it all but I’m confident in my ability to spot high-probability setups.
📌If you would like to learn how to use the heatmap, cumulative volume delta and volume footprint techniques that I use below to determine very accurate demand regions, you can send me a private message. I help anyone who wants it completely free of charge.
🔑I have a long list of my proven technique below:
🎯 ZENUSDT.P: Patience & Profitability | %230 Reaction from the Sniper Entry
🐶 DOGEUSDT.P: Next Move
🎨 RENDERUSDT.P: Opportunity of the Month
💎 ETHUSDT.P: Where to Retrace
🟢 BNBUSDT.P: Potential Surge
📊 BTC Dominance: Reaction Zone
🌊 WAVESUSDT.P: Demand Zone Potential
🟣 UNIUSDT.P: Long-Term Trade
🔵 XRPUSDT.P: Entry Zones
🔗 LINKUSDT.P: Follow The River
📈 BTCUSDT.P: Two Key Demand Zones
🟩 POLUSDT: Bullish Momentum
🌟 PENDLEUSDT.P: Where Opportunity Meets Precision
🔥 BTCUSDT.P: Liquidation of Highly Leveraged Longs
🌊 SOLUSDT.P: SOL's Dip - Your Opportunity
🐸 1000PEPEUSDT.P: Prime Bounce Zone Unlocked
🚀 ETHUSDT.P: Set to Explode - Don't Miss This Game Changer
🤖 IQUSDT: Smart Plan
⚡️ PONDUSDT: A Trade Not Taken Is Better Than a Losing One
💼 STMXUSDT: 2 Buying Areas
🐢 TURBOUSDT: Buy Zones and Buyer Presence
🌍 ICPUSDT.P: Massive Upside Potential | Check the Trade Update For Seeing Results
🟠 IDEXUSDT: Spot Buy Area | %26 Profit if You Trade with MSB
📌 USUALUSDT: Buyers Are Active + %70 Profit in Total
🌟 FORTHUSDT: Sniper Entry +%26 Reaction
🐳 QKCUSDT: Sniper Entry +%57 Reaction
📊 BTC.D: Retest of Key Area Highly Likely
📊 XNOUSDT %80 Reaction with a Simple Blue Box!
📊 BELUSDT Amazing %120 Reaction!
📊 Simple Red Box, Extraordinary Results
📊 TIAUSDT | Still No Buyers—Maintaining a Bearish Outlook
📊 OGNUSDT | One of Today’s Highest Volume Gainers – +32.44%
📊 TRXUSDT - I Do My Thing Again
📊 FLOKIUSDT - +%100 From Blue Box!
📊 SFP/USDT - Perfect Entry %80 Profit!
📊 AAVEUSDT - WE DID IT AGAIN!
I stopped adding to the list because it's kinda tiring to add 5-10 charts in every move but you can check my profile and see that it goes on..
Disclaimer: This analysis is for informational purposes only and is not financial advice. Trading involves significant risk. Always do your own research.

MINA : Is the shedding over ?Hello friends
Given the heavy fall of this and the prolonged price correction, you can now see that the price is supported within the specified support range, which is a good sign...
We have identified important support areas for you, where you can buy in steps and with risk and capital management.
We have also identified targets.
*Trade safely with us*

SCRUSDT UPDATE
Pattern: Falling Wedge Breakout
Current Price: \$0.268
Target Price: \$0.398
Target % Gain: 50.1%
Technical Analysis: SCR has broken out of a falling wedge pattern on the 12H chart with a clean close above resistance. The breakout is backed by bullish candles and increasing volume, suggesting a potential 50% move upward.
Time Frame: 12H

MINAUSDT 1D AnalysisMINA ~ 1D Analysis
#MINA Maybe you can consider starting to buy back from here with a short term target of at least 10%+ from here and a long term target of $1
SOLUSDT UPDATE
Pattern: Falling Wedge Breakout
Current Price: \$173.38
Target Price: \$300
Target % Gain: 105.90%
Technical Analysis: SOL has broken out of a falling wedge pattern on the daily chart, indicating a bullish reversal. Strong momentum and breakout confirmation suggest a potential move towards the \$300 level.
Time Frame: 1D
Risk Management Tip: Always use proper risk management.

DEXEUSDT UPDATE
Pattern: Bullish Pennant Pattern
Current Price: $14.835
Target Price: $26.61
Target % Gain: 80.18%
Technical Analysis: DEXE has broken out of a descending triangle pattern on the 1D chart. The breakout is supported by a strong bullish candle and sustained price action above the trendline resistance, indicating momentum toward the target.
Time Frame: 1D
Risk Management Tip: Always use proper risk management.

SCRTUSDT UPDATE
SCRT Technical Setup
Pattern: Falling Wedge Breakout
Current Price: $0.2453
Target Price: $0.59
Target % Gain: 160.55%
Technical Analysis: SCRT has broken out of a falling wedge on the 1D chart, indicating a bullish reversal. The breakout is confirmed with strong green candles and volume build-up.
Time Frame: 1D
Risk Management Tip: Always use proper risk management.

KAVAUSDT UPDATEPattern: Falling Wedge Breakout
Current Price: $0.4567
Target Price: $0.74
Target % Gain: 60.53%
Technical Analysis: KAVA has broken out of a long-term falling wedge on the 1D chart, with strong bullish momentum and price closing above the trendline resistance. This breakout signals potential continuation toward the projected target.
Time Frame: 1D

LISTAUSDT UPDATELISTAUSDT Technical Setup
Pattern: Falling Wedge Breakout
Current Price: $0.1893
Target Price: $0.30
Target % Gain: 60.04%
Technical Analysis: LISTA has broken out of a falling wedge pattern on the 12H chart with increasing momentum. Price is holding above the breakout trendline, suggesting bullish continuation. A confirmed breakout with volume could push price to the projected target.
Time Frame: 12H
Risk Management Tip: Always use proper risk management.

MAGICUSDT UPDATE
MAGIC Technical Setup
Pattern: Symmetrical Triangle Breakout
Current Price: $0.2253
Target Price: $0.290,
Target % Gain: 30.06%
Technical Analysis: MAGIC has broken out of a symmetrical triangle on the 4H chart with a strong green candle and volume spike, signaling bullish momentum and a potential 30% upside move.
Time Frame: 4H
Risk Management Tip: Always use proper risk management.

MINAUSDT 1D AnalysisMINA ~ 1D Analysis
#MINA Buy gradually from here if you still have a Conviction on this coin with a short -term target of at least 15%+ from here.

ACEUSDT UPDATEACE/USDT Technical Setup
Pattern: Falling Wedge Breakout
Current Price: $0.635
Target Price: $1.714
Target % Gain: 250.34%
Technical Analysis: ACE has broken out of a long-term falling wedge pattern on the 1D chart with strong bullish momentum. Volume has increased significantly, confirming the breakout with potential for a 250% upside move.
Time Frame: 1D
Risk Management Tip: Always use proper risk management.

DEGOUSDT UPDATEDEGO/USDT Technical Setup
Pattern: Falling Wedge Breakout
Current Price: $1.808
Target Price: $3.70
Target % Gain: 115.05%
Technical Analysis: DEGO broke out of a falling wedge on the 1D chart, showing bullish momentum with a clean candle close above resistance and follow-through volume. Chart suggests potential continuation toward the measured target.
Time Frame: 1D
Risk Management Tip: Always use proper risk management.
