NIFTY 1D Time frame📊 NIFTY 50 Snapshot
Current Price: Approximately 24,991
Change: Up ~0.49% from the previous close
Trend: Fifth consecutive day of gains
🔎 Key Levels
Resistance: Near 25,000 — psychological level and recent high
Support: Around 24,800 — recent low and consolidation zone
📈 Technical Indicators
RSI (14): Approximately 58 — neutral to slightly bullish
MACD: Positive — indicating upward momentum
Moving Averages: Price trading above key moving averages, suggesting a bullish trend
📌 Market Sentiment
Catalysts: Optimism over potential GST cuts and revival of trade talks with the U.S.
Sector Performance: Broad-based gains across sectors, with IT and financials leading
📅 Outlook
Bullish Scenario: Sustained trading above 25,000 could lead to a push toward 25,200–25,300.
Bearish Scenario: A drop below 24,800 may test support around 24,600.
Mircosoft

Microsoft 23/10 MovePair : Microsoft Corp
Description :
Symmetrical Triangle as an Corrective Pattern in Short Time Frame , Rejecting from the Upper Trend Line and Demand Zone. Completed Impulsive Waves and Corrective Waves " abc " , If it Breaks the Lower Trend Line and Retest then it will Short
Entry Precaution :
Wait for the Proper Rejection with Strong Price Action

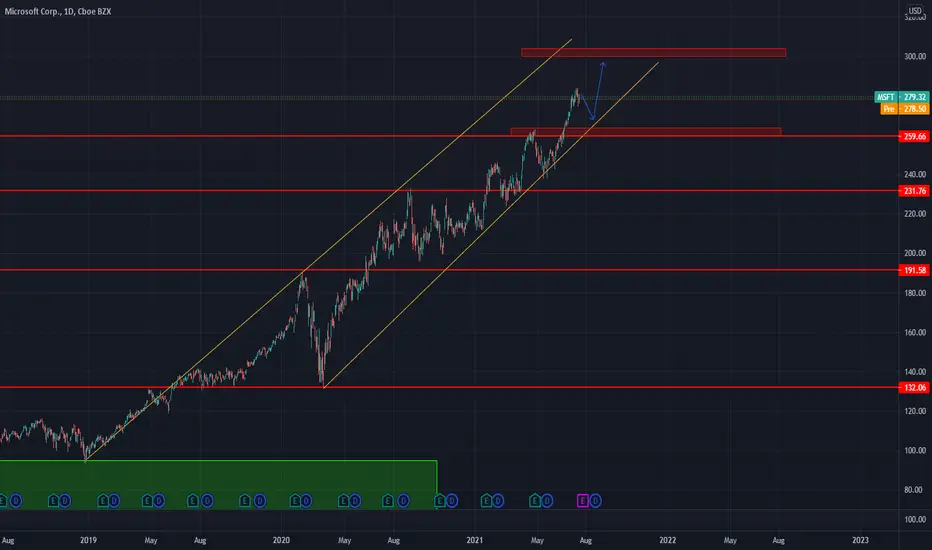
Microsoft Breakout?Often MSFT can lead the market.
If this stock is breaking out of a daily range it will likely help propel the indices and cloud stocks higher.
With the second largest company in the world showing technical strength, one has to sway slightly more bullish.
if this breakout fails than one can lean more bearish. As of now this is a bullish move for MSFT

MSFT - MicrosoftBullish Momentum.
Invest in what you like.
I don't see any bearish signs.
- Share your opinion in the comments below and support the idea.
Thank you for the support.
Structure MSFT(Daily chart)Now: bounce off 50ma, previous structure and 0.618 fib zone
This means potential reversal to the upside.
MSFT is still on an uptrend so buy the dip!
TP) 120.00
SL) 109.00
