Weekly Recap – Gold (Week 34: Aug 18–25)💎MJTrading
📸 Viewing Tip:
🛠️ Some layout elements may shift depending on your screen size.
🔗 View the fixed high-resolution chart here:
📊 Market Overview
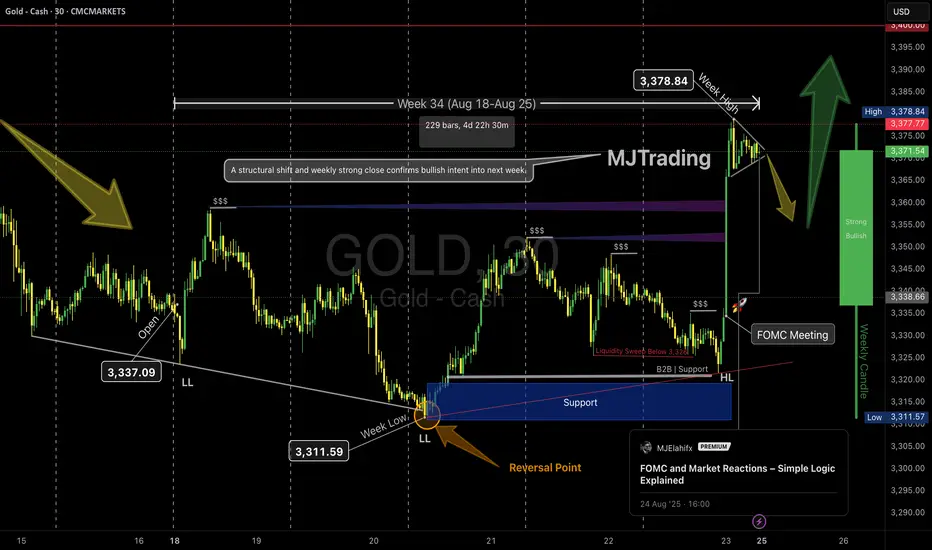
TVC:GOLD started the week under pressure, extending its decline to print a weekly low at 3,311.59. The decline created a lower low (LL) and set the stage for a potential structural shift.
Following the liquidity sweep below 3,326, buyers stepped in strongly, defending the blue support zone. This reversal point became the foundation for the week’s bullish recovery.
🔑 Key Highlights
Liquidity Event: A deep sweep beneath support flushed weak hands before institutional demand entered.
Reversal Point: Marked at the second LL, where aggressive buyers regained control.
Support Zone: Held firmly, leading to a sustained bullish rally.
FOMC Meeting: Served as a catalyst, triggering a breakout above 3,338.66 and confirming bullish intent.
Weekly High: Gold rallied sharply into 3,378.84, breaking structural barriers and leaving behind liquidity zones ($$$).
🟢 Weekly Candle Sentiment
The weekly close was strongly bullish, showing conviction after weeks of mixed momentum. The structural break confirms a shift in market intent. With buyers reclaiming control, sentiment points to further upside potential into next week, provided pullbacks remain above the 3,338–3,345 support band.
🔮 Outlook for Next Week
As long as 3,338 holds, the path of least resistance remains to the upside.
Short-term consolidation above support could lead to a continuation towards 3,390–3,400.
A weekly strong close suggests market participants are positioning for extended bullish momentum.
✅ Summary:
Week 34 showed a clean reversal from liquidity sweep → support defense → bullish breakout. With strong weekly close, the bias for next week is bullish continuation, though traders should watch for minor retracements back to support zones for potential re-entries.
#Gold #Xauusd #Forex #MJTrading
Psychology Always Matters:
Mjtrading
SpotCrude Short Setup - 4h💎MJTrading
📸 Viewing Tip:
🛠️ Some layout elements may shift depending on your screen size.
🔗 View the fixed high-resolution chart here:
🛢️ PEPPERSTONE:SPOTCRUDE Short Setup – Third Tap of Falling Wedge Resistance
Pattern: Falling wedge
Context: Price is testing wedge resistance for the third time, with rejection signs
Bias: Bearish
🟢 Entry Point: 64.5
This aligns with upper boundary of the Falling Wedge (After Rejection).
❌ Stop Loss (SL): 65.5
🎯 Take Profit (TP) Levels
✅ TP1 (RR1) → 63.5
📈 TP2 → 62.5
💰 TP3 → 61.5
🧠 Trade Logic
Price is testing wedge resistance for the third time, with rejection signs
⚠️ Risk Management
Risk:Reward ratio ranges from 1:1 to 1:3, depending on TP level.
Psychology Always Matters:

EUR/USD Sell Setup (6H Chart)💎MJTrading
📸 Viewing Tip:
🛠️ Some layout elements may shift depending on your screen size.
🔗 View the fixed high-resolution chart here:
FX:EURUSD
🔹 Bias: Bearish (continuation within descending channel)
🟢 Entry Point: 1.17100
This aligns with upper boundary of the descending channel.
Confluence with previous Lower High and resistance zone.
❌ Stop Loss (SL): 1.17424
Medium Risk Entry and Stop Loss
Above the channel resistance and recent swing high.
Other option for Stop Loss (Lower Risk): 1.18000 Allows room for minor wicks without invalidating the setup.
🎯 Take Profit (TP) Levels
✅ TP1 (RR1) → 1.16763
📈 TP2 → 1.16438
💰 TP3 - RR4→ 1.15800
💰💰 TP4 - RR10→ 1.13860
🧠 Trade Logic
Price is respecting a descending channel with clear lower highs and lower lows.
The 1.18300 level is a high-probability reversal zone due to technical confluence.
⚠️ Risk Management
Risk:Reward ratio ranges from 1:1 to 1:10, depending on TP level.
Consider scaling out at TP1 and TP2 to lock in profits while leaving a runner for TP3 and ...
Manage your risk wisely ...
#EURUSD #PriceAction #TechnicalAnalysis #Trading #MJTrading
Psychology Always Matters:

EURUSD | Short Setup | Pending Order💎MJTrading
📸 Viewing Tip:
🛠️ Some layout elements may shift depending on your screen size.
🔗 View the fixed high-resolution chart here:
📝 Trade Setup: FX:EURUSD | Short Bias
Price is respecting the descending channel structure, with the recent rally testing the upper boundary near 1.1660.
🟢 Entry Zone: Pending Order: Sell Stop @ 1.16525
❌ Stop Loss (SL): 1.16643 (channel breakout invalidation)
🎯 Take Profit (TP) Levels
✅ TP1 → 1.16407
📈 TP2 → 1.16289
💰 TP3 - RR4→ 1.16050
#EURUSD #PriceAction #TechnicalAnalysis #Trading #MJTrading
Psychology Always Matters:

FOMC and Market Reactions – Simple Logic Explained💎MJTrading:
The Federal Open Market Committee (FOMC) guides U.S. interest rates. Their decisions ripple through all major markets, not just the dollar.
🔑 How It Works (Simple View):
- When the Fed signals higher rates, the USD demand rises (investors seek higher returns), while gold, stocks, and crypto often fall because money becomes “more expensive.”
- When the Fed signals lower rates or slows tightening, the USD loses demand, and money flows into assets like gold, stocks, and crypto.
🔍 Why a Rate Cut Weakens the Dollar:
* Cutting rates means borrowing money becomes cheaper.
* Investors earn less return by holding USD in banks or bonds.
* This lowers demand for the dollar, making it cheaper in global markets.
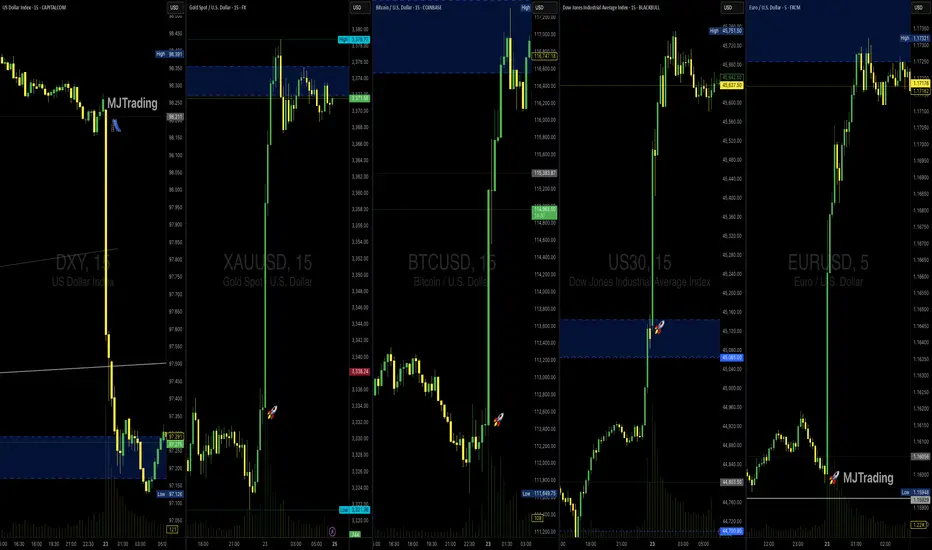
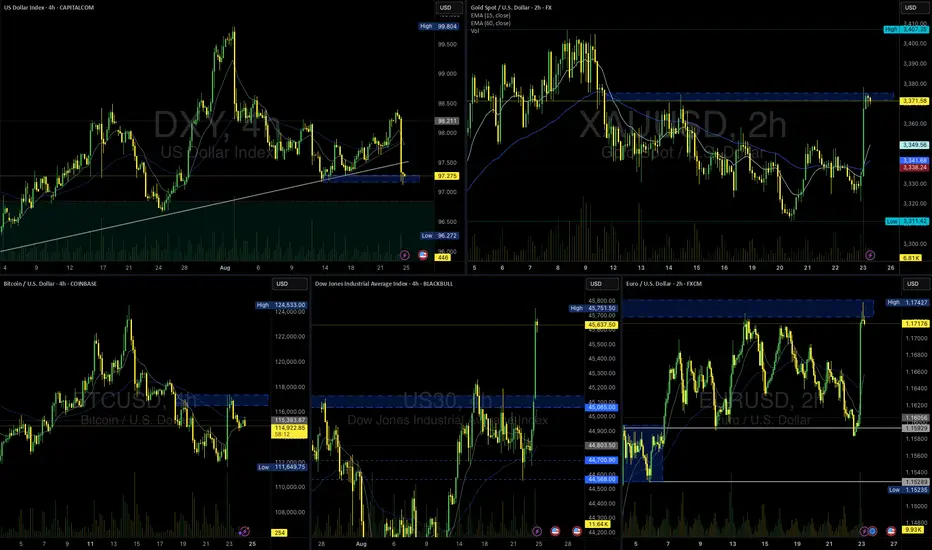
📊 What the Current Charts Show:
CAPITALCOM:DXY (Dollar Index): Sharp drop → less demand for USD.
FX:XAUUSD (Gold): Demand rises as an alternative store of value.
FX:EURUSD : Euro strengthens against weaker dollar.
BINANCE:BTCUSD : Risk appetite returns, lifting crypto.
BLACKBULL:US30 (Dow Jones): Stocks benefit as liquidity shifts from USD into equities.
⚡ The Core Reason – Demand & Supply
Weaker dollar = reduced demand for USD, so supply flows into gold, stocks, euro, and crypto.
🔮 Looking Ahead – Will the Rally Continue?
The rally may extend if the dollar remains under pressure and the Fed stays dovish.
But caution: after the first strong impulse, markets often retrace to test demand zones before continuing.
Next week’s momentum will depend on whether buyers can sustain demand beyond the initial FOMC reaction.
👉 Takeaway for Traders:
FOMC moves aren’t random. They’re driven by where capital finds the best return. Understanding this demand–supply flow helps explain why all charts move together in these moments.
#MJTrading
#FOMC #DXY #XAUUSD #EURUSD #BTCUSD #US30 #Forex #Gold #TradingEducation #Rally
Psychology Always Matters:
FOMC and Market Reactions – Simple Logic Explained💎 MJTrading:
The Federal Open Market Committee (FOMC) guides U.S. interest rates. Their decisions ripple through all major markets, not just the dollar.
🔑 How It Works (Simple View):
- When the Fed signals higher rates, the USD demand rises (investors seek higher returns), while gold, stocks, and crypto often fall because money becomes “more expensive.”
- When the Fed signals lower rates or slows tightening, the USD loses demand, and money flows into assets like gold, stocks, and crypto.
🔍 Why a Rate Cut Weakens the Dollar:
* Cutting rates means borrowing money becomes cheaper.
* Investors earn less return by holding USD in banks or bonds.
* This lowers demand for the dollar, making it cheaper in global markets.
📊 What the Current Charts Show:
DXY (Dollar Index): Sharp drop → less demand for USD.
XAUUSD (Gold): Demand rises as an alternative store of value.
EURUSD: Euro strengthens against weaker dollar.
BTCUSD: Risk appetite returns, lifting crypto.
US30 (Dow Jones): Stocks benefit as liquidity shifts from USD into equities.
⚡ The Core Reason – Demand & Supply
Weaker dollar = reduced demand for USD, so supply flows into gold, stocks, euro, and crypto.
🔮 Looking Ahead – Will the Rally Continue?
The rally may extend if the dollar remains under pressure and the Fed stays dovish.
But caution: after the first strong impulse, markets often retrace to test demand zones before continuing.
Next week’s momentum will depend on whether buyers can sustain demand beyond the initial FOMC reaction.
👉 Takeaway for Traders:
FOMC moves aren’t random. They’re driven by where capital finds the best return. Understanding this demand–supply flow helps explain why all charts move together in these moments.
#MJTrading
#FOMC #DXY #XAUUSD #EURUSD #BTCUSD #US30 #Forex #Gold #TradingEducation #Rally
Psychology Always Matters:
Click on the image to read the caption.
Gold - M30 Buy SetupOANDA:XAUUSD TVC:GOLD
Timeframe: m30
Risk Level: Low-Medium
🔹 Setup:
Price is testing the boundary of the ascending channel and retesting the support @ 3350
📈 Entry:
Current price zone: 3360-65
🎯 Targets (TP):
TP1: 3375
TP2: 3385
TP4: 3410
TP6: 3430
⛔ Stop Loss (SL):
3349
H4 Overview:
PEPPERSTONE:XAUUSD
#XAUUSD #GOLD #Buy #Signal #MJTrading
Psychology Always Matters:

EURUSD | Sell Setup💎MJTrading
FX:EURUSD | Short Bias
🟢 Entry Zone: : Sell @ 1.16071
❌ Stop Loss (SL): 1.16229
🎯 Take Profit (TP) Levels
✅ TP1 → 1.15913
📈 TP2 → 1.15757
💰 TP3 - RR4→ 1.15436
#EURUSD #PriceAction #TechnicalAnalysis #Trading #MJTrading

EURUSD Short Setup - Pending Order💎MJTrading
Single Chart Overview:
FX:EURUSD
| Short Bias
📝 Trade Logic and Setup:
Bearish momentum is accelerating with strong downside pressure. Price has rejected the previous low, turning it into resistance. This breakdown setup seeks continuation into deeper liquidity zones, with tight risk management above the invalidation point (above the CLOSE).
🟢 Entry Zone: Pending Order: Sell Stop @ 1.15930
❌ Stop Loss (SL): 1.16643 (channel breakout invalidation)
🎯 Take Profit (TP) Levels
✅ TP1 → 1.15800
📈 TP2 → 1.15666
💰 TP3 - RR4→ 1.17407
Important Note: This order is time sensitive and has a time limit...If the price moves upward, position won't be activated...
Manage Your Risk Wisely...
#EURUSD #PriceAction #TechnicalAnalysis #Trading #MJTrading
Psychology Always Matters:

GBPUSD Bearish Setup – Rejection at Key Resistance (6H Chart)🧨 OANDA:GBPUSD Bearish Setup – Rejection at Key Resistance (6H Chart)
GBPUSD is showing signs of exhaustion near the 1.36000 resistance zone. A lower high and bearish engulfing candle suggest sellers are stepping in.
🔹 Trade Setup:
Sell Entry: 1.35050
Stop Loss: 1.36000
Take Profit 1: 1.34000
Take Profit 2: 1.33100
Take Profit 3: 1.31500
Risk-reward is favorable, especially if price breaks below 1.33500 with momentum. Watch for confirmation on lower timeframes.
📌 Scaling out at TP1/TP2 is advised. Invalidate the setup if price closes above 1.36000 with strength.
#GBPUSD #ForexTrading #PriceAction #FXSetup #BearishReversal #TradingView #TechnicalAnalysis #SwingTrade #6HChart #ForexStrategy
Psychology Always Matters:

Bitcoin (BTCUSD) | Key Support Retest💎 MJTrading
📸 Viewing Tip:
🛠️ Some layout elements may shift depending on your screen size.
🔗 View the fixed high-resolution chart here:
BINANCE:BTCUSD is retesting a key support zone at 110,000 – 113,000 within its uptrend channel.
👉 As long as support holds, bias remains bullish continuation and could send price toward 117k → 120k → ATH 123,700.
Failure to hold the 112k zone could shift momentum back to sellers, invalidating the higher-low structure.
======================
📝 Trade Setup:
🟢 Entry Zone: 112,000 – 114,000 (support retest / bounce confirmation)
❌ Stop Loss (SL): Below 110,000 (structure invalidation)
🎯 Take Profit (TP) Levels
✅ TP1 → 117,000 (near-term resistance)
📈 TP2 → 120,000 (round level / next resistance)
💰 TP3 → 123,700 (all-time high retest)
======================
#BTC #Bitcoin #Crypto #PriceAction #TechnicalAnalysis #Trading #MJTrading
Psychology Always Matters:

EURUSD | Major Trend Reversal in Play? Bias: Sell Setup🧠MJTrading:
📸 Viewing Tip:
🛠️ Some layout elements may shift depending on your screen size.
🔗 View the fixed high-resolution chart here:
==================================================
📝 Idea: PEPPERSTONE:EURUSD | Major Trend Reversal in Play?
Bias: Bearish (Sell Setup)
📊 Structure Breakdown
- After the 2022–25 High at 1.18300, price has started forming Lower Highs and a Lower Low, hinting at a potential Major Trend Reversal (MTR).
- The Pressure Gap and Pullback rejection around the descending trendline strengthen the bearish outlook.
- Current Price Action suggests sellers are gradually taking control inside the Rising Wedge inside the Descending Channel:
ZOOM IN:
A 2nd leg is also possible.
📌 Trade Setup
Sell Entry: Around current price (~1.16800–1.17000).
Stop Loss: Above 1.18020 (invalidates the setup).
Targets:
TP1 → 1.15520 (mid-channel support).
TP2 → 1.14300 (major support zone - Channel Bottom line).
TP3 → 1.11800 (extension, strong liquidity pool).
Risk–Reward: Attractive multi-level downside with clear invalidation.
For confirmation wait for valid breakdown from the Rising Wedge...
“If the structure speaks to you, let it echo.”
#EURUSD #Forex #FX #Trading #TechnicalAnalysis #PriceAction #SmartMoney #MTR #MAJORTRENDREVERSAL #MarketStructure #TrendReversal #SwingTrading #DayTrading #ChartDesigner #MJTrading
Psychology Always Matters:

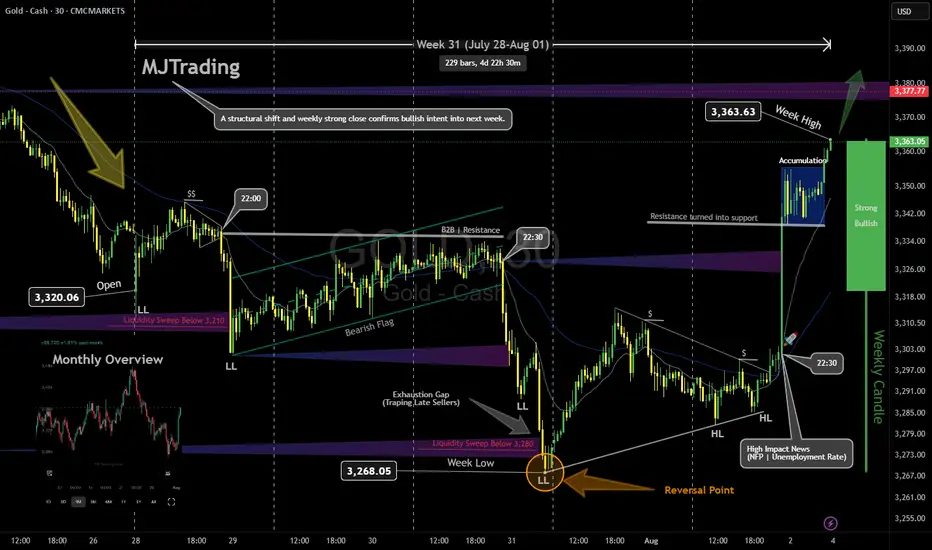
GOLD Weekly Recap & Outlook (Week 31 | July 28 – Aug 01)Note: Some elements may shift depending on your screen size. View the full snapshot in perfect layout:
📈 CAPITALCOM:GOLD
Timeframe: 30m | MJTrading View
⸻
🔹 Weekly Performance
• Open: 3,320.06
• High: 3,363.63
• Low: 3,268.05
• Close: 3,363.05
Gold delivered a classic Smart Money move this week: liquidity sweep, structural shift, and bullish expansion.
⸻
🔹 Price Action Breakdown
1️⃣ Early Week: Bearish Continuation
• Price opened around 3,320 with a gap and extended last week’s bearish leg.
• Formed lower lows (LL) and a bearish flag, signaling continuation.
2️⃣Midweek: Liquidity Grab, Reversal Point and
• Last Bearish leg marks the exhaustion gap and stop run.
• Market printed a liquidity sweep below 3,310 then 3,280 (weekly low), trapping late sellers.
• Smart Money likely absorbed sell-side liquidity before initiating the reversal leg.
• This aligns perfectly with SMC principles: sweep → accumulation → expansion.
3️⃣ Late Week Rally
• Following NFP & Unemployment Rate news, price broke 3,333 and rallied strongly to 3,363.63 confirming a Bullish Market Structure Shift (MSS).
• Resistance turned into support, validating the accumulation phase.
• Price rallied strongly to 3,363.63,.
• The weekly candle flipped bullish, closing near the high, with Smart Money leaving a clear footprint of accumulation and expansion.
⸻
🎯 Key Levels & Outlook
• Support: 3,355 → 3,333 - 3,340
• Resistance: 3,377 → 3,380+
• Bias: Bullish above 3,333.
• Watch for liquidity sweeps of intraday lows to catch new long entries, targeting 3420-3440.
⸻
💡 MJTrading View:
A structural shift and weekly strong close confirms bullish intent into next week.
As long as 3,333 holds, dips are buying opportunities.
⸻
Please share your opinions...
#MJTrading #GoldAnalysis #SmartMoney #LiquiditySweep #PriceAction #MarketStructure #Forex #TradingView #ChartDesigner #BullishMarket
Fortnight Overview:
Psychology Always Matters:
AUD/USD – Potential Bounce Buy SetupOANDA:AUDUSD
Timeframe: 30m
Type: Counter-trend / Bounce from Support
Risk Level: Medium to High
Possible Reward: 4+
🔹 Setup:
Price is testing the lower boundary of the recent support zone (0.6432 – 0.6420), aligning with the previous channel structure visible on the 8h chart. The descending move has shown initial signs of exhaustion, suggesting a potential bounce.
📈 Entry:
Current price zone 0.6432 – 0.6445
🎯 Targets (TP):
TP1: 0.64624
TP2: 0.64797
TP4: 0.65158
⛔ Stop Loss (SL):
0.64250 (below recent swing low and liquidity pool)
8H chart Overview:
Previous Position from top of Channel:
#AUDUSD #Forex #SmartMoney #PriceAction #MJTrading #ChartDesigner
Psychology Always Matters:

BTCUSD – Descending Channel or Bullish Flag?BINANCE:BTCUSDT – Market Maker’s Game Inside a Descending Channel
Timeframe: 2H | MJTrading View
Market Structure Overview:
Bitcoin recently printed a new ATH at $122,000 after a parabolic run from the previous ATH at $111,937.
Since then, price has been consolidating inside a descending channel, which could act as a bullish flag in higher timeframes.
Liquidity pools are clearly formed:
Above $122K – resting stops of late shorts.
Below $115K–$114K – weak long stops and untapped demand near the Order Block (OB).
Key Levels & Liquidity Zones:
Upside:
$122K Liquidity Pool → If swept, could trigger momentum towards $124K–$125K.
Downside:
$116K OB → First defensive zone for bulls.
$112K Strong Support → Aligns with previous ATH breakout base.
Market Maker’s Dilemma:
If you were a market maker… which liquidity pool would you hunt first?
Price is coiling tighter within the channel, and both scenarios are possible:
Upside Sweep → Rapid breakout above $122K to clear shorts, then potential continuation.
Downside Sweep → Sharp drop into $116K–$112K liquidity, flushing longs before any recovery.
⚡ MJTrading Insight:
This is the classic market maker compression – first sweep likely determines direction.
Patience here is key; let the liquidity tell the story.
#BTCUSD #Bitcoin #Liquidity #SmartMoney #PriceAction #MJTrading #ChartDesigner #CryptoAnalysis
Psychology Always Matters:

AUDUSD Engineered to Drop?🧠MJTrading:
📸 Viewing Tip:
🛠️ Some layout elements may shift depending on your screen size.
🔗 View the fixed high-resolution chart here:
🔻 OANDA:AUDUSD – Tagged the Top | Smart Money Eyes Lower Levels??
📍 Perfect Respect of Channel Structure
AUDUSD has just kissed the upper boundary of a long-standing ascending channel, showing sharp rejection — a sign that premium pricing might now shift toward discount levels.
📈 The aggressive push into the highs likely aimed to clear buy stops — fulfilling smart money objectives before a potential reversal.
📉 And here’s the subtle clue:
Just below the last bullish candle lies a thin slide — a structural weakness.
If price breaks and closes below that full body bearish candle (Below 0.66000), the market could slip fast, unleashing a momentum-driven drop into the first liquidity zone (0.6520s).
🧠 For smart money lovers, this is the classic:
Sweep → Trap → Slide
📏 And for fans of parallelism, the chart’s geometry offers a rare beauty — lines in harmony, structure in rhythm, and opportunity in alignment.
🔍 What to Watch For:
Break below 0.66000 (last candle body) = entry signal
0.6520–0.6540: first liquidity zone
0.6400–0.6300: deeper cleanout, if bearish pressure sustains
Inset: DXY bouncing from long-term demand supports bearish thesis
Manage your risk wisely...
For Lower time frame traders:
Psychology Always Matters:
(Click on the pictures for caption and concepts)
#AUDUSD #SmartMoney #LiquiditySweep #ChannelTrading #ChartDesigner #MJTrading #PriceAction #Forex

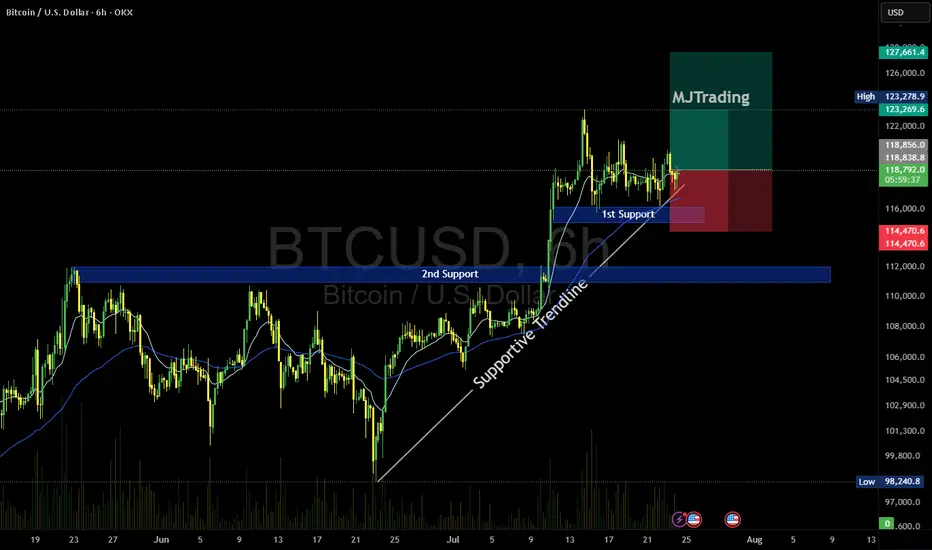
BTC/USD Buy Setup (6H Chart)📈 BTC/USD Buy Setup (6H Chart)
Strategy: Trendline Support Bounce
🔹 Entry
Price: $118,674.3
Reason: Price is bouncing off a supportive trendline and holding above the 1st Support zone.
🔻 Stop Loss (SL)
Price: $114,470.6
Reason: Below the 1st Support zone to protect against breakdown.
🎯 Take Profit Targets
TP1: $123,269.6
Reason: Near recent swing high, good for partial profit.
TP2: $127,661.4
Reason: Next resistance zone, ideal for full exit or trailing stop.
#MJTrading
#Bitcoin
AUD/USD Sell SetupOANDA:AUDUSD
Timeframe: m30
Entry: 0.66151
SL: 0.66266
TP1: 0.66033
TP2: 0.65914
TP4: 0.65681
📊 Setup Rationale
🔺 Channel Top Rejection (8H Overlay) Price has touched the upper boundary of a descending channel visible on the 8-hour chart. This zone has historically acted as a strong resistance, increasing the probability of a reversal.
🧱 Local Structure (30min) Entry aligns with a minor double top (in lower TFs) and bearish momentum. The tight SL allows for a high R:R profile.
🔄 Momentum Shift Watch for bearish engulfing or rejection wick on lower timeframes to confirm entry.
#MJTrading #Forex #AUDUSD #Sell
Psychology always matters:

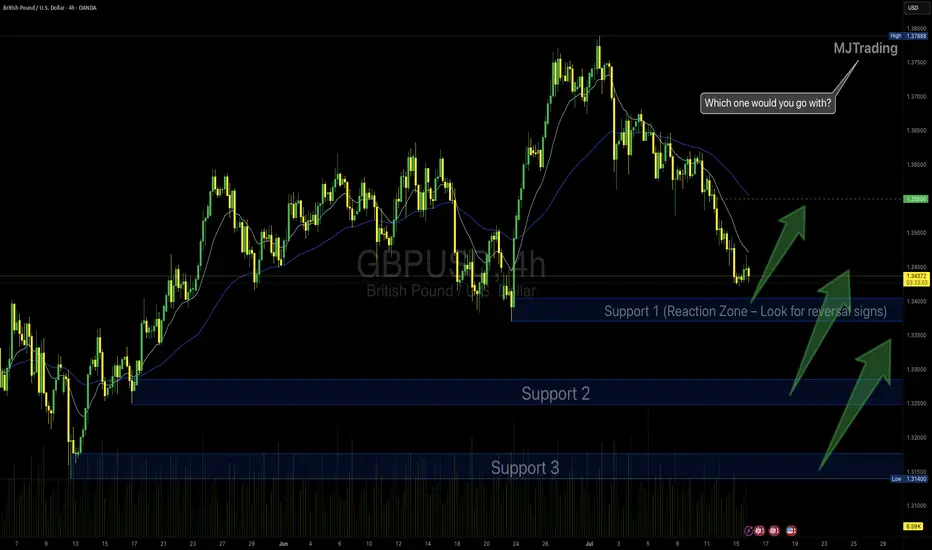
GBPUSD Idea – Demand Zones & Potential Reversal Play🧠 MJTrading:
After a steady downtrend, GBPUSD is now approaching a strong 4H demand zone (Support 1), where we previously saw explosive bullish reactions.
Price is also extended from both EMAs, showing potential for a technical pullback or full reversal.
💡Scenarios to consider:
🔹 If Support 1 holds → we may see a bounce toward 1.3500+
🔹 If broken → Support 2 & 3 offer deeper liquidity and high-probability demand zones
👀 Watch for:
Bullish reversal candles (engulfing / hammer)
Bullish divergence on lower timeframes
Volume spikes on reaction
⚠️ Invalidation:
If Support 3 breaks with strong momentum, we might enter a bearish continuation phase.
#GBPUSD #Forex #ChartDesigner #SmartMoney #PriceAction #MJTrading #ForexSetup #TrendReversal #SupportZones
Gold – Bear-to-Bull Transition in Motion?🧠 MJTrading:
TVC:GOLD – 8H Chart: Bulls, It’s Your Move.
📸 Viewing Tip:
🛠️ Some layout elements may shift depending on your screen size.
🔗 View the fixed high-resolution chart here:
The impulsive move from 3000 to 3500 wasn’t just a trend — it was a statement of strength.
That rally carved the ATH, then left behind weeks of digestion and structural compression.
Now, the market may be setting up for its next decision.
Notice how each bearish leg has been shrinking — a classic behavioral signal that sellers are losing momentum — possibly a shift in control underway.
We’re also pressing above the downtrend line from the ATH (3500), while the uptrend from 3000 remains clean and respected.
We’re now testing the 3400 zone — a key battleground.
📍 If bulls want to reclaim the momentum and show dominance, this is the moment to act.
🔹 1st Support: 3363–3377
🔹 2nd Support: Rising trendline
🎯 Target Zone: 3455–3500+ (Liquidity Pool & ATH proximity)
⚠️ Break back inside the triangle could delay the breakout narrative.
⚠️ If momentum fails to increase from here, and bulls can’t break out with conviction, the market is likely to remain range-bound for longer — extending the sideways phase between 3250–3500.
💭 If you’re watching for a new ATH… stay sharp, stay structured — the market rewards patience and readiness.
“If the structure speaks to you, let it echo, boost it.”
📐 MJTrading 🚀
What do you think?
#GoldAnalysis #XAUUSD #MarketStructure #LiquiditySweep #AnythingCanHappen
#MJTrading
#ChartDesigner
Psychology Always Matters:
Click on them for the caption...

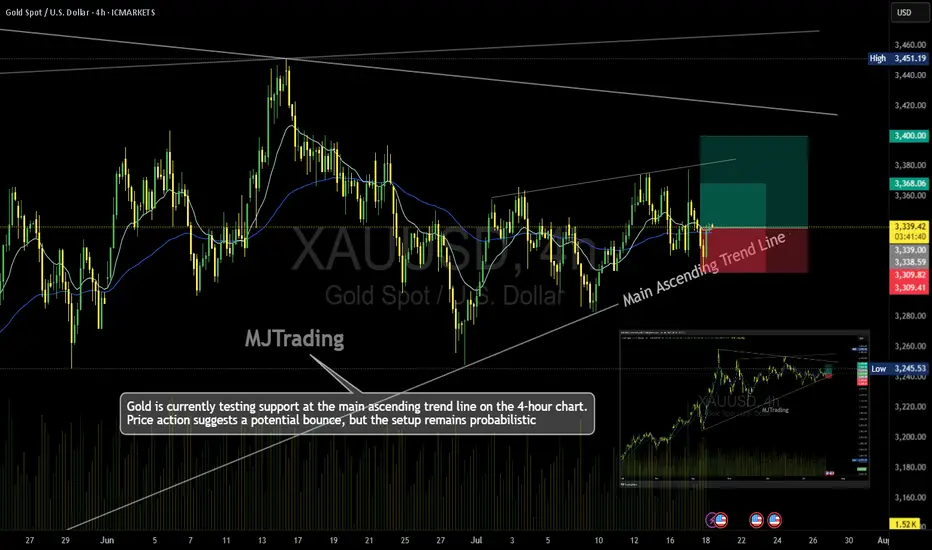
Gold (XAU/USD) – 4H Time Frame Trade Idea📈MJTrading:
Gold is currently testing support at the main ascending trend line on the 4-hour chart. Price action suggests a potential bounce, but the setup remains probabilistic—ideal for traders who operate on higher time frames and manage risk with discipline.
🔹 Trade Setup
Entry: 3340
Stop Loss: 3309
Take Profit 1: 3368
Take Profit 2: 3400
🔍 Technical Context
Price is respecting the long-standing trend line, hinting at bullish continuation.
Risk-reward ratio is favorable, especially for swing traders.
A break below the trend line invalidates the setup—hence the tight SL.
⚠️ Note: While the trend supports upside potential, failure to hold the trend line could trigger deeper retracement. Trade the probabilities, not the certainties.
In case it's not shown properly on your monitor because of different resolutions:
Psychology Always Maters:
#MJTrading #Gold #XAUUSD #Trend #Trendline #Forex #Chart #ChartAnalysis #Buy #Long
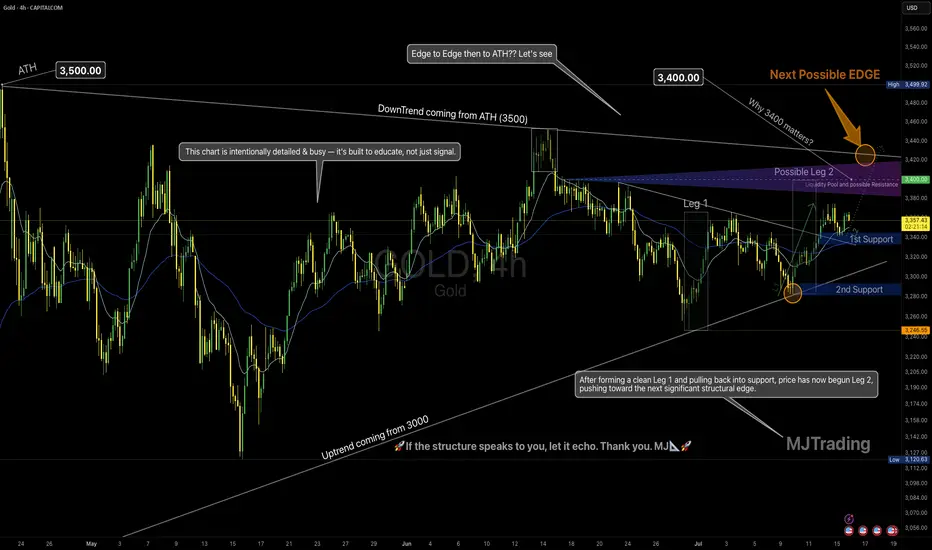
Leg 2 in Progress? | All Eyes on the Possible EDGE around 3400💡 GOLD 4H – MJTrading:
After forming a clean Leg 1 followed by a technical pullback into support, Gold has initiated Leg 2, pushing upward toward the next possible EDGE: 3400.
🟠 Why 3400 Matters
This zone is not just a round number:
It aligns with the long-term downtrend coming from the ATH (3500)
It’s the last reaction high before a deeper correction
There’s likely liquidity resting above — it’s where smart money may make decisions
This is where structure and psychology meet.
And end of 2 possible 2nd leg...
🔄 Possible Scenarios:
🟥 Scenario A – Rejection from the Edge (if could reach):
A reaction from this zone could lead to a pullback toward:
1st Support around 3340-3360
2nd Support near 3250 (also the uptrend line from 3000)
Use these zones to reassess momentum.
🟩 Scenario B – Breakout Above 3400:
A clean break above this structural edge opens the path for:
An “Edge to Edge” move back toward ATH (3500)
Possible higher timeframe trend shift — especially if retest holds
🧠 Our Strategy
We’re long-biased into the edge, not beyond it yet.
Let 3400 show its hand — we stay adaptive, not predictive.
🔍 This chart is intentionally detailed — it's built to educate, not just signal.
Focus on structure, sequence, and behavior — not just levels.
Lets Zoom in around the Breakout area...
And a Zoomout to Daily...
🧭 “If the structure speaks to you, let it echo.”
– MJTrading 🚀
📍#Gold #XAUUSD #TradingView #TechnicalAnalysis #ChartDesigner #MJTrading #MarketStructure #ForexIdeas #Edge
Survive first. Thrive later.🧠 Trading Psychology x Risk Management
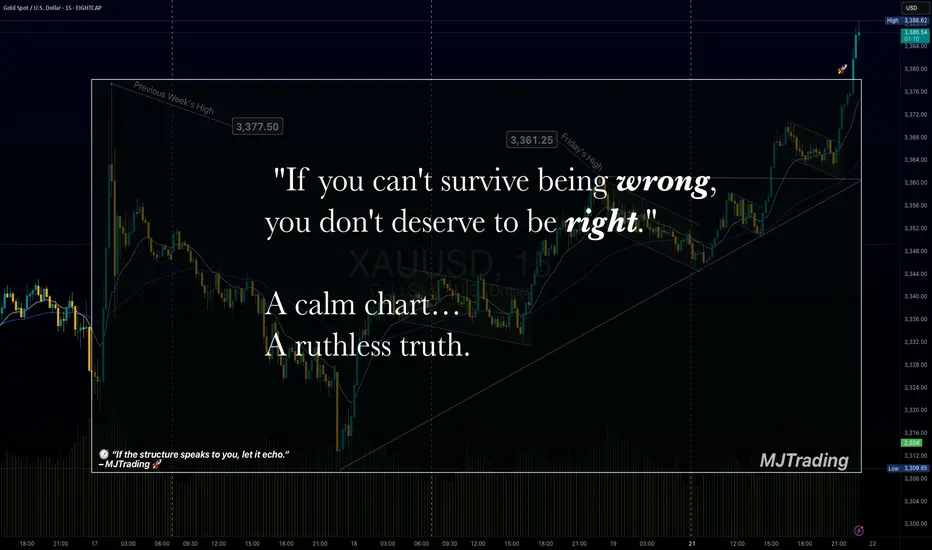
"If you can't survive being wrong, you don't deserve to be right."
💬 A calm chart…
A ruthless truth.
Most traders obsess over being right.
But the market only rewards those who manage being wrong.
Risk control isn’t just technical — it’s emotional.
Survive first. Thrive later.
— MJTrading
Psychology Always Matters:
Click on them for notes in the caption...
#MJTrading #ChartDesigner #TradingPsychology #RiskManagement #MindfulTrading #CapitalPreservation #SmartMoney #XAUUSD #ForexDiscipline #15minChart #GoldAnalysis #MentalEdge #Gold