High Volatility After Sharp SellOff, Market in Rebalancing PhaseMarket Context
Gold has just experienced a sharp and aggressive sell-off on H1, breaking the short-term bullish structure after an extended impulsive rally. This type of move typically reflects liquidity distribution and capital rebalancing, common during periods of heightened macro-driven volatility.
From a macro perspective:
USD volatility remains elevated due to rate expectations and upcoming data
Risk sentiment is unstable, with fast capital rotation
Gold remains a safe-haven asset, but no longer trades in a one-directional flow
➡️ Current phase: high risk – avoid FOMO – trade only at key levels
Structure & Price Action (H1)
Previous bullish H1 structure has been invalidated
Price is trading below the rising trendline → short-term trend weakness
Current rebounds are technical pullbacks, not confirmed reversals
Wide intraday range increases the probability of liquidity sweeps on both sides
Key insight:
👉 This is a transition phase. The market needs time to rebuild structure before committing to a directional move.
Trading Plan – MMF Style
Scenario 1 – Sell the Pullback (Primary Bias)
Look for SELL opportunities on corrective rallies into supply zones.
SELL Zone 1: 5,020 – 5,060
(short-term supply + technical pullback)
SELL Zone 2: 5,180 – 5,240
(major supply + confluence with broken trendline)
➡️ Execute SELLs only after clear rejection or failure to hold structure.
Scenario 2 – Buy at Deep Liquidity Zones
BUY setups are considered only at major demand areas with strong reaction.
BUY Zone 1: 4,670 – 4,650
(H1 demand + prior reaction low)
BUY Zone 2: 4,500 – 4,490
(deep liquidity absorption zone)
➡️ No blind bottom picking
➡️ Wait for clear reversal confirmation before entry
Expectations & Targets
Short term: choppy price action and high volatility
Directional clarity comes only after consolidation
Holding above 5,240 opens room for deeper recovery
Losing 4,500 expands the corrective leg
Invalidation
SELL bias invalidated if price holds firmly above 5,240
BUY bias invalidated if H1 closes decisively below 4,490
Summary
Gold is currently in a high-volatility transition phase, where patience and discipline matter more than frequency. The edge is not trading more, but waiting for price to reach key liquidity zones and react with clarity.
➡️ Trade less, trade smarter
➡️ Structure first, entries second
Mmflowtrading

XAUUSD – H1 Volatility Spike | Liquidity Reset in ProgressMarket Context
Gold is entering a high-volatility phase after an extended bullish run. The recent sharp impulse down from the upper zone is not random — it reflects liquidity distribution and aggressive profit-taking near highs, amplified by fast USD flows and event-driven positioning.
In this environment, Gold is no longer trending smoothly. Instead, it is rotating between liquidity zones, creating two-way risk intraday.
➡️ Key mindset: trade reactions at levels, not direction.
Structure & Price Action (H1)
The prior bullish structure has been temporarily broken by a strong bearish impulse.
Price failed to hold above 5,427 – 5,532, confirming this area as active supply / distribution.
The move down shows range expansion, typical after ATH phases.
Current price action suggests rebalancing and liquidity search, not a confirmed macro reversal yet.
Key read:
👉 Above supply = rejection
👉 Below supply = corrective / bearish bias until proven otherwise
Trading Plan – MMF Style
🔴 Primary Scenario – SELL on Pullback (Volatility Play)
While price remains below key supply, selling reactions is favored.
SELL Zone 1: 5,427 – 5,432
(Former demand → supply flip + trendline rejection)
SELL Zone 2: 5,301 – 5,315
(Mid-range supply / corrective retest)
Targets:
TP1: 5,215
TP2: 5,111
TP3: 5,060
Extension: 4,919 (major liquidity pool)
➡️ Only SELL after clear rejection / bearish confirmation.
➡️ No chasing breakdowns.
🟢 Alternative Scenario – BUY at Deep Liquidity
If price sweeps lower liquidity and shows absorption:
BUY Zone: 4,920 – 4,900
(Major demand + liquidity sweep zone)
Reaction targets:
5,060 → 5,215 → 5,300+
➡️ BUY only if structure stabilizes and bullish reaction appears.
Invalidation
A clean H1 close back above 5,432 invalidates the short-term bearish bias and shifts focus back to bullish continuation.
Summary
Gold is transitioning from trend extension to volatility expansion.
This is a market for discipline and level-based execution, not prediction.
MMF principle:
Volatility = opportunity, but only for those who wait for reaction.
Trade the levels. Control risk. Let price confirm.

XAUUSD – Bullish Structure Holds, Focus on Buy Pullbacks Toward Market Context (M30)
Gold continues to trade in a strong bullish continuation after a clean impulsive leg higher. The recent consolidation above former resistance shows acceptance at higher prices, not exhaustion. This behavior suggests the market is rebalancing liquidity before the next expansion leg.
On the macro side, USD remains under pressure, while safe-haven demand stays firm. Even though bond yields are relatively stable, capital flows continue to favor gold, keeping the upside bias intact.
➡️ Intraday bias: Bullish – trade with the trend, not against it.
Structure & Price Action
• Market structure remains bullish with Higher Highs – Higher Lows
• Previous resistance has flipped into demand and is being respected
• No bearish CHoCH or structural breakdown confirmed
• Current pullbacks are corrective moves within an active uptrend
Key takeaway:
👉 As long as price holds above key demand, pullbacks are opportunities for continuation.
Trading Plan – MMF Style
Primary Scenario – Buy the Pullback
Patience is key. Avoid chasing price into extensions.
• BUY Zone 1: 5,502 – 5,480
(Minor demand + short-term rebalancing zone)
• BUY Zone 2: 5,425 – 5,400
(Trendline support + deeper liquidity zone)
➡️ Only execute BUYs after clear bullish reaction and structure confirmation.
➡️ No FOMO at highs.
Upside Targets
• TP1: 5,601
• TP2: 5,705 (upper Fibonacci extension / expansion target)
Alternative Scenario
If price holds above 5,601 without a meaningful pullback, wait for a break & retest to join the next continuation leg.
Invalidation
A confirmed M30 close below 5,400 would weaken the bullish structure and require reassessment.
Summary
Gold remains in a controlled bullish expansion supported by both structure and macro flow. The edge lies in discipline — buying pullbacks into demand while the trend stays intact, not predicting tops.
➡️ As long as structure holds, higher prices remain the path of least resistance.

GOLD Bullish Continuation Intact Buy Pullbacks Within the TrendMarket Context (M30)
Gold continues to trade within a strong bullish continuation phase, holding firmly inside a well-defined ascending channel. Recent pullbacks are technical retracements for liquidity rebalancing, not signs of distribution or trend exhaustion.
On the macro side, persistent USD weakness, sustained safe-haven demand, and only modest Fed easing expectations keep the broader backdrop supportive for gold. This combination allows upside momentum to remain controlled and constructive rather than emotional.
➡️ Overall bias: Bullish – prioritize BUY setups aligned with the main trend.
Structure & Price Action
M30 structure remains intact with clear Higher Highs and Higher Lows.
Price continues to respect previous demand and key levels, confirming active buyer participation.
No bearish CHoCH has been confirmed.
The current leg is expanding toward higher Fibonacci extensions, reinforcing trend continuation.
Key insight:
👉 As long as structure holds, pullbacks represent opportunity — not risk.
Trading Plan – MMF Style
Primary Scenario – Trend-Following BUY
Focus on patience and execution at discounted levels, not chasing price at extensions.
BUY Zone 1: 5,185 – 5,170
(Short-term demand + channel support)
BUY Zone 2: 5,106 – 5,085
(Key level confluence + trendline support)
➡️ Execute BUYs only after clear bullish reaction and structure confirmation.
➡️ Avoid FOMO at extended highs.
Upside Targets:
TP1: 5,250
TP2: 5,309 (Next ATH extension zone)
Alternative Scenario
If price holds firmly above 5,250 without a meaningful pullback, wait for a break & retest before looking for continuation BUYs.
Invalidation
A confirmed M30 close below 5,044 would weaken the current bullish structure and require reassessment.
Summary
Gold remains in a controlled bullish expansion, driven by structure and macro flow. The edge is not calling the top, but buying pullbacks within demand while the trend remains intact. As long as structure holds, higher prices remain the path of least resistance.

XAUUSD – ATH Extension Confirmed, Buy Pullbacks Into 5,100+Gold continues to trade in a strong ATH expansion phase, not a blow-off move. The latest impulsive rally confirms that buyers remain in control, while pullbacks are being absorbed quickly and efficiently.
On the macro side, USD weakness persists, safe-haven flows remain active, and the market still prices only modest Fed easing — a combination that continues to support gold at elevated levels.
At this stage, ATHs are no longer resistance — they are areas of acceptance.
Structure & Price Action
Bullish structure remains intact with clear Higher Highs – Higher Lows.
No bearish CHoCH has formed despite the sharp upside extension.
Current consolidation near the highs suggests continuation, not exhaustion.
Pullbacks are corrective and aligned with the ascending trendline and demand zones.
Key insight:
ATH is being defended by structure → trend continuation remains the primary bias.
Trading Plan – MMF Style
Primary Scenario – Buy the Pullback
Focus on patience, not chasing price.
BUY Zone 1: 4,984 – 4,970
(Former resistance turned demand + short-term rebalancing)
BUY Zone 2: 4,928 – 4,910
(Trendline confluence + deeper liquidity absorption)
➡️ Only execute BUYs after clear bullish reaction and structure confirmation.
➡️ Avoid FOMO at the highs.
Upside Targets (ATH Extension):
TP1: 5,085
TP2: 5,120+ (extension if momentum sustains)
Alternative Scenario
If price holds above 5,085 without a meaningful pullback, wait for a break & retest before looking for continuation BUYs.
Invalidation
A confirmed H1 close below 4,910 would weaken the current bullish structure and require reassessment.
Summary
Gold remains in a controlled ATH expansion, supported by both structure and macro flow. The edge is not predicting the top, but buying pullbacks into demand while the trend is intact.
As long as structure holds, higher prices remain the path of least resistance.

XAUUSD – Gold Is Repricing, Not Spiking | Weekly OutlookGold is no longer reacting to headlines — it is repricing itself into a higher long-term value zone. The past few sessions have made one thing clear: this move is not emotional, and it is not fragile.
🌍 Macro fuel behind the move
USD weakness remains persistent, with the DXY pressing toward multi-month lows.
Yen-related intervention chatter is adding pressure on the dollar, indirectly accelerating gold demand.
Bond yields remain stable, meaning gold strength is driven by flows, not panic.
The market is pricing only modest Fed easing, keeping real yields supportive for metals.
👉 This is not a “fear spike” — it’s a controlled expansion.
📈 Market structure tells the real story
Higher-timeframe structure remains cleanly bullish with no distribution signals.
New ATHs are forming within structure, not as blow-off tops.
Pullbacks are shallow and aggressively bought → strong absorption below price.
Key insight:
When highs are defended, the trend is healthy.
🎯 MMF Bias for next week
Trade the pullback. Ignore the noise.
The edge is not predicting tops, but aligning with institutional flow.
Demand and IP zones remain the optimal areas to engage.
Chasing price at ATH is optional — buying discounts is mandatory.
🔍 What could change the view?
Only a clear bearish structural shift would invalidate the bullish narrative.
Until then, dips are pauses — not warnings.
🧠 Final thought
Gold is transitioning into a market where:
ATHs stop feeling extreme,
Volatility creates opportunity,
Discipline beats prediction.
Strong trends don’t end quietly — but they also don’t end without warning.
Right now, the warning signs are absent.

XAUUSD – ATH Becomes the New Normal, 5,000$ in SightMarket Context – When ATH Is No Longer a Spike
Gold has entered a phase where every pullback is being aggressively bought, signaling strong institutional acceptance of higher prices. The market is no longer reacting emotionally to new highs — instead, ATHs are forming within structure, not as exhaustion.
With:
Persistent safe-haven demand
A cautious Fed outlook
Ongoing geopolitical and macro uncertainty
➡️ 5,000$ is evolving from a psychological level into a realistic technical target.
Structure & Price Action (H1)
Bullish structure remains intact with Higher Highs and Higher Lows.
Current declines are corrective pullbacks, not reversals — no bearish CHoCH confirmed.
Price continues to respect the ascending channel and demand zones, confirming trend continuation.
Key takeaway:
👉 No distribution signs at the top — ATHs are being defended by structure.
Trading Plan – MMF Style
Primary Scenario – Trend-Following BUY
Focus on buying pullbacks, not chasing ATH:
BUY Zone 1: 4,837 – 4,782 (Demand + trendline confluence)
BUY Zone 2: 4,713 (Deeper IP / demand zone)
➡️ Execute BUYs only after clear bullish reactions.
➡️ Avoid FOMO at extended levels.
Upside Targets (ATH Continuation):
TP1: 4,919
TP2: 5,027 (Extension zone approaching the 5,000$ milestone)
Alternative Scenario
If price holds above 4,919 without a meaningful pullback, wait for a break & retest before looking for continuation BUYs.
Invalidation
H1 close below 4,713 invalidates the bullish structure and requires a full reassessment.
Summary
Gold remains in ATH continuation mode. The optimal strategy is not trying to top-pick, but patiently buying pullbacks in alignment with higher-timeframe flow.
At this stage, 5,000$ is no longer a question of “if” — only “when.”

XAUUSD – Liquidity Build-Up Before the Next ExpansionMarket Context
Gold is currently trading in a range-bound structure after a strong impulsive rally, signaling a liquidity-building phase rather than an immediate trend reversal. Price is compressing between key supply and demand zones, suggesting the market is preparing for its next directional move.
From a macro perspective, risk-sensitive flows and expectations around monetary policy continue to support volatility expansion, making this consolidation phase technically healthy.
Market Structure & Technical View
Price is consolidating above the major demand zone at 4,582 – 4,621, confirming this area as a strong liquidity absorption zone.
The 4,678 – 4,690 zone acts as the current equilibrium and reaction area.
Upside liquidity is clearly resting above 4,742, while downside liquidity sits below 4,582.
No confirmed bearish CHoCH on H1 yet → current pullbacks remain corrective in nature.
Trading Plan – MMF Style
Primary Scenario – BUY on Pullback
Preferred BUY zone: 4,621 – 4,582
→ Confluence of demand, prior impulse base, and liquidity pool.
Upside targets:
TP1: 4,678
TP2: 4,742 (liquidity sweep / extension zone)
→ Focus on price reaction and structure confirmation, not blind entries.
Alternative Scenario – SELL Reaction
If price sweeps above 4,742 and shows clear rejection, a short-term SELL reaction toward 4,678 can be considered.
This is a counter-trend scalp, not a trend reversal setup.
Invalidation
A strong H1 close below 4,582 invalidates the bullish pullback view and opens the door for deeper downside continuation.
Summary
Gold remains in a controlled consolidation phase after an impulsive rally. The priority is to BUY at discounted levels within demand and align with higher-timeframe flow. Patience is key — let the market show its hand at liquidity zones before committing.

Technical Pullback Within Uptrend, Waiting for Discount BUYMarket Context (H1)
After a strong impulsive rally, gold is entering a short-term corrective and liquidity-absorption phase. The current decline is technical in nature, following rejection from the upper resistance zone, and does not signal a trend reversal at this stage.
From a fundamental standpoint, the broader macro backdrop remains supportive for gold, with cautious monetary policy expectations and sustained safe-haven demand. As a result, downside moves are still viewed as corrective pullbacks rather than the start of a bearish trend.
Structure & Price Action
H1 market structure remains bullish as long as key demand lows are not broken.
Price is pulling back from supply and rotating toward lower demand + Fibonacci confluence zones.
No confirmed bearish CHoCH so far → bias remains pullback for continuation.
Upper zones remain valid liquidity targets once bullish momentum resumes.
Trading Plan – MMF Style
Primary Scenario – Trend-Following BUY
Priority is to wait for price to retrace into discounted areas and only BUY after clear bullish reactions and structure protection.
Preferred BUY Zones:
BUY zone 1: 4,600 – 4,580 (short-term demand + balance area)
BUY zone 2: 4,560 – 4,550 (major demand + deep Fibonacci retracement)
Note: Avoid FOMO while price is correcting mid-range.
Upside Targets:
TP1: 4,616
TP2: 4,637
TP3: 4,676 (upper resistance / extension target)
Alternative Scenario
If price fails to pull back deeply and breaks and holds above 4,637, wait for a retest to look for continuation BUY setups in line with the trend.
Invalidation
If an H1 candle closes below 4,550, the short-term bullish structure is invalidated. Stand aside and reassess for a new market structure.
Summary
Gold’s primary bias remains bullish. The current downside move is a corrective pullback following short-term distribution. The MMF approach favors patience and buying at discount zones, trading in alignment with the dominant trend rather than chasing price.

XAUUSD – Pullback Completed, Focus on Buy the DipMarket Context (H1)
After a strong impulsive rally, gold has entered a technical pullback phase and is now showing signs of completing liquidity absorption. The recent decline is corrective in nature and does not indicate a trend reversal.
From a fundamental standpoint, the macro backdrop remains supportive for gold as expectations of a cautious Fed stance persist and safe-haven demand continues. As a result, short-term downside moves are viewed as opportunities to rejoin the primary bullish trend.
Structure & Price Action
H1 structure remains bullish, with key swing lows still intact.
Price has reacted at short-term demand zones, aligned with Fibonacci retracement and prior balance areas.
No confirmed bearish CHoCH so far → bullish continuation remains the preferred view.
Upper resistance zones act as liquidity targets.
Trading Plan – MMF Style
Primary Scenario – Trend-Following BUY
Focus on BUY setups only after price shows clear bullish reactions and structure protection.
Preferred BUY zones:
BUY zone: 4,596 – 4,580 (demand + Fibonacci confluence)
Deeper BUY zone: 4,578 – 4,570 (structure low / strong support)
Note: Enter trades only with confirmation. Avoid FOMO in the middle of the range.
Upside Targets:
TP1: 4,610
TP2: 4,630
TP3: 4,670 (upper resistance / extension area)
Alternative Scenario
If price does not pull back deeply and instead breaks and holds above 4,630, wait for a retest before looking for continuation BUY opportunities.
Invalidation
If an H1 candle closes below 4,570, the short-term bullish structure is invalidated. Pause BUYs and wait for a new structure to form.
Summary
Gold’s primary bias remains bullish. The current pullback is corrective, not a reversal. The MMF approach favors patience and buying at discounted zones, trading in alignment with higher-timeframe flow rather than chasing price.

XAUUSD – Pullback Phase, Waiting for the Next Bullish LegMarket Context (Short-term / H1)
Gold has completed a strong impulsive rally and is now entering a technical pullback phase. This retracement is occurring after price reacted from a key resistance zone near the recent highs, suggesting profit-taking and liquidity rebalancing, not a confirmed trend reversal.
From a fundamental perspective, expectations of a cautious Fed stance and persistent safe-haven demand continue to support gold on dips, keeping the broader bullish bias intact.
Structure & Price Action
Overall structure remains bullish as long as price holds above major demand zones.
The current decline is a corrective move within the uptrend, forming a descending pullback channel.
No bearish CHoCH has been confirmed on H1.
Multiple demand zones below align with trendline support and Fibonacci retracement levels.
Trading Plan – MMF Style
Primary Scenario – Buy the Pullback
Focus on BUY setups only after clear bullish reactions at demand.
Key BUY Zones to Watch:
4,512 – 4,500 (first demand / reaction zone)
4,461 – 4,450 (deeper demand + trendline support)
Wait for confirmation (rejection, structure hold, bullish candle reaction). Avoid FOMO entries at mid-range levels.
Upside Targets:
TP1: 4,580
TP2: 4,612 (previous high / extension zone)
Alternative Scenario
If price fails to react at the first demand and sweeps liquidity into the lower zone, prioritize the lower BUY zone for a higher-probability continuation setup.
Invalidation
An H1 close below 4,450 would weaken the bullish structure and require a full reassessment.
Summary
Gold remains in a bullish environment. The current move is a healthy pullback after an impulsive leg up. The MMF approach is to stay patient, let price retrace into demand, and align BUY positions with the higher-timeframe trend rather than chasing price.

XAUUSD – Strong Breakout, Focus on Buy PullbacksMarket Context (H1)
Gold has delivered a clean breakout above the previous consolidation zone, confirming a return of active buying pressure. This impulsive move signals that buyers are regaining short-term control, while any subsequent pullbacks are likely corrective rather than reversal-driven.
From a fundamental perspective, a cautious Fed stance and ongoing safe-haven demand continue to provide a supportive backdrop for gold, keeping downside moves limited and corrective in nature.
Structure & Price Action
H1 structure has shifted into a bullish continuation phase after breaking above key resistance.
Price remains above major demand zones, with no bearish CHoCH confirmed so far.
Lower zones act as retest and liquidity absorption areas, favoring trend-following BUY setups.
Trading Plan – MMF Style
Primary Scenario – Trend-Following BUY
Preferred BUY zones:
BUY zone 1: 4,538 – 4,510
BUY zone 2: 4,509 – 4,481
Only execute BUYs after clear bullish reactions and structure confirmation. Avoid FOMO at extended levels.
Upside Targets
TP1: 4,580
TP2: 4,602 (upper extension target)
Alternative Scenario
If price fails to pull back and holds firmly above 4,580, wait for a break & retest before looking for continuation BUYs.
Invalidation
If an H1 candle closes below 4,481, invalidate the BUY bias and reassess market structure.
Summary
Short-term bias remains bullish. The optimal strategy is to stay patient and BUY on pullbacks at discounted zones, aligning with higher-timeframe flow rather than chasing price.

XAUUSD – Pullback Only, Trend Not Broken YetGold is not reversing — this is a controlled pullback inside a broader bullish structure.
Price has rejected the upper zone and is now retracing to rebalance liquidity. As long as the key demand below holds, the bullish bias remains intact.
Key Technical View
Market is still respecting the rising structure.
Current drop is corrective, not a confirmed bearish CHoCH.
Strong demand cluster below aligns with trendline + prior imbalance → high reaction area.
Primary Plan – Trend BUY
Focus on BUY opportunities at discounted zones.
Wait for price reaction and structure confirmation — no chasing candles.
Upside Targets
TP1: 4,449
TP2: 4,477
TP3: 4,494
Risk Note
If price fails to hold the demand zone, step aside and reassess — patience > prediction.
➡️ Bias stays bullish until structure says otherwise.

XAUUSD – Bullish Wave Structure Still Intact, Waiting for Wave 4Gold is moving within a clear 5-wave bullish structure, where:
Wave 1 → Wave 3 have already completed with strong impulsive momentum.
Price is currently in the corrective phase of Wave 4, which is technical in nature and not a trend reversal.
Wave 5 to the upside is still expected once downside liquidity absorption is completed.
Key Structure & Technical Context
The H1 trend remains bullish as long as the key swing low below is not broken.
The current pullback is corrective; no bearish CHoCH has been confirmed.
The lower Demand zone aligns with the rising trendline + Fibonacci levels + GAP, creating a high-probability reaction area.
Preferred Trading Plan (MMF Style)
🔵Primary Scenario – Trend-Following BUY
BUY zone: 4,398 – 4,350
This is a strong confluence area (Demand + trendline + GAP).
Only execute buys after clear price reaction and structure holding.
Avoid FOMO entries in the middle of the range.
Targets:
TP1: 4,444
TP2: 4,496
TP3: 4,534
Alternative Scenario:
If price does not pull back to the lower zone and instead breaks and holds above 4,496, wait for a retest to continue buying with the trend.
🔵Invalidation
If an H1 candle closes below 4,350, invalidate the BUY bias and wait for a new structure to form.
🔵Summary: The broader bullish wave structure remains valid. The current decline is a Wave 4 correction, and patience is key to positioning for a potential Wave 5 continuation from discounted levels.

XAUUSD retracing uptrend – Buy the dip at demand zonesMarket Context (Short-Term)
After the previous sharp sell-off, Gold has recovered and moved back into an ascending channel. The current price action suggests a technical rebound and rebalancing phase, not a full trend reversal.
Market structure is forming Higher Lows within the channel, indicating that buyers are still in control of the short-term flow.
Technical Structure & Key Zones
Price is consolidating around the mid-range of the ascending channel.
Pullbacks remain shallow, showing healthy bullish behavior.
Key technical levels on the chart:
Sell / Resistance Zone: 4,461 – 4,465
Pivot Zone: 4,422
Buy Zone 1: 4,393
Buy Zone 2 (GAP / Demand): 4,366 – 4,350
Deep Buy Zone: 4,329
→ The lower Buy zones align with ascending trendline support + demand + price gap, making them high-probability reaction areas.
Trading Plan – MMF Style
Primary Scenario (Trend-Following BUY):
Wait for price to pull back into 4,393 → 4,366.
Look for bullish confirmation (rejection wicks, strong closes, structure holding).
BUY on confirmation.
Targets:
TP1: 4,422
TP2: 4,461
Secondary Scenario (Short-Term SELL):
If price reaches 4,461 – 4,465 and fails to break and hold, a short-term correction may occur.
SELL setups here are counter-trend scalps only, with tight risk management.
Invalidation & Risk Notes
The bullish structure is invalidated if price closes decisively below 4,329.
Avoid FOMO in the middle of the range.
Only execute trades at predefined key zones.
Adjust position size carefully, as the market is still in a technical pullback phase.

XAUUSD Pullback in Uptrend – Buy the Dip at Key Demand ZonesMarket Context (Short-Term)
After the previous sharp sell-off, Gold has recovered and moved back into an ascending channel.
The current price action suggests a technical rebound and rebalancing phase, not a full trend reversal.
Market structure is forming Higher Lows within the channel, indicating that buyers are still in control of the short-term flow.
Technical Structure & Key Zones
Price is consolidating around the mid-range of the ascending channel.
Pullbacks remain shallow, showing healthy bullish behavior.
Key technical levels on the chart:
Sell / Resistance Zone: 4,461 – 4,465
Pivot Zone: 4,422
Buy Zone 1: 4,393
Buy Zone 2 (GAP / Demand): 4,366 – 4,350
Deep Buy Zone: 4,329
→ The lower Buy zones align with ascending trendline support + demand + price gap, making them high-probability reaction areas.
Trading Plan – MMF Style
Primary Scenario (Trend-Following BUY):
Wait for price to pull back into 4,393 → 4,366.
Look for bullish confirmation (rejection wicks, strong closes, structure holding).
BUY on confirmation.
Targets:
TP1: 4,422
TP2: 4,461
Secondary Scenario (Short-Term SELL):
If price reaches 4,461 – 4,465 and fails to break and hold, a short-term correction may occur.
SELL setups here are counter-trend scalps only, with tight risk management.
Invalidation & Risk Notes
The bullish structure is invalidated if price closes decisively below 4,329.
Avoid FOMO in the middle of the range.
Only execute trades at predefined key zones.
Adjust position size carefully, as the market is still in a technical pullback phase.

XAUUSD Pullback in Play – Watch Supply Before Next MoveMarket Context (Short-Term)
Gold has printed a strong bearish impulse, followed by a technical pullback phase. The current upside move is corrective in nature, driven by liquidity rebalancing, not a confirmed trend reversal.
Market Structure & Price Action
Short-term structure remains bearish with lower highs in place.
The ongoing recovery is a pullback within a bearish leg, not a new bullish trend.
No valid bullish break of structure has been confirmed on the intraday timeframe.
Key Technical Zones
Supply / Sell Reaction Zone: 4,401 – 4,462
→ Major distribution area. Expect selling pressure and potential bearish reaction.
Intermediate Resistance: 4,348 – 4,350
→ Current reaction zone where price may consolidate or fake-break before the next move.
Demand / Buy Zones:
4,322 – 4,326
4,285 – 4,290
→ Liquidity-rich demand areas where the pullback may complete.
Primary Scenario (MMF Bias)
Price continues to retrace into the 4,40x supply zone, shows rejection or bearish confirmation, then rotates lower toward the demand zones below.
Alternative Scenario
If price accepts above 4,401 with strong bullish displacement and clean structure, the pullback could extend toward the higher supply near 4,46x.
Flow & Macro Considerations
Early-year liquidity remains thin, increasing the probability of liquidity sweeps on both sides. Patience is required—wait for price reaction at key zones rather than chasing momentum.
Conclusion
Bias remains bearish-to-neutral while below supply. Focus on price reaction at key zones, not direction. Let the market reveal intent.

XAUUSD – Bullish Structure Holds, Buy the PullbackGold remains within a mid-term ascending channel. After a strong bullish impulse, price is currently in a technical rebalancing phase, not a trend reversal.
The recent pullback is viewed as liquidity absorption, preparing for the next expansion.
Structure & Order Flow (MMF / SMC)
Overall market structure stays Higher High – Higher Low.
Price has reacted clearly from the lower Demand / Order Block, confirming buyer presence.
Buy-side liquidity remains above, acting as the next upside magnet.
Key Technical Levels
Primary BUY Zone: 4,485 – 4,490
Secondary BUY Zone: 4,480 – 4,483 (OB + trendline confluence)
Resistance / Target 1: 4,520
Target 2 (Liquidity Zone): 4,560 – 4,590
Trading Scenarios
Primary Scenario:
Wait for price to pull back into BUY zones, look for reaction / minor BOS, then follow the bullish trend.
Alternative Scenario:
If price holds above 4,500 and breaks strongly above 4,520, wait for a retest to continue BUY positions.
Invalidation:
A clear H1 close below 4,480 invalidates the bullish setup and requires reassessment.
Summary
The dominant bias remains bullish continuation.
Best strategy is to buy on pullbacks, stay patient, and avoid chasing price at premium levels.

XAU/USD – Bullish Structure Holds, Focus on Buy the DipMarket Context
Gold remains in a bullish environment, trading within an ascending structure. The recent pullback appears to be a technical retracement after an impulsive move, not a trend reversal.
From a fundamental perspective, expectations of a more accommodative Fed continue to weigh on the USD, keeping gold supported on dips. This backdrop favors trend-following BUY strategies rather than aggressive SELLs.
Technical Structure (H1)
Overall structure remains Higher High – Higher Low
Price is holding above the ascending trendline
No confirmed bearish Break of Structure
Current phase = rebalancing / pullback within uptrend
Key Zones on Chart
OBS BUY Zone: 4,483 – 4,475
Deeper Support: 4,457
Near Resistance: 4,515
Upper Resistance / Target: 4,534
Major Supply: 4,566
Trading Plan – MMF Style
Primary Scenario – Trend Continuation BUY
Wait for price to pull back into the OBS BUY zone (4,483 – 4,475)
Look for bullish reaction / structure hold on lower timeframes
This zone aligns with demand + trend support
Targets
TP1: 4,515
TP2: 4,534
TP3: 4,566 (expect reaction / profit-taking)
Alternative Scenario
If price breaks above 4,534 with acceptance
→ Expect a push toward 4,566, but avoid chasing at premium
Invalidation
A H1 close below 4,457 would weaken the bullish structure and shift bias to neutral.
Summary
Gold remains bullish as long as structure support holds. The priority is to buy pullbacks at key demand zones, manage risk near resistance, and avoid emotional entries at the highs.

XAU/USD – Strong Bullish Expansion, Focus on Pullback BuysMarket Context
Gold has delivered a strong bullish expansion after breaking out of the previous consolidation range. The impulsive move confirms aggressive buy-side participation, suggesting that the market is now in a trend-continuation phase rather than distribution.
From a macro perspective, expectations around a dovish Fed outlook and future rate cuts continue to weaken the USD, providing a supportive environment for gold. This keeps the broader bias tilted to the upside, with pullbacks viewed as opportunities to reload long positions.
Technical Structure (H1 – Short-Term)
Clear Bullish BOS confirmed after range breakout
Price is holding above prior resistance → flipped to support
Current price action shows rebalancing after impulse
No bearish structure break so far
Key Price Zones
Primary BUY Zone:
4,420 – 4,410
(previous resistance + demand + structure base)
Intermediate Support:
4,433 – 4,432
Upside Liquidity / Resistance:
4,466
4,500
4,540 – 4,550 (sell-side reaction zone)
Trading Plan – MMF Framework
Primary Scenario – Buy the Pullback
If price pulls back into 4,420 – 4,410, look for acceptance and bullish reaction
This zone is ideal for trend-following BUY setups
Expect continuation toward higher liquidity levels
Upside objectives:
TP1: 4,466
TP2: 4,500
TP3: 4,540 – 4,550 (possible reaction / partial profit area)
Alternative Scenario
If price does not retrace deeply and holds above 4,432, wait for a break & hold above 4,466, then look for continuation buys on shallow pullbacks
Avoid chasing price directly into the 4,540+ area
Invalidation
A confirmed H1 close below 4,405 would weaken the short-term bullish structure and suggest a deeper corrective phase.
Summary
Gold is in a strong bullish trend after a clean breakout.
Current moves are rebalancing, not reversal.
Bias remains BUY on pullbacks, targeting higher liquidity while respecting reaction zones above.

Liquidity Grab Completed, Waiting for Pullback to ContinueMarket Context
Gold has just completed a strong impulsive rally, sweeping buy-side liquidity above the previous highs. After this expansion, price is now entering a short-term consolidation / pullback phase, which is expected behavior following a liquidity grab rather than a full trend reversal.
From a fundamental perspective, expectations of a more accommodative Fed stance continue to limit downside pressure on Gold, keeping the broader bias supported despite intraday corrections.
Technical Structure (Short-Term)
The larger structure remains bullish
Recent move shows a liquidity grab at the highs, followed by rejection
Current price action suggests rebalancing into demand zones
No confirmed bearish market structure shift so far
Key Technical Zones
Upper Resistance / Sell Reaction: 4,360 – 4,365
Intraday Resistance: 4,333 – 4,336
Buy Zone (Pullback Area): 4,300 – 4,305
Deeper Demand / Liquidity Support: 4,275 – 4,280
Trading Plan – MMF Style
Primary Scenario – Buy the Pullback
Expect price to retrace into 4,300 – 4,305 or deeper toward 4,280
Look for bullish reaction / stabilization to rejoin the trend
Upside targets:
TP1: 4,323
TP2: 4,335
TP3: 4,360+ (liquidity)
Alternative Scenario
If price holds above 4,323 and breaks higher directly, wait for a clean retest before considering continuation setups.
Avoid chasing price at premium levels.
Invalidation
A sustained break and H1 close below 4,275 would weaken the bullish continuation scenario and shift focus to deeper consolidation.
Summary
Gold remains in a bullish environment, with current weakness viewed as a technical pullback after liquidity grab.
Bias remains buy-the-dip, prioritizing patience and confirmation at key demand zones.

XAU/USD – Bullish Structure Holds, Buy Pullbacks for ContinuatioGold remains in a well-defined bullish channel. After a strong impulsive move, price is now undergoing a technical pullback / rebalancing phase, which is normal behavior within a healthy uptrend.
From a fundamental perspective, dovish Fed expectations continue to support Gold, keeping downside moves corrective rather than trend-reversing.
Technical Structure (Short-Term)
Bullish market structure remains intact (Higher High – Higher Low)
Current pullback is occurring within the discount zone of the ascending channel
No confirmed bearish break of structure at this stage
Upside liquidity remains stacked above recent highs
Trading Plan – MMF Style
Primary Scenario – Trend-Following BUY
Preferred BUY zone: 4,303 – 4,320
Condition: price holds above support and maintains HL structure
Targets:
TP1: 4,335
TP2: 4,345
TP3: 4,359 (buy-side liquidity)
Alternative Scenario
If price does not pull back deeply and breaks above 4,335, wait for a clean retest to continue BUY setups.
Invalidation
A H1 close below 4,280 invalidates the short-term bullish bias and cancels BUY setups.
Summary
The short-term bias for Gold remains bullish.
Priority remains buying pullbacks within the channel, avoiding FOMO at premium prices and waiting for price to return to key liquidity zones.

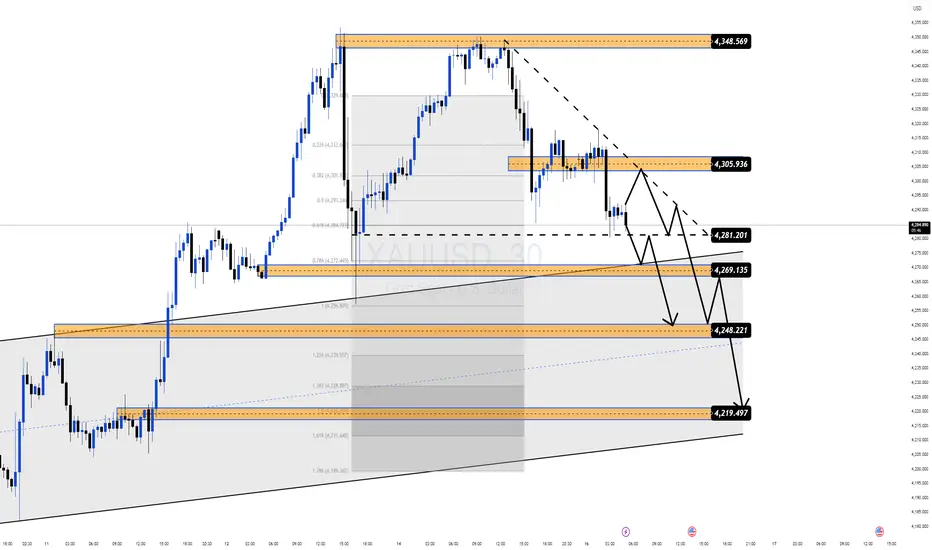
XAU/USD – Distribution at the Top, Sell on Rallies Market ContexAfter a strong bullish impulse, Gold is now showing clear signs of exhaustion near the upper liquidity zone. Price failed to sustain above the recent high and has started to rotate lower, suggesting a distribution phase rather than continuation.
From a macro perspective, although expectations around Fed policy remain mixed, short-term positioning looks crowded on the buy side, increasing the probability of a corrective move to rebalance liquidity.
Technical Structure (M30–H1)
Price rejected sharply from the 4,348 supply / liquidity zone
A lower high has formed under descending trendline resistance
Market is trading below key intraday structure, signaling bearish pressure
Current price action favors a sell-the-rally approach
Trading Plan – MMF Style
Primary Scenario – SELL Continuation
Preferred SELL zone: 4,300 – 4,306
Confirmation: bearish rejection / weak bullish momentum
Targets:
TP1: 4,281
TP2: 4,269
TP3: 4,248
Extended target: 4,219 (major demand + channel support)
Invalidation
A clean break and hold above 4,348 would invalidate the short-term bearish bias.
In that case, stand aside and wait for new structure confirmation.
MMF Perspective
At premium levels, risk favors patience over chasing buys.
The focus now is on capital protection and selling rallies, waiting for price to reach deeper demand zones before considering any new bullish setups.
Bias today: Bearish below 4,348 – Sell rallies, manage risk strictly.