MNQ - Ascending Channel Range Play | FVG Zones Holding
Hey TradingView community! 👋
NASDAQ futures are in classic range mode right now. Let me break down what I'm seeing on the 45-minute chart.
The Setup
MNQ1! is trading at 25,941 inside an ascending channel, currently sitting right in the upper FVG zone around 25,880-25,920. Price has been respecting this channel beautifully - bouncing between the upper and lower boundaries like clockwork.
This is a range-bound market. Until we get a decisive breakout, expect more of the same: test resistance, pull back to FVG, bounce, repeat.
Why I'm Neutral Here
Ascending channel intact - but price is RANGING, not trending
Two FVG zones acting as magnets - price keeps retesting them
S&P 500 at record highs but NASDAQ lagging slightly
Fed pressure headlines creating uncertainty (Powell vs Trump drama)
CPI data Tuesday could be the catalyst for breakout
Bank earnings starting this week (JPM Tuesday)
The News Context
Mixed signals keeping the market choppy:
S&P 500 hit record high Friday - but NASDAQ underperforming
Trump vs Powell drama - DOJ threatening Fed Chair over "renovation" testimony
Credit card rate cap proposal hitting bank stocks hard
Soft jobs data (50K vs 60K expected) - but unemployment dropped to 4.4%
Banks pushing back rate cut expectations after jobs report
Walmart joining Nasdaq-100 on Jan 20 - could bring passive fund flows
CPI report Tuesday - this is the big catalyst to watch
Key Levels I'm Watching
Resistance:
26,000 - Psychological level / upper channel
26,280 - Major resistance (near 52-week high)
26,399 - 52-WEEK HIGH
Support:
25,880-25,920 - Upper FVG zone (current)
25,800-25,860 - Lower FVG zone
25,600 - Channel midline support
25,320 - Lower channel support
My Game Plan
Range scenario (MOST LIKELY): Price continues to oscillate within the ascending channel. Expect retests of the FVG zones. Trade the range - buy at lower FVG, sell at upper channel resistance. This is a scalper's market until we get a breakout.
Bullish scenario: If CPI comes in soft and we break above 26,000 with volume, next target is 26,280, then 26,399 (52-week high). Walmart joining Nasdaq-100 on Jan 20 could bring passive buying.
Bearish scenario: If CPI comes in hot or Fed drama escalates, we could break below 25,600 and test 25,320 lower channel support. Watch bank earnings for sentiment.
The Bottom Line
I'm NEUTRAL here. The channel is intact but we're just ranging. No clear trend until we break out. The FVG zones are acting as support/resistance - trade the range or wait for the breakout.
CPI Tuesday is the key. That's likely the catalyst that decides direction.
What do you think? Breakout or more chop? Let me know in the comments! 👇
Mnq

MNQ: De-Risking Into NFP After Trendline FailureTLDR
Early-year strength → positioning likely crowded
30m trendline loss + failure below weekly VWAP suggests short-term de-risking
Weekly pivot acts as a natural downside reference into NFP
After a strong start to the year, I’m leaning toward short-term de-risking into NFP, not because the trend is broken, but because positioning + timing matters.
On the 30m MNQ:
We’ve lost the rising trendline that guided the recent leg higher.
Price has failed back below weekly VWAP (red), which has acted as dynamic support throughout the move.
That combination suggests momentum cooling, not outright bearish continuation yet.
With NFP approaching, this looks like a risk-off pause rather than aggressive selling. Markets often lighten exposure ahead of high-impact data, especially after early-year gains.
Levels I’m watching:
Acceptance below weekly VWAP keeps pressure on.
A move toward the weekly pivot zone would make sense as a natural de-risking target.
Reclaiming VWAP would invalidate the pullback thesis and reopen upside.
Bias:
Short-term defensive / de-risking into NFP
Bigger-picture trend still intact unless structure continues to deteriorate
Not predicting the number. Just respecting positioning.

MNQ LONGS head and shoulders was pretty obvious today bear flag and trap after trap. We havent quite swept NYSE PM low;s. For a short term scalp im targetting my neckline with a SL of 822.5. forming a possible tripple bottom bear just be cautious you still are in a bear flag but that doesnt mean you can scalp longs for free money within a bearish pattern

New York Open as the Decision PointI remain fundamentally bullish equities, even with the current geopolitical noise.
The sharp downside impulse came late last week and into the first trading day of the year, when liquidity and positioning can be distorted. I’m treating that move as context, not trend confirmation.
After New York Open, the highlighted green area becomes the decision point.
• If that area holds after NY, I’ll look for continuation higher toward the prior SR flip and higher-timeframe resistance.
• If that area fails, I stay patient and allow price to work lower, with next meaningful support near 25,275.
Location provides context. Execution only follows confirmation.

MNQ – NY Open Game Plan Fundamentals stay bullish, but MNQ being MNQ… it already showed its teeth.
Double top printed, neckline broke, and now I’m expecting a sharp pullback, not a meltdown.
MNQ loves to move fast and fake people out, so I’ve got two buy zones and zero interest in guessing:
🟦 Buy Zone 1
First reaction area. If MNQ snaps in and gives me a clean setup, I’ll take the shot.
🟦 Buy Zone 2
Deeper pullback zone. If MNQ overreacts like it always does, I’m ready to try again with confirmation.
This thing doesn’t reward patience… until it suddenly does.
NY open should bring speed, volatility, and probably a few traps ⚠️
I’m waiting for price to hit my zones and show its hand.
Fast market, slow decisions.

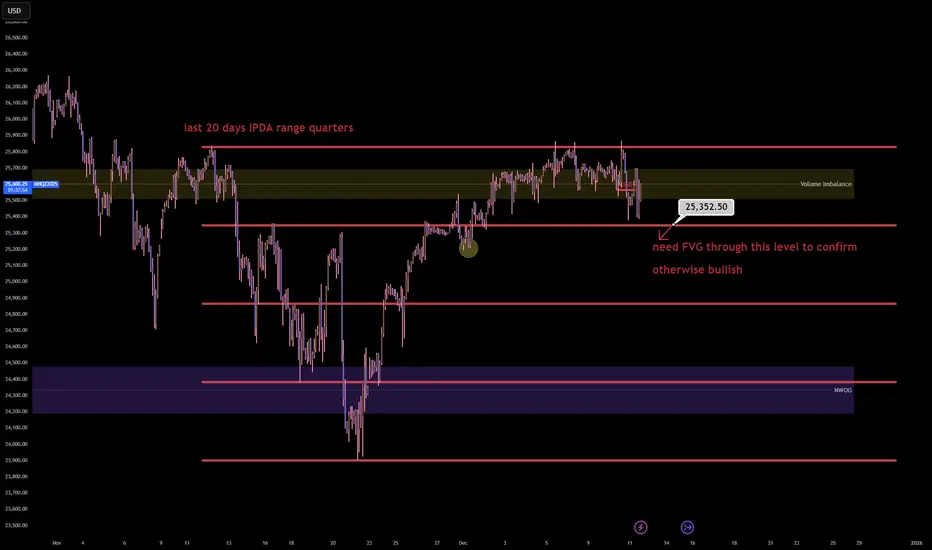
NQ1! (Nasdaq 100) has entered the terminal phaseThe Nasdaq 100 has entered the terminal phase of its 20 day institutional dealing range and is currently executing a distribution program within the premium quartile. The failure to sustain price acceptance above the 25,700.00 Volume Imbalance suggests the algorithm is preparing for a mean reversion event to rebalance the monthly ledger.
The present price action represents a classic 'Bull Trap' at the upper boundary of the range where retail momentum is being absorbed by institutional limit sell orders ahead of a repricing to equilibrium.
Entry: 25,550.00 (Sell Limit)
Stop loss: 25,880.00 (330.00 points)
Take profit: 24,850.00 (700.00 points)
Risk to reward ratio: 2.12R
CME_MINI:NQ1! CME_MINI:MNQ1! IG:NASDAQ
The Opportunity
The 20 day IPDA lookback reveals that price is oscillating within a defined premium distribution block between 25,350.00 and 25,850.00. The market has expended significant energy to reach this valuation but has failed to close the daily candles above the key Volume Imbalance at 25,700.00.
This rejection signature implies that the 'Santa Rally' narrative has been utilized to engineer exit liquidity for smart money positions accumulated at the lows. The algorithm is an efficiency engine and it cannot justify a new macro expansion leg without first revisiting the internal range equilibrium to capitalize the move.
The Entry
Initiating a short position in the 25,550.00 to 25,600.00 zone aligns with the institutional logic of selling the upper 25% of the monthly range. This zone offers the highest statistical edge as it places the entry directly against the 'Ceiling' of the current volatility profile while targeting the 'Floor' of the recent expansion.
The Volume Imbalance acts as a natural defensive barrier for the stop loss as the algorithm will typically respect this array during a distribution phase.
The Invalidation
The bearish causal chain is ontologically corrupted if price achieves a daily close above the 25,880.00 range high. Such an event would signify a 'Blue Sky' breakout and a shift in regime from range bound to trending.
If the market accepts price above this threshold it implies that the premium valuation has become the new floor and the algorithm is targeting the 26,000.00 psychological level.
Key Trajectory Waypoints
Target 1: 25,350.00 | Type: 75% Range Quartile | Probability: 70% | ETA: 24 Hours
Target 2: 24,850.00 | Type: Range Equilibrium (50%) | Probability: 60% | ETA: 2-3 Days
Target 3: 24,400.00 | Type: NWOG / Discount Target | Probability: 40% | ETA: Next Week
The Shadow Reality
A 35% probability exists for the antithetical reality: The Range Expansion.
In this scenario the current consolidation is a 'High Tight Flag' and the algorithm ignores the equilibrium requirement to force a squeeze into the 26,000.00 level immediately.
This reality is confirmed if price holds above 25,650.00 for two consecutive 4 hour closes.
AI Valuation TechnicallyThese are the three largest market-cap listed companies on the Nasdaq.
If we are concerned about an AI bubble, I’m going to show you how I perform a quick glance at some top companies and their index to determine the likelihood of an upcoming short-, mid-, or long-term correction.
In 2017, Microsoft’s P/E reached its highest at 45 — and it continued to rise after that.
In 2023, Nvidia’s P/E reached its highest at 147 — and it continued to rise after that.
In 2024, Apple’s P/E reached its highest at 40 — and it continued to rise after that.
Video version:
Micro E-mini Nasdaq-100 Index
Ticker: MNQ
Minimum fluctuation:
0.25 index points = $0.50
Disclaimer:
• What presented here is not a recommendation, please consult your licensed broker.
• Our mission is to create lateral thinking skills for every investor and trader, knowing when to take a calculated risk with market uncertainty and a bolder risk when opportunity arises.
CME Real-time Market Data help identify trading set-ups in real-time and express my market views. If you have futures in your trading portfolio, you can check out on CME Group data plans available that suit your trading needs tradingview.com/cme/

Monitoring AI Valuation - Precision on Upcoming CorrectionThese are the three largest market-cap listed companies on the Nasdaq.
If we are concerned about an AI bubble, I’m going to show you how I perform a quick glance at some top companies and their index to determine the likelihood of an upcoming short-, mid-, or long-term correction.
In 2017, Microsoft’s P/E reached its highest at 45 — and it continued to rise after that.
In 2023, Nvidia’s P/E reached its highest at 147 — and it continued to rise after that.
In 2024, Apple’s P/E reached its highest at 40 — and it continued to rise after that.
Micro E-mini Nasdaq-100 Index
Ticker: MNQ
Minimum fluctuation:
0.25 index points = $0.50
Disclaimer:
• What presented here is not a recommendation, please consult your licensed broker.
• Our mission is to create lateral thinking skills for every investor and trader, knowing when to take a calculated risk with market uncertainty and a bolder risk when opportunity arises.
CME Real-time Market Data help identify trading set-ups in real-time and express my market views. If you have futures in your trading portfolio, you can check out on CME Group data plans available that suit your trading needs www.tradingview.com

HOW to USE OB After Liq sweept on daily bais CME_MINI:MNQ1!
After we took PDL we Choch on 1H
and 5 min ob appear for more push

Back to ATHs? Inverse Head & Shoulders Imminent!I’m starting to get a strong sense that price won’t fill the new week opening imbalance at 24,336. The Inverse Head & Shoulders pattern I’ve been anticipating all week looks ready to form — and if it does, I believe it’ll propel us right back toward all-time highs.
If price rips through 24,724, this idea becomes invalid, and I’ll reassess the chart for the next trade opportunity.
Lets see how this plays out!

NQ Bias | October 15, 2025NQ perpective after mass liquidity sweep again. Correlation w/ other indices as well.

14 oct push down nasdaqas seen in the video.
we are going short.
dominant force of the day in short.
entry in blue.
stop in red
targets in green
Have fun
Elektra

The NQ dumped to a 4 hour order block created Sept 14th 11pm ESTThe NQ dumped to a 4 hour order block that was created Sunday Sept 14th 11pm EST
Could be coincidence and would make sense to reverse (if it does Monday), but this chart looks TOO Perfect .
Insider Trading at the highest level?
Just looks to perfect to be organic.
I will have my longs in at open, see you at open! : )

Final sell off ahead of FOMC | Head n ShouldersI believe price will stage one final sell-off before resuming its push toward higher highs. On the 4H chart, a potential Head & Shoulders pattern is forming, suggesting price may fill the hourly gap at 24,856 before or during the FOMC release.
The 15-minute chart offers a more precise entry compared to the 1H and 4H timeframes.
I plan to enter within the 25,149–25,150 price range, provided my bias remains valid heading into the New York open.
Lets get it!⚡

8 oct pushing uplooking for a long
entry in blue
target in green
stop in red.
all details are explained in the video.
Have fun
Elektra

7 oct looks short to melooking at the market today.
usa players have shown great strenght to short the markert.
so as seen on the video .
entry in blue 25248
target in 25028
stop in red 25291
have fun
Elektra

Nasdaq to 25,300? | Long Idea 10/3I believe Nasdaq still has room to climb, with the 25,300 range in sight to finish off the week. The price action closely mirrors the pattern from September 5th–9th, 2025, and I wouldn’t be surprised to see history repeat itself here.
I’m planning to go long from the 25,105 imbalance, holding through all-time highs and into the void through 25,300. Once ATHs are broken, I’ll trail my stop closely to lock in profits.

Short Trade Idea for 9/30 | NQI’m anticipating price to either push into the 1H bearish imbalance at 24,894 or reject from the NWOG around the 24,856 range before turning lower toward the 24,640.00 range. My bias is firmly short for now — but I’ll reassess as we approach the open.

A Bullish Friday for NasdaqNow that support has been reached, I’m anticipating Nasdaq to resume its bull run. During the AM session, I’ll be watching for either a double bottom or an inverse head-and-shoulders pattern to form.
On the daily chart, I’m anticipating a rejection from the 24,600 Daily FVG.
It may be too early to confirm, so I’ll revisit and update this idea in the morning.
Lets go Long⚡

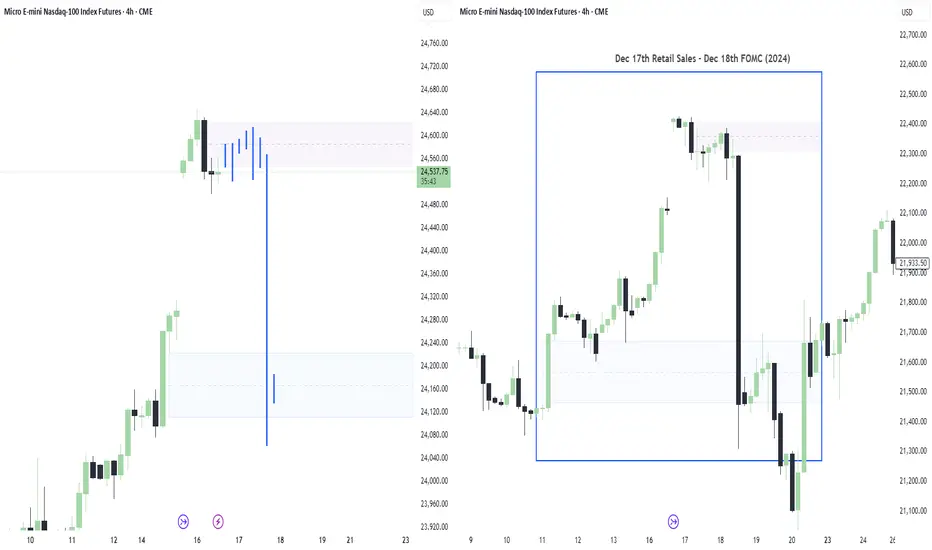
Nasdaq Echoing December FOMC| NQ1 Short SetupAfter spotting the new day opening gap, I immediately analyzed the charts for a comparable All-Time High NDOG scenario. Sure enough, I found nearly identical price action — unfolding on the same days and with the exact same news catalysts.
I’m planning to short from around 24,600.00, with the expectation that 24,200.00 will get taken out.
Let's see how this plays out⚡
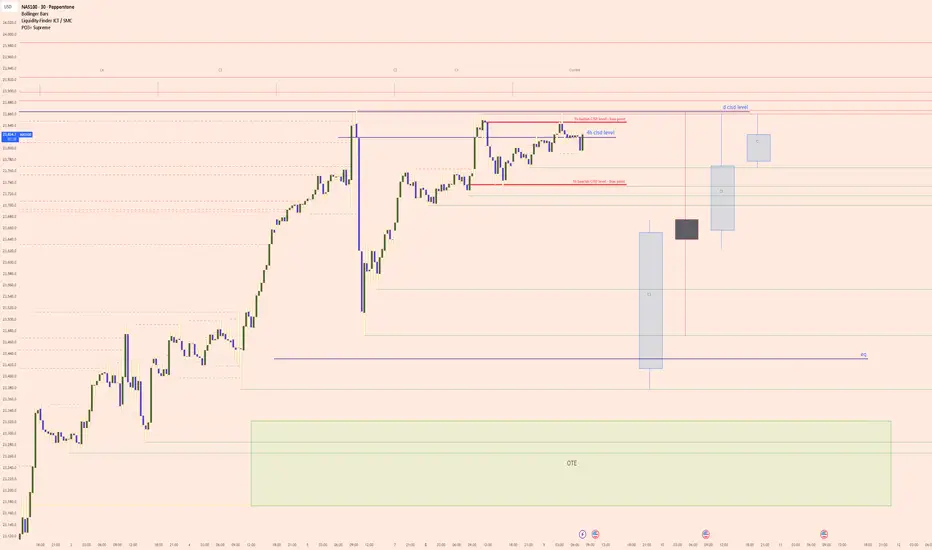
NAS100 (Nasdaq) Key Levels and Probable Draw on LiquidityA clear bullish market structure driven by an aggressive upward displacement.
This energetic move to the upside has created several price inefficiencies, or gaps, which are areas where price delivery was one sided.
Currently, price is consolidating in a premium range, above the equilibrium of the recent impulse leg.
The logical draw on liquidity, or the ultimate target for this bullish momentum, is the distinct old high labeled as the "d cisd level" (Daily change in the state of delivery).
The market is likely reaching for this level to clear out any resting buy side orders.
Before reaching that ultimate target, a retracement is a high probability event.
Price may pull back to rebalance the inefficiency at the "4h cisd level", which should now act as a significant support area.
This would represent a move back into a relative discount, offering a more favorable entry for buyers aiming for the highs.
Should this level fail, a deeper retracement into the larger green zone labeled "OTE" would signify an optimal entry point within the overall bullish leg.
The narrative remains bullish as long as these key lower levels of support are respected.
The alternative path would likely have led to chasing price in a premium, resulting in a poor risk to reward entry. PEPPERSTONE:NAS100 CME_MINI:NQ1! CME_MINI:MNQ1!
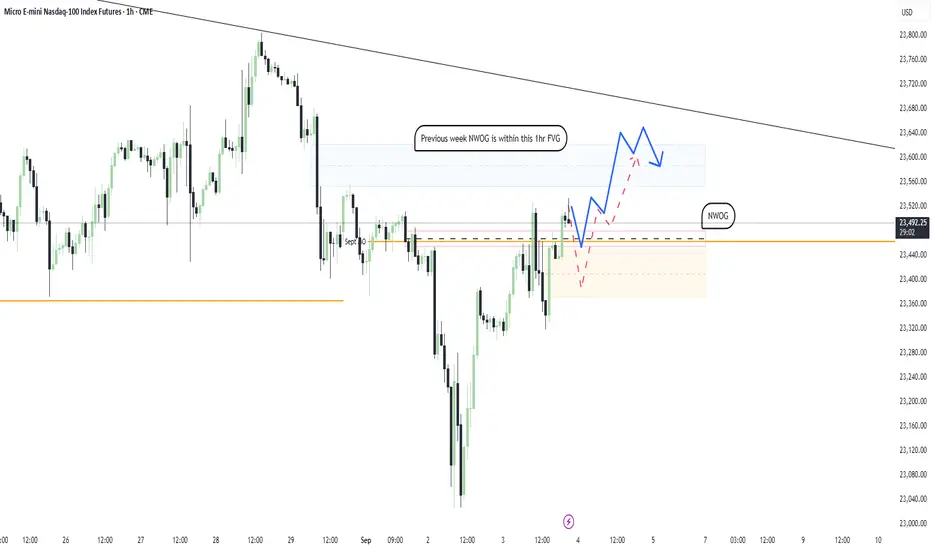
Is Nasdaq still Bullish?I’m still sensing bullish momentum on Nasdaq. My expectation is for price to retrace back into this week’s NWOG before making a push toward last week’s NWOG and the 1-hour gap at 23,583.00. There’s also a possibility we dip to fill the gap at 23,400.00 first, but if that scenario plays out, I don’t see price maintaining its bullish momentum afterward.
On the weekly chart, price continues to strongly respect the Bullish OB formed in the first week of August. As long as this level holds, I expect momentum to carry us higher in the near term.
We'll see tomorrow morning⚡
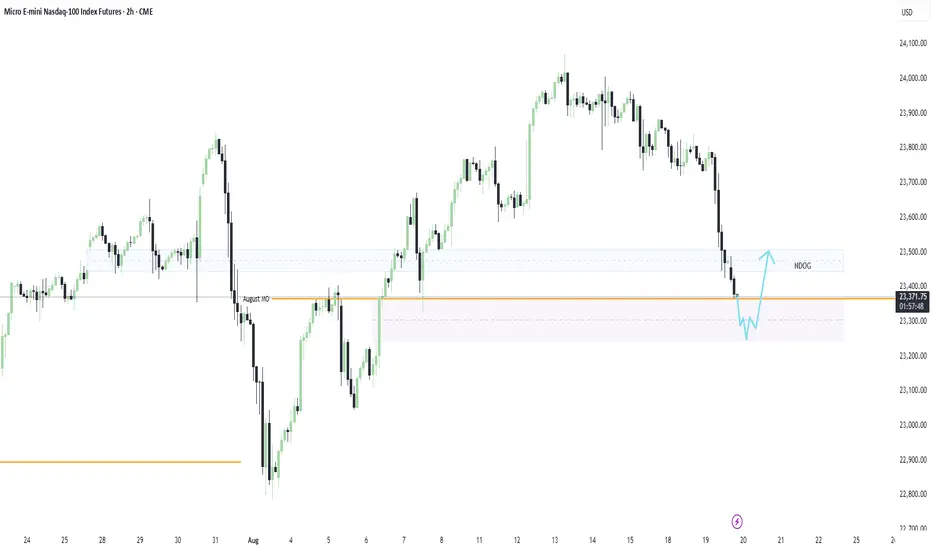
Gap Fill & Reversal Long IdeaI am anticipating a strong move through the August Monthly Open, with price sweeping the lows and targeting the 4H gap at 23,303.50. Once that level is tagged, I’ll be watching for signs of a reversal, ideally an inverse head and shoulders formation to shift bias back to the upside.
My target: a clean push toward the NDOG zone at 23,478.00