1/20 - Pre-Market read and Game plan for the day. 1) Primary plan: Sell the retest (bearish continuation)
Bias stays short while below POI 1 (25,128) and especially below POI 2/PDL area.
A+ entry idea for today:
• Let price pop into POI 2 (25,096.5) or POI 1 (25,128)
• Wait for rejection (lower high, strong red candle, failure to hold above, wick + close back under)
• Targets (scale):
1. POI 3 (25,044.75)
2. POI 4 (25,021.25)
3. POI 5 FVG MID (25,002.5)
4. POI 6 (24,979.25)
• Invalidation: A clean reclaim + hold above POI 1, and especially if it starts accepting above 25,128 (don’t fight that).
Why this is clean: you’re using your POIs like “stairs” — sell at the top stair, take profit at the next stair down.
⸻
2) Secondary plan: Bounce scalp ONLY if a POI holds
If price sweeps into POI 5 / POI 6 and you get a hard rejection + reclaim (fast snap back), that’s your mean reversion scalp.
• Long scalp trigger: reclaim back above the POI you swept (ex: wick under 25,002.5 then closes back above it)
• Targets: back to POI 4 → POI 3 → POI 2
• Rule: if it accepts below the POI you’re trying to long, don’t average down — next stop becomes POI 6 / POI 8 zones.
⸻
3) Flip plan: Only get bullish above POI 1
If price reclaims POI 1 (25,128) and holds (not just wicks), then you can tell members:
• “Okay, bears failed — now we look for pullback longs into POI 1/POI 2 as support.”
• Upside “checkpoints”: 25,311 (NY PM High) then 25,430 (NY AM High / PDH)
⸻
Why you are NOT changing POIs from yesterday
1. POIs are HTF anchors, not feelings.
They’re built off prior session highs/lows, PDH/PDL, and liquidity/FVG zones. Those levels don’t change just because price is noisy.
2. POIs only change after “acceptance” or “mitigation.”
You adjust levels when price fully breaks + accepts (multiple closes through) or when the zone is clearly mitigated (used up and no longer reacting).
3. Consistency = tradable data for the community.
If you move POIs every morning, your members can’t build pattern recognition. Keeping them fixed lets everyone see the same reactions.
4. Your screenshots literally show POIs working.
Price is reacting around POI 1/2 and then stair-stepping lower — that’s exactly what POIs are for.
MNQ1!

MNQ Premarket Plan (POI Map) — 1/15🚨 MNQ Premarket Plan (POI Map) — 1/15
Bias/Context: We’re pressing the 25,870–25,880 decision zone (POI1 / near PDH). This is where trend day continuation OR rejection can start.
📍 Upside POIs (targets)
• POI1 25,871.25
• POI2 25,920.50
• POI3 26,006.00
• POI4 26,083.50
• POI5 26,106.25
📍 Downside POIs (supports)
• 25,738.75 → 25,652.75 → 25,615.50
• then 25,554.50 / 25,538.00
• deeper: 25,502.25 → 25,450.25 → 25,388.00 → 25,357.75 (FVG mid)
• worst case: 25,295.75
✅ Gameplan
Bull case: Hold/reclaim above 25,871–25,879 → push 25,920.50 then 26,006.00. If momentum stays strong, runner toward 26,083.50–26,106.25.
Bear case: Rejection at 25,871/25,920 → break back under 25,738.75 → target 25,652.75 then 25,615.50. If weakness accelerates, look for the next shelves below.
Rules today: First 15m range + POI retests only. No chasing mid-candle. If spreads/volatility spike → size down.

1/14 Recap – POI Breakdown Day (Bear Trend)
POI map did its job today — market gave us a clear bearish continuation and respected levels like stair-steps.
Key Levels (POIs):
26106.25 / 26083.50 / 26006.00 / 25920.50 / 25871.25
25738.75 / 25652.75 / 25615.50 / 25554.50 / 25538.00
25498.75 / 25464.75 / 25425.25 / 25385.50 / 25356.25 (FVG Mid)
Refs: PDH 26046.25 • PDL 25803.25 • NY AM High 26043 • NY AM Low ~25469.5
How it played:
• Bearish pressure stayed in control → breaks below POIs → retests failed → continuation to next POI.
• Best edge was confirmation + retest, not chasing.
Trades (QQQ 0DTE puts):
1. 618P x2 1.58 → 2.37 (+$158)
2. 617P x1 0.91 → 1.36 (+$45)
3. 614P x1 0.58 → 0.87 (+$29)
4. 613P x1 0.27 → 0.01 (-$26) (late/decay lesson)
Stats: 4 trades | 3W/1L | +$206 | 75% WR
Lesson of the day:
✅ Take the first clean continuation and retest failures at POIs.
❌ Avoid midday/late entries unless there’s a fresh A+ setup (decay eats).
Not financial advice — just journaling + execution review.

How I Spot Trading Opportunity – Part IILast week, we discussed how to spot trading opportunities using multiple asset classes. I also created multiple tabs for each asset class, such as currencies, commodities, and indices. Within each asset class, there are multiple products.
The whole idea is this: if you already have a trading methodology that is working well for you in a particular asset, say gold or silver, and you have been trading it for a long time, why not apply the same trading methodology across other markets?
It is not too difficult to pick up trading ideas fairly quickly from the market at any point in time. And I am going to share with you how I do that.
Micro E-mini Nasdaq Futures & Options
Ticker: MNQ
Minimum fluctuation:
0.25 index points = $0.50
Disclaimer:
• What presented here is not a recommendation, please consult your licensed broker.
• Our mission is to create lateral thinking skills for every investor and trader, knowing when to take a calculated risk with market uncertainty and a bolder risk when opportunity arises.
CME Real-time Market Data help identify trading set-ups in real-time and express my market views. If you have futures in your trading portfolio, you can check out on CME Group data plans available that suit your trading needs www.tradingview.com

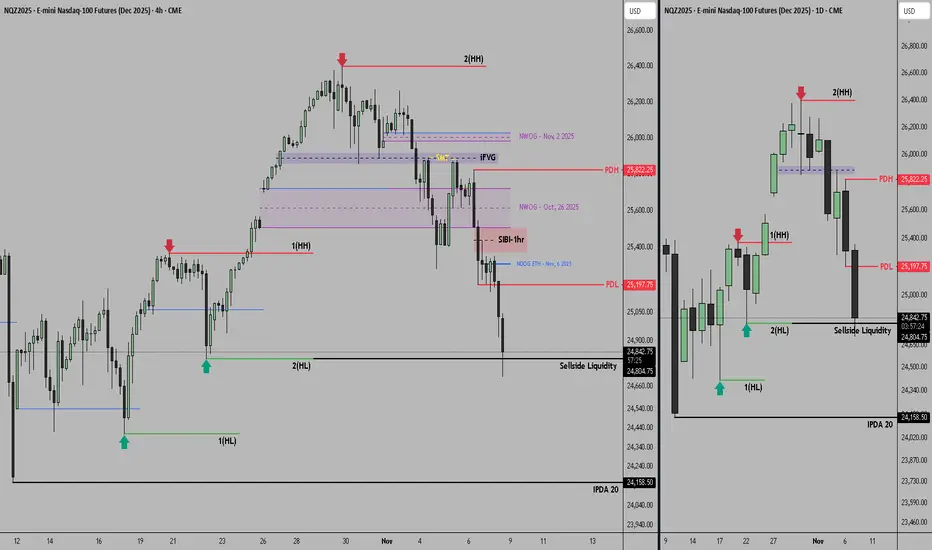
$NQ this week price action as per ICTSEED_ALEXDRAYM_SHORTINTEREST2:NQ this week price action as per ICT
-HTF MMSM (Market maker sell model)
Back to ATHs? Inverse Head & Shoulders Imminent!I’m starting to get a strong sense that price won’t fill the new week opening imbalance at 24,336. The Inverse Head & Shoulders pattern I’ve been anticipating all week looks ready to form — and if it does, I believe it’ll propel us right back toward all-time highs.
If price rips through 24,724, this idea becomes invalid, and I’ll reassess the chart for the next trade opportunity.
Lets see how this plays out!

The NQ dumped to a 4 hour order block created Sept 14th 11pm ESTThe NQ dumped to a 4 hour order block that was created Sunday Sept 14th 11pm EST
Could be coincidence and would make sense to reverse (if it does Monday), but this chart looks TOO Perfect .
Insider Trading at the highest level?
Just looks to perfect to be organic.
I will have my longs in at open, see you at open! : )

Final sell off ahead of FOMC | Head n ShouldersI believe price will stage one final sell-off before resuming its push toward higher highs. On the 4H chart, a potential Head & Shoulders pattern is forming, suggesting price may fill the hourly gap at 24,856 before or during the FOMC release.
The 15-minute chart offers a more precise entry compared to the 1H and 4H timeframes.
I plan to enter within the 25,149–25,150 price range, provided my bias remains valid heading into the New York open.
Lets get it!⚡

MNQ1! Shorts to RTH Range for Monday 10-6-25This is my idea for Monday Oct 6 2025 that MNQ1! can be a bearish day looking for levels 24,980.

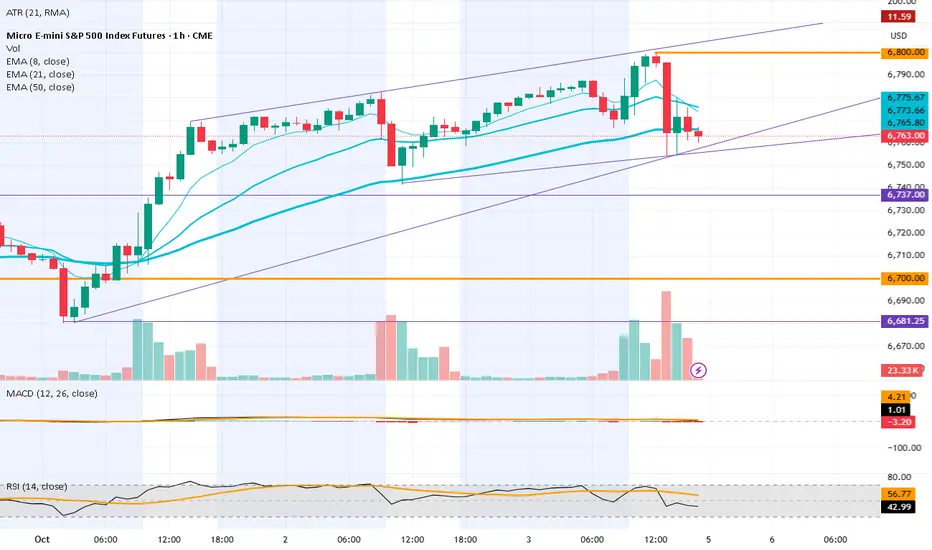
A look at the MES1! (SPX)Chart Time Frame: 1 Hour
Current Price: 6763 after setting recent ATH at 6800
Daily Candle: Top Heavy Doji with open / close entire in the body of previous candle.
📈 Price Action & Technical Analysis
EMA 8 (thin cyan): ~6733 – Above price. Negative Slope.
EMA 21 (med cyan): ~6775 – Above price and EMA 8. Negative Slope. Rotation zone created on 1H and lower TF (EMA 8 crossed EMA 21). Crossover has not happened on higher TF's at time of post.
EMA 50 (thick cyan): ~6765 – Above current price; Flattening out.
Structure: Bullish Trending since April lows.
📈 RSI (14 Close) Current: 43 (57 MA)
Interpretation: Below neutral (50), momentum is weakening.
📈 MACD (12, 26, 9) MACD Line: 1; Signal Line: 4.2; Histogram: -3.2
Interpretation: MACD is growing bearish, histogram showing increasing intensity, yet still above 0.
🎯 Key Levels
Support: various possible trend lines shown (Purple). Price action Monday will determine their validity. Swing low at 6681.
Resistance: Overhead moving averages. ATH at 6800.
🧨 Volatility Outlook
VIX - After a decline, showing signs of inflection. Currently trending upwards on the daily TF.
Government shutdown and headline risk are of some concern to short term price action.
Short Term: A sudden opening of the government could certainly cause a bullish event. I could also imagine certain headlines that would cause a short term bearish event.
Longer term: govt shut downs have typically preceded bullish gains.
📈Macro/Fundamental Analysis
Interpretation: We are in between earnings seasons and with a Gov shutdown, void of Gov Data.
DXY - Pulled back significantly this year. I personally expect it to continue. This could provide a tail wind to equities pricing.
📆 Economic Calendar / Earnings Schedule
Econ Calendar: Relatively Light Next Week
Wednesday - 3PM EST - FOMC Minutes. Dot Plot could cause some action as the minutes are dissected.
Friday - 10AM - Michigan Consumer Sentiment Report. A big miss (up or down) could cause some action.
🔍 Summary
🔻 Trend: Long bull run - might be getting stale; Might just be getting started. You decide.
🧩 Momentum: Very high on longer TFs, Turning down on the lower.
🧠 Tactics:
Short Term - I love a 'rotation zone trade'. If price bounces back up into the EMA 21/8 spread zone, I would be looking for some day trade shorts.
Nasdaq to 25,300? | Long Idea 10/3I believe Nasdaq still has room to climb, with the 25,300 range in sight to finish off the week. The price action closely mirrors the pattern from September 5th–9th, 2025, and I wouldn’t be surprised to see history repeat itself here.
I’m planning to go long from the 25,105 imbalance, holding through all-time highs and into the void through 25,300. Once ATHs are broken, I’ll trail my stop closely to lock in profits.

Short Trade Idea for 9/30 | NQI’m anticipating price to either push into the 1H bearish imbalance at 24,894 or reject from the NWOG around the 24,856 range before turning lower toward the 24,640.00 range. My bias is firmly short for now — but I’ll reassess as we approach the open.

A Bullish Friday for NasdaqNow that support has been reached, I’m anticipating Nasdaq to resume its bull run. During the AM session, I’ll be watching for either a double bottom or an inverse head-and-shoulders pattern to form.
On the daily chart, I’m anticipating a rejection from the 24,600 Daily FVG.
It may be too early to confirm, so I’ll revisit and update this idea in the morning.
Lets go Long⚡

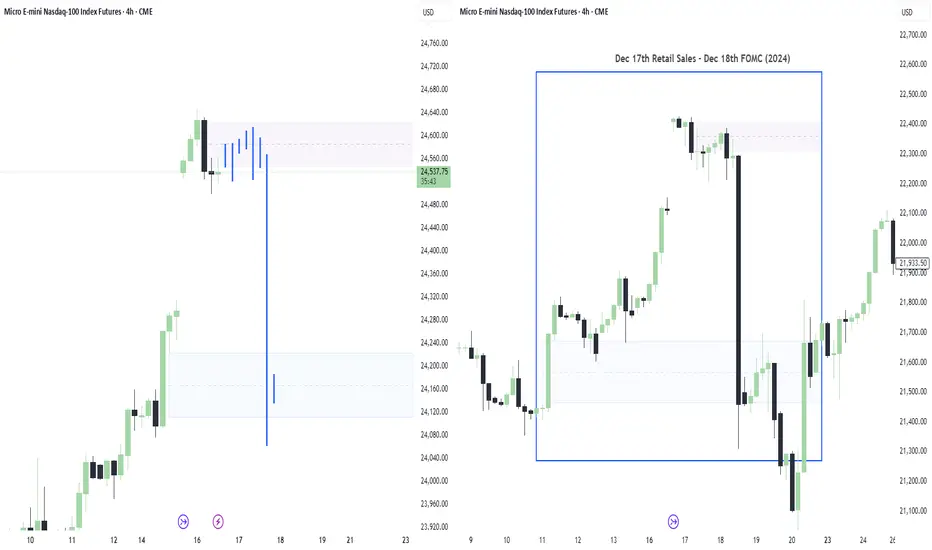
Nasdaq Echoing December FOMC| NQ1 Short SetupAfter spotting the new day opening gap, I immediately analyzed the charts for a comparable All-Time High NDOG scenario. Sure enough, I found nearly identical price action — unfolding on the same days and with the exact same news catalysts.
I’m planning to short from around 24,600.00, with the expectation that 24,200.00 will get taken out.
Let's see how this plays out⚡
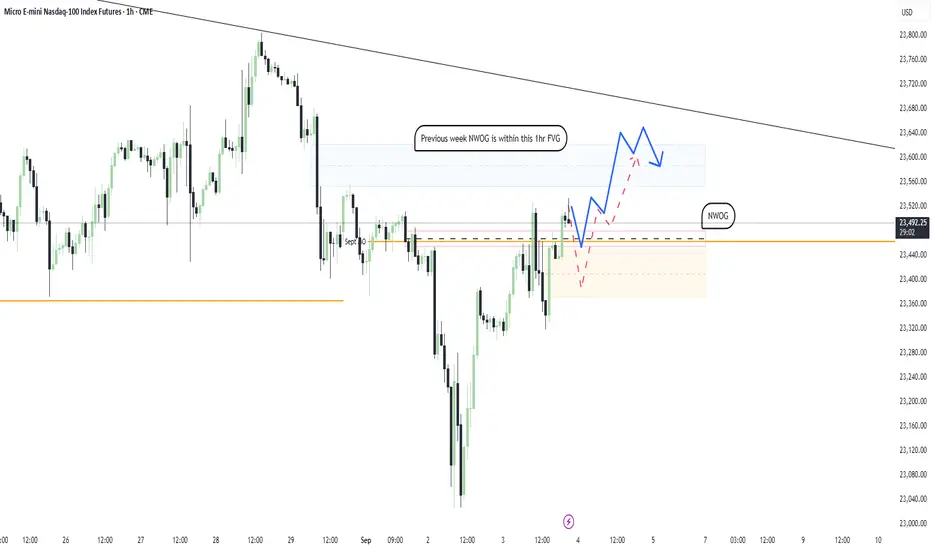
Is Nasdaq still Bullish?I’m still sensing bullish momentum on Nasdaq. My expectation is for price to retrace back into this week’s NWOG before making a push toward last week’s NWOG and the 1-hour gap at 23,583.00. There’s also a possibility we dip to fill the gap at 23,400.00 first, but if that scenario plays out, I don’t see price maintaining its bullish momentum afterward.
On the weekly chart, price continues to strongly respect the Bullish OB formed in the first week of August. As long as this level holds, I expect momentum to carry us higher in the near term.
We'll see tomorrow morning⚡
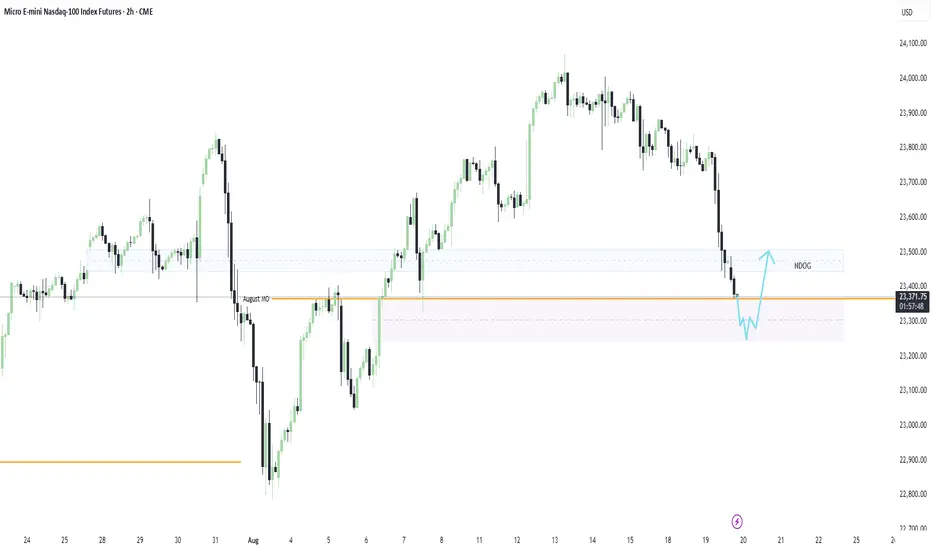
Gap Fill & Reversal Long IdeaI am anticipating a strong move through the August Monthly Open, with price sweeping the lows and targeting the 4H gap at 23,303.50. Once that level is tagged, I’ll be watching for signs of a reversal, ideally an inverse head and shoulders formation to shift bias back to the upside.
My target: a clean push toward the NDOG zone at 23,478.00
Head and Shoulders trade idea ahead of PPI Planning to short from 23,982.25, targeting 23,807.50. If this setup plays out, I expect it to complete overnight—ideally before the PPI release.

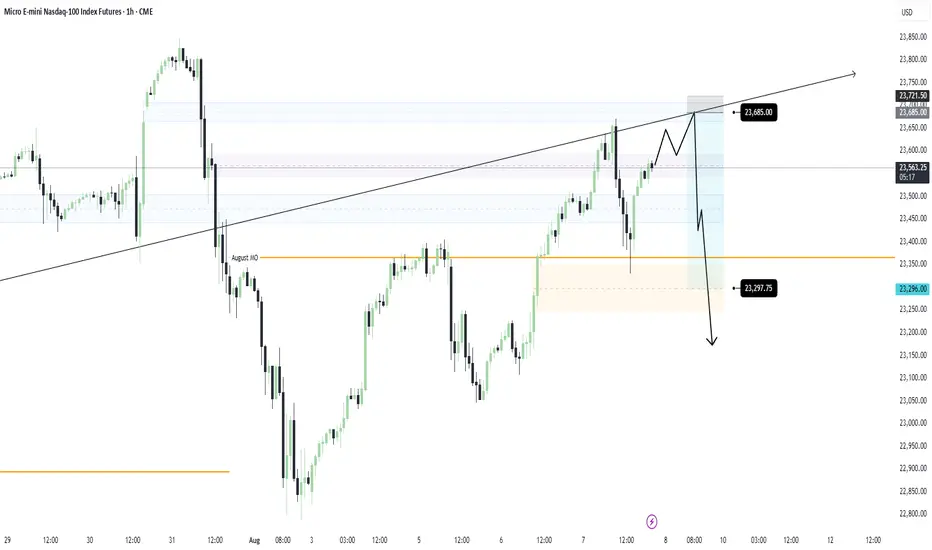
NQ Short Bias: Previous NWOG RejectionI missed today’s sell-off by 60 ticks, but price respected Monthly Open support and retraced back near intraday highs. That reaction reinforces my bias: I’m still anticipating the dump that will likely happen tomorrow.
Ideally, price completes the Double Top within the prior NWOG zone, then falls slightly before or exactly at NY Open for a clean downhill ride.
My entry will be at 23,685.00
Target will be around the low 23,300.00s
I feel like we can definitely fall further than my target, so I will have trailing Stop in place once price reaches my target.
Lets see how this goes⚡
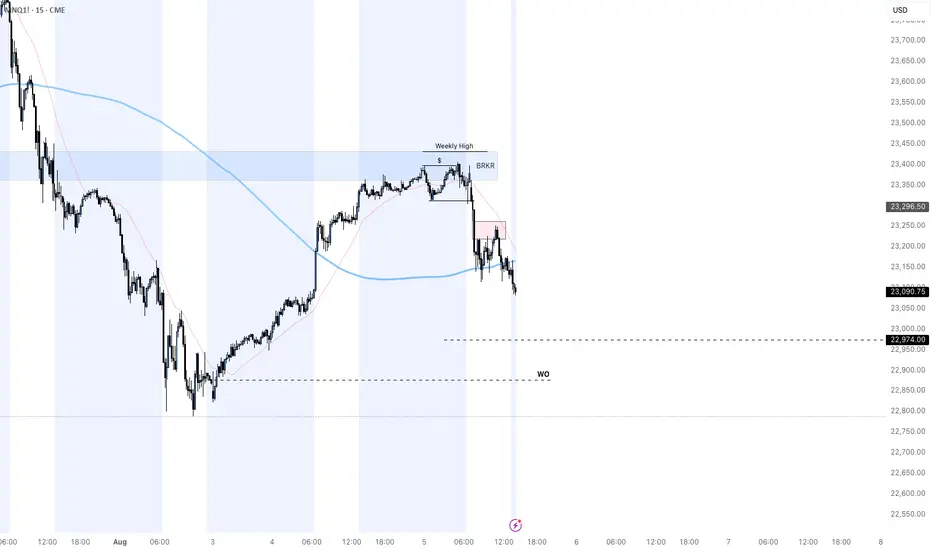
MNQ SHORT POSITION both setups played out **7:15 AM**
CME_MINI:MNQ1!
one thing to note is I have to be in control with my trigger finger I entered a 2nd position for mnq at the end of the moving into the consolidation lost about 40% of my move ending the day at 300$ after being up 437$
Calm Before a StormSince the post-COVID period, we have not seen such a gentle and continuous uptrend. This phenomenon reminds me of the market before the COVID meltdown.
How do I going to interpret this "Gentle & Continuous Uptrend" move?
My answer: Cautiously bullish
Back then, market was cautiously bullish because COVID seemed to be contagious.
It has triggered.
Now, market is cautiously bullish because tariffs appear to be deepening inflation. With slowing job numbers, this is becoming a bigger concern.
Will it trigger?
Mirco Nasdaq Futures and Options
Ticker: MNQ
Minimum fluctuation:
0.25 index points = $0.50
Disclaimer:
• What presented here is not a recommendation, please consult your licensed broker.
• Our mission is to create lateral thinking skills for every investor and trader, knowing when to take a calculated risk with market uncertainty and a bolder risk when opportunity arises.
CME Real-time Market Data help identify trading set-ups in real-time and express my market views. If you have futures in your trading portfolio, you can check out on CME Group data plans available that suit your trading needs www.tradingview.com

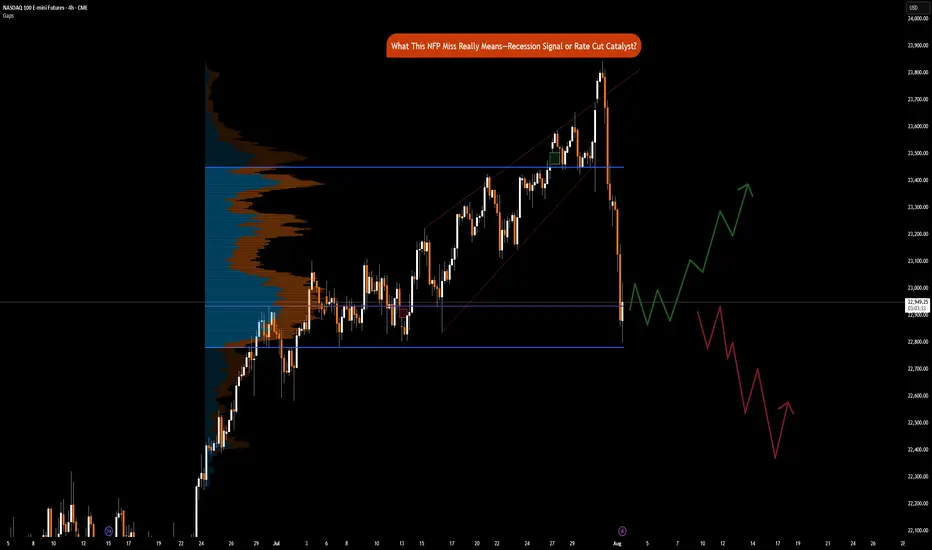
NFP Miss Implications: Recession Signal or Rate Cut CatalystCME_MINI:NQ1! CME_MINI:ES1! CME_MINI:MNQ1!
Happy Friday, folks!
Today is the first Friday of August, and that means the highly anticipated Non-Farm Payroll (NFP) numbers came in at 7.30 am CT.
US Non-Farm Payrolls (Jul) 73.0k vs. Exp. 110.0k (Prev. 147.0k, Rev. 14k); two-month net revisions: -258k (prev. +16k).
Other key labor market indicators were as follows:
• US Unemployment Rate (Jul) 4.2% vs. Exp. 4.2% (Prev. 4.1%)
• US Average Earnings MM (Jul) 0.3% vs. Exp. 0.3% (Prev. 0.2%)
• US Average Earnings YY (Jul) 3.9% vs. Exp. 3.8% (Prev. 3.7%, Rev. 3.8%)
• US Labor Force Particle (Jul) 62.2% (Prev. 62.3%)
Data and Key Events Recap:
What a year this week has been! It's been packed with high-impact economic data and pivotal central bank decisions, especially from the Federal Reserve. On top of that, trade and tariff announcements have dominated the headline.
U.S. economic data this week was broadly strong. Second-quarter GDP came in at 3.0%, beating expectations and signaling solid growth. The ADP employment report also surprised to the upside, printing 104K vs. the 77K forecast. Consumer confidence showed resilience as well, with the Conference Board’s reading rising to 97.2.
Inflation data was mixed but mostly in line. Core PCE for June rose 0.3% MoM, while the YoY reading ticked up to 2.8%, slightly above the expected 2.7%. The broader PCE Price Index also came in at 0.3% MoM, with a YoY print of 2.6%, slightly higher than forecast.
The Federal Open Market Committee (FOMC) voted to keep the federal funds rate target range unchanged at 4.25% – 4.50%. Notably, Governors Waller and Bowman dissented, favoring a 25-basis-point rate cut as expected, however, marking the first dual dissent by governors since 1993.
Changes to the FOMC Statement included a downgraded assessment of economic growth, reflecting slower real consumer spending. The Committee reiterated that uncertainty around the economic outlook remains elevated. It maintained its view of the labor market as "solid" and inflation as "somewhat elevated." Forward guidance remained unchanged, emphasizing the Fed’s readiness to adjust policy as necessary while continuing to monitor risks to both sides of its dual mandate.
Here’s a summary of key points from the FOMC press conference:
• On current policy stance:
“We decided to leave our policy rate where it’s been, which I would characterize as modestly restrictive. Inflation is running a bit above 2%... even excluding tariff effects. The labor market is solid, financial conditions are accommodative, and the economy is not performing as if restrictive policy is holding it back.”
Chair Powell commented on the need to see more data to help inform Fed’s assessment of the balance of risks and appropriate Fed Funds rate.
• On labor market risks:
“By many statistics, the labor market is still in balance... You do see a slowing in job creation, but also a slowing in the supply of workers. That’s why the unemployment rate has remained roughly stable.”
• On inflation and tariffs:
“It’s possible that tariff-related inflationary effects could be short-lived, but they may also prove persistent. We’re seeing substantial tariff revenue—around $30 billion a month—starting to show up in consumer prices. Companies intend to pass it on to consumers, but many may not be able to. We’ll need to watch and learn how this unfolds over time.”
Trade Headlines:
US President Trump announced tariffs on countries ranging from 10%-41%. Average US tariff rate now at 15.2% (prev. 13.3%; 2.3% pre-Trump), according to Bloomberg. US officials said that if the US has a surplus with a country, the tariff rate is 10% and small deficit nations have a 15% tariff, US officials said they are still working out technicalities of rules of origin terms for transshipment and will implement rules of origin details in the coming weeks. No details on Russian oil import penalty. Sectoral Tariffs White House said new reciprocal tariff rates take effect on Friday. Although Canada’s tariffs were increased to 35%, excluding USMCA goods, the effective rate is only 5%.
The economic data is showing strength, on the contrary, tariffs announcements for most countries have now been announced. Investors need to consider that tariffs are not just a tool to reduce trade deficit, it is also a geopolitical tool presently being used to shape alliances. The US wants to soften BRICS, China and Russian influence on the world stage.
Key to note is that these tariffs are substantially lower than what was announced on April 2nd, 2025.
The key question now remains, do participants buy the dip or ‘sell the fact’ is the current playbook?
Market Implications
Given the prior revisions in NFP data of -258K, July’s payroll came in at 73K, missing forecasts of 110K. What does this mean for markets? Markets are now pricing in 75% chance of a September rate cut. Prior revisions along with the current job market slowing down imply that risks to the downside are substantially increasing. Fed’s current policy is not just moderately restrictive but rather it may likely tip the US into a recession if Fed Funds rates remain elevated. The Chair asked to see more data, and here it is but I do wonder why they did not take this data into account for the July meeting. Surely, it would have been available to them.
Another question to ask would be, is it due to defiance of rate cut calls by the US administration? Is the Fed already behind the curve?
Fed’s dual mandate targets inflation and maximum employment. While inflation is sticky, the Fed may need to abandon their 2% mandate in favor of average inflation of 2.5% to 3%. A less restrictive policy will provide needed stimulus along with the fiscal stimulus provided via the BBB bill.
This drastically changes, in our analysis, how investors position themselves heading into the remainder of the year.
Markets (equities) may retrace slightly but the dip in our opinion will still be the play given weaker labor market data and increased rate cut bets. The bad news here means that the Fed has the data it wants to see to start cutting. Market pricing in 2 cuts seems to be the way forward for now.
MNQ Short @robby.tradez price looking to fill imbalance from yesterdays late New York session
- what inspired the trade?
I run a checklist of confluences when trading this asset, it is either I compare it with CME_MINI:MES1! or DXY
as of now MNQ is below my daily open so it lets me know sellers are in control as well as using the volume profile gives me more confirmation, also pairing it with DXY then we have more reason why I took the trade \\
RR 1:4 I generally aim for 4% on a trade like this because it passes as a high probability trade A SETUP

Tuesday Long Trade for the NASDAQ 7/29I'm feeling ultra bullish on NQ right now. Ideally, I want to see price carve out an inverse head and shoulders or a double bottom—either could serve as a springboard to new highs. I took two longs this morning and captured solid gains off the weekly opening gap. Would love to see one final wick into that zone before we blast off.
Long Entry:23,476.75
Target: Break of the Highs | Trailing SL
Today's trades:
