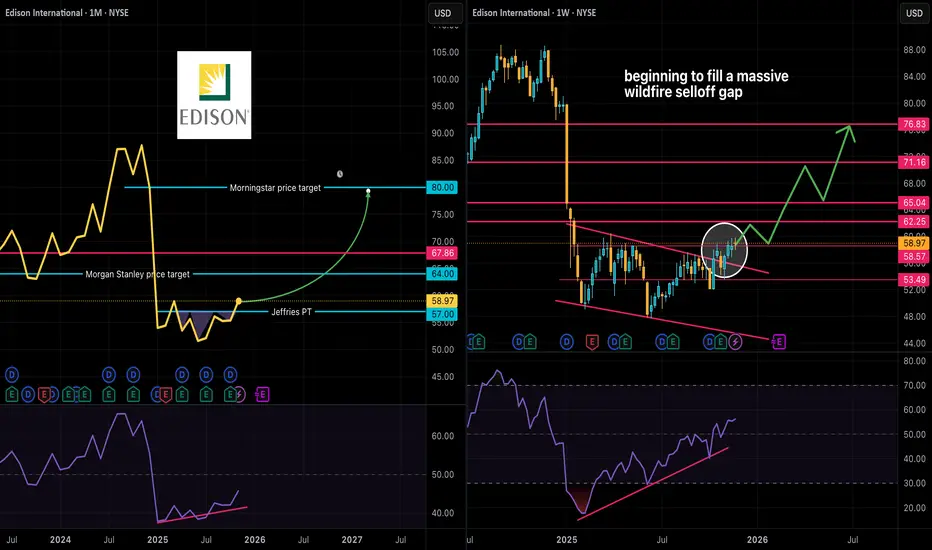
EIX -- Powering the AI Surge: Why Edison Is the Utility to WatchEdison International (NYSE: NYSE:EIX ) finds itself in a compelling position heading into the next wave of energy demand — and the decline in its stock price amid wildfire concerns may present a window of opportunity.
Why it’s discounted
The company’s subsidiary Southern California Edison (SCE) pulls power for roughly 15 million customers across California and has faced elevated wildfire risk, including the major January 2025 fires around Los Angeles. These events brought increased scrutiny, higher operating costs and legal exposure.
Why it’s potentially undervalued
Despite these headwinds, Edison has a resilient regulatory and operating foundation. Its 2024 annual report shows core earnings rising and a strong rate-base growth outlook.
Analysts at Seeking Alpha argue that the market may be overestimating the wildfire liability risk and underestimating Edison’s stable earnings power. PG&E was found culpable within a month of the wildfires that lead to its bankruptcy, but 11 months later Edison still has not been found culpable for the 2025 LA fires.
Technicals
The wildfire scare resulted in a wicked drawdown. That seems to have found a bottom, and lately NYSE:EIX shares have demonstrated strength; on top of that strength sits a healthy dividend. If current resistance is taken out, and an unseasonably moist California holds wildfire fears at bay, thirsty AI data centers may push NYSE:EIX shares into the lower $70s.
Momentumdivergence
Crypto might still have gas in the tankAn equal-weight basket of popular cryptos is forming a descending wedge (bullish) on the 4 hour chart.
There's also a very mild uptick in momentum.
I wouldn't take excessive risk here, potentially add on dips to cryptos you have strong conviction on, and don't be surprised if we really are at the end of the cycle.

DXY 7mo rounding bottom -- more gains likelyEarly 2025 saw a nasty TVC:DXY drawdown; one of the worst starts for the Dollar against foreign currencies in decades.
Despite bearish calls for the Dollar to drop significantly further it's been consolidating at the bottom of a long standing 19 year upward trend channel.
On the daily chart featured above, there's now a clear rounding bottom on TVC:DXY over the past 7+ months, with a clear, sharp uptrend in momentum right along the way.
The risk is to the upside imo.

End of crypto cycle or healthy correction?Has the crypto cycle ended? If so that means no alt-season for sure.
Consider:
Bitcoin's 4 year cycle
The 4 year CRYPTOCAP:BTC cycle is well documented by now, and something X pundits are hanging their hats on, claiming the top is in.
Institutions are investing
The likes of Harvard, with an endowment now boasts Bitcoin as its largest holding (at $116k/coin no less).
The Fed is cutting rates and pausing QT
It might be a slow easing cycle due to entrenched inflation, but easing is better than tightening for risk assets.
Is it possible we've topped for this cycle and prices are heading much lower from here? Absolutely. However I think it's a good place to hedge on there still being upside left. Nibble at ostensible value with cautious optimism.

Campbell's may be bottoming, reinvest those dividends!After a lengthy drawdown, NASDAQ:CPB may finally be grinding out a bottom. A small falling wedge, which tends to be a reversal pattern, appears to be forming.
Analysts are dour on consumer staples companies, but few have the moat Campbell's does. The conventional wisdom in markets now is, the AI bubble has more room to inflate, so you may as well hold onto those positions and be one of the first out at the exit...
Why not start building a position in some of these high quality left-for-dead value stocks and start averaging in with the dividends? In the case of NASDAQ:CPB the yield is now better than the yield you'll get on cash.

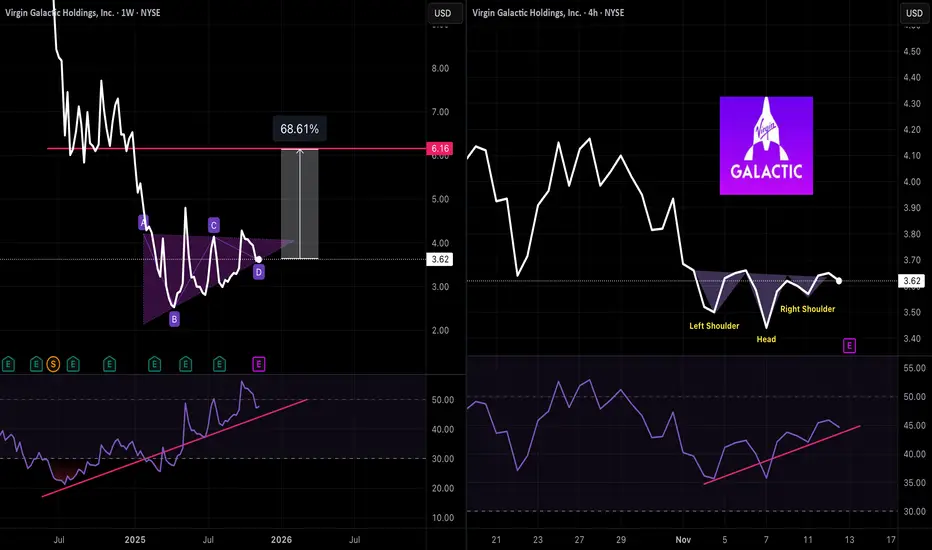
Is Virgin Galactic ready for liftoff?Virgin Galactic NYSE:SPCE has been building an ascending triangle on the weekly chart with a huge gap to fill if it can break to the upside.
Zooming in on a short term 4H chart we see an inverted head & shoulders with improving momentum.
Could one more earnings beat be the catalyst to start the engines and send this spaceship back up to the mesosphere?!
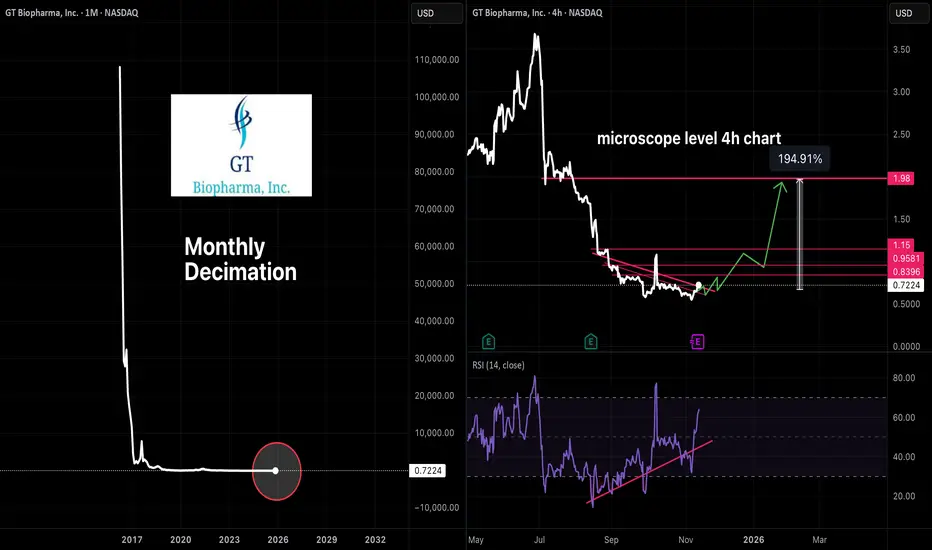
GTBP primed for a moonshot?Is NASDAQ:GTBP primed for a parabolic pump?
The monthly chart is disastrous, but if you drill all the way down to the 4H chart, it looks to be coiling up.
There are plenty of red flags with this name. Hemorrhaging funds and a lack of options are both warning signs. Technicals suggest there could be some type of turnaround brewing.
If you've got money you could comfortably part with, maybe pick up a few shares on a long shot.
$XAUUSD Bearish Momentum Divergence. Quick trade oportunityIF and only IF:
The price breaks under this small tight channel.
The 3 SMA cross back under the 20 SMA.
The prices remains under the 150 SMA.
It would be a great opportunity to take a 2:1 quick trade on a 1H chart.
Why I say IF and only IF? Because the divergence itself isn't enough as a trigger, we need confluence, we need confirmations.
I'm setting up alerts in case the entry is confirmed.
Let's see

XAGUSD 1d Bullish DivergenceThere are some technical signs that OANDA:XAGUSD might do a swing up
There is a bullish divergence of price vs momentum
MACD is about to cross the signal line
The downward trendline has already been crossed to the upside
So it might be a good idea to go long with a profit target at the monthly pivot (24.176)

Potential Head and Shoulders Pattern A potential H&S Top pattern in Kotak Bank with neckline at 1630. Pattern target is at 1190.
Elliot Wave wise, Wave B (a triangle) seems near completion and Wave C which will be a five-wave decline is possibly next. Minimum expectation of Wave C is to be equal to Wave A which is at around 1490.
A negative divergence with momentum is seen on daily and weekly charts.
Note- Not an investment advice,

A Recession vs a Bearish Correction The bitter memory from 2008 still persists in our minds, or at least in the minds of those who witnessed first hand what a Great Recession is. In 2008 many variables were set and many gears were in motion. Long story short, even though the media has attempted to call a recession, or to spread the fear of the bear among the people, which technically yes, it is a bear market by definition, it is not a recession, just yet.
We’re in a hiking rate environment, and still the major indexes have managed to find support on the long term moving averages. Comparing the levels and the moving average crosses today and in 2008, the main difference we find is the levels did cross down and the trend was officially bear. Afterwards a capitulation took place and the macroeconomic variables changed to provide the environment for a rebound and a reversal which gave birth to this secular bull market.
We’re not at the capitulation level, the volume has been steady and we’re on the bullish side of the trend. What did we just witness? A bear leg, basically a painful correction. The indexes are turning to the upside, the market took profits and the VIX scratched above the 20 level. We’ll probably see more selling because we’re in the take profit part of the short term cycle. We’ll see how deep the market is willing to dive, but the positive momentum divergence and the back to the green of the indicators show the intent to go for a bullish leg.
The target area is at the 4500-4600 level.

Possible short entry COMPUSDT 1:6.7 RRBINANCE:COMPUSDT
Divergence on Squeeze Momentum LB and RSI, shorting for 1:6.7 RR
Entry $64.78
SL $66.28
TP $54.64

BTC bottom in or more blood?BTC looks like it hit a bottom after LFG cleared out its $BTC reserves to defend its stability.
The momentum indicator if continues to curl up may produce a bullish momentum div, not yet confirmed. BBWP reading about to top out, no confirmation yet either upon crossover of its MA. EWT corrective target hit ~$30.7k from 1.272 fibs measured from late Jan. bottom to late March top. Not to mention we've hit the bottom of a fork
There are risk factors of this idea not playing such as:
BTC continues to correlate with trades/sp500 and drops alongside it as QT continues, and interest rates get risen from the fed.
BTC has not retested the 200W MA
Cyber security risks w/ regard to complete shutdown of power grids mining BTC and hosting/running many DeFi/L1/L2 services, with nations like RU/CN engaging in non-kinetic warfare. We've already seen RU disconnect intercontinental cables in the Atlantic. As the EU holds out on gas during winter, we could see more desperate measures/retaliation through new avenues in 5th Gen. warfare .
Shanghai lockdown fails to prevent the spread of bird flu , potentially inducing another global lockdown
If the trade does get stopped out, the next areas of interest for entry would be 23k if we close under $29.2k on the daily, invalidating bull impulsive Elliott wave since late June. The on-chain bottom is ~$27k, and 200W MA is ~$21K, both are also entries in the event of an invalidation.
Trade:
Entry:$30.7k
SL: $26.6K
TP: Hull MA ~$36k, ABC PoC ~$39k

$APE bottom in? APE CHAIN?The next NFT frontier for the apes, APE CHAIN .
Could $APE launch itself to compete w/ $BNB? It all depends on how heavily invested/serious they are in building an actual metaverse to reality. Looking at the founders of the coin, how $APE is now a payment currency on open sea , and how most metaverse projects are having trouble launching, I’m afraid $APE is a buy the rumor, sell the news type of coin for now.
Would recommend getting on ape now at ~$17
Long based on speculation that other people will ape their $ to fund a potential leading metaverse project. Whether or not it delivers is irrelevant to making a profit given the strong community in the NFT space.
More on the technicals:
$APE looks like it might bottom out here around $17 from a bull div on the 2HR and moving away from a state of mean reversion since the high of $27. The BBWP indicator has yet to confirm the end of the volatile move but I speculate it will give consolidation soon as more APEs pause redeeming land deeds as they get sold out or wait for gas fees to come down to more reasonable levels. Once we get a rally, expect resistance at ~$20
The key points of confluence for the bottom:
Wave 3 PoC
0.5 fib retracement of Wave 3
1.272 fib extension of Wave C of ABC pattern on Wave 4
The token distribution looks fair, though I would remain cautious of any possible scam wicks given how normie-friendly this coin is. If we break the $16.6 low, there is a 50/50 chance of visiting the white trend line at ~$12.
Trade :
Long
Entry: $17.5
TP: $20, $24, $34, Delivery of Metaverse Project
SL: $15

BTCUSD Elliott Wave Forecast - Wave 4 Bullish Hidden Divergence*Re-post* Previous idea got removed.
A guideline for all variations of a flat correction is that Wave C is required to have momentum divergence (please see linked ideas below).
In this instance, the chart above depicts a Bullish Hidden Divergence on the weekly TF. A Bullish Hidden Divergence occurs when price action prints a higher low whilst the momentum indicator shows a lower low. This can usually be spotted towards the end of a correction indicating that price may soon rally.
I hope you found this useful, do leave your thoughts in a comment below.
As always, a 'like' and 'follow' is much appreciated and provides encouragement to share further ideas.
Thank you for taking the time.
BeyondEdge
Your Edge Is Your Perception. Go Beyond.

KLVUSDT: going to pump I think KLV just finished its ABS (a zigzag ) correction as a regular flat pattern and ready to go to the moon

Momentum Pinball strategy - long EURGBP
Momentum pinball strategy - from the book ' Street Smarts".
1. Sell off day before closing in lower 20%
2. today looking for a reversal - break above the first hours high is signal.
3. Stop below low of day
4. Hold until profit acceptable or near previous highs or until next day only

How to use trend channel to judge the price action momentumIn this video, I use S&P 500 futures CME_MINI:ES1! as an example to show you using trend channel to judge the price action momentum. At the later part of the video, I also show the use of upward thrust, and the up wave on top of the channel to judge the momentum.
It is important to assess the price action momentum of any trading instruments (i.e. stocks, Forex, futures, bond, bitcoin, etc…). If there is a fading of momentum, this is the first sign of weakness to pay attention to before we start to anticipate a change of character, e.g. a down-wave to at least stopping the uptrend, if not reversing the trend immediately.
Having said that, do not get misled that if we see loss of momentum of the trading instruments, we need to get bearish to short, simply because this is only a red flag for us to anticipate potential weakness ahead. And it will take time to materialize.
As long as we have a structure with higher high and higher low, the up trend is still intact.

BTC USD: Short discussion on potential bottom.Quick introduction to the ideas of holder psychology, trading's power to control price, potential BTCUSD bottom.
Also of note is the start of an apparent decrease on momentum and price stabilization that could be indicative of the bottom.

Does history repeat itself?I'm not a pessimist on Bitcoin, I really believe in the technology behind it and in the disruptive power that it brings to the economy and society. But, every market needs some time to rest and to make new money flow.
I believe that an eternal run without corrections is not healthy for any active, stock or crypto...
TA:
We are facing a Momentum Divergence on Bitcoin.
This divergence is basically a disagreement between an indicator and price, and as we can see by the pink lines in the chart, every time in the past that we had a Momentum Divergence we saw a correction, and right now this signals are so evident on RSI and MACD indicators.
Looking back again, the last corrections went until the 0.5 and 0.618 Fibo areas, so if this happens again, we can expect a correction until the area between the regions 0.5 ($12.750) and 0.618 ($11.024) that probably will match with the 50 and 100 days moving averages.

USDJPYRejection at resistance zone.
Bearish momentum divergence.
Break and close below 20ema.
Bounce at previous resistance, now potential support (dotted line).
Looking to short at break below red dotted line.
