Bullish Breakout – Monitor for follow-through Support: ₹500–₹570 (previous resistance)
Upside Targets: ₹650, ₹750
Stop-loss: Below ₹499
Momentumstrategy

QBTS — RS 99 Leader in a Leading Group | Textbook Bull Flag This chart highlights a classic bull flag continuation setup on D-Wave Quantum (QBTS) — a high Relative Strength (RS 99) name within the Computer–Hardware/Peripheral industry group, one of the top-ranked sectors in the current market.
Even though QBTS’s earnings don’t fully meet traditional CANSLIM criteria, this setup shows why focusing on leading themes, strong groups, and RS leadership can be just as powerful in identifying potential big winners.
Key Leadership Factors:
✅ High RS (99)
✅ Leading Industry Group
✅ Part of the 2025 AI/Quantum Theme
Following a sharp 100%+ move (the flagpole), NYSE:QBTS consolidated in a tight, downward-sloping flag with low-volume pullbacks — a textbook structure signaling healthy digestion of gains.
The breakout came on expanding volume, confirming renewed institutional buying pressure.
Key Technical Traits:
-Strong flagpole with explosive volume
-Pullback of ~19% on lighter volume
-Rising key moving averages
-Breakout on heavy volume
This is a Qullamaggie-style momentum continuation setup — clean, structured, and high risk/reward.

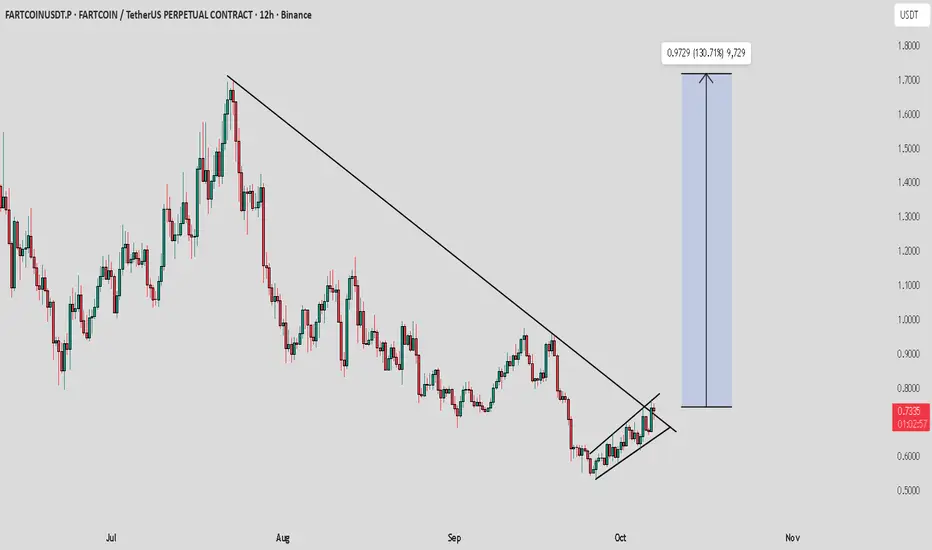
FARTCOIN / USDT : Breaking out with good momentumFARTCOIN is breaking out from trend line resistance and showing improving momentum. If this breakout holds, we can expect a bullish rally towards $1.0 – $1.3 – $1.5 in the short term.
Always wait for confirmation and manage risk wisely.
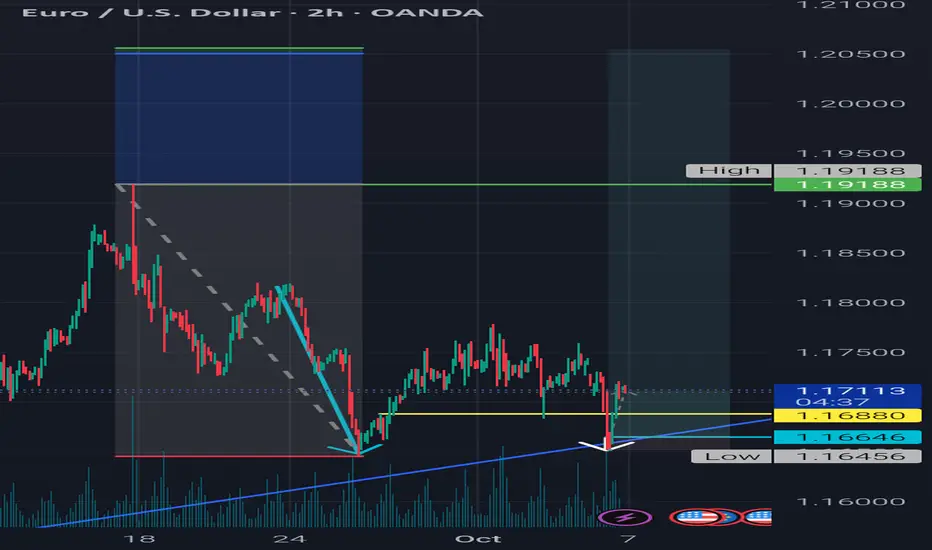
Momentum-Backed Retracement + Volume Retest | BadgerFX 📊 This setup establishes directional bias from the monthly chart (Current Bias: 📈 Bullish). The trade idea integrates momentum-driven retracements in line with this bias and validates continuation through structure and volume on the 15m.
📍 1.16880 confirmed the shift in structure, supported by volume, reinforcing alignment with the monthly trend. Final execution 🎯 relies on candlestick precision for entry timing.
⚠️ Disclaimer: The information shared here is for educational and entertainment purposes only and should not be considered financial advice.
BadgerFX 🦡 – Honey Badger Don’t Care
A+ Momentum Setup | Plug Power (PLUG) BreakoutA clean A+ momentum setup on Plug Power (PLUG) — a perfect example of how price structure, volume, and momentum align before a big move.
🔍 Discovered using my volume scan.
🔹 Structure: Higher low → reclaim of key moving averages → breakout through resistance
🔹 Volume: Big demand on the move up, light volume on the pullback
🔹 Momentum: 6.5R move (72% gain on partials) — strong follow-through as trend expanded, offering a great risk/reward opportunity
This is what I look for every week — clear structure, expanding volume, and strength confirming participation.
My goal isn’t to predict; it’s to react with discipline when everything lines up.
No hype. No gimmicks. Just price action, volume, and process.

BXP Stock Going UP, Bullish Momentum ConfirmedHello,
Ayrfolio trade ideas are based on weekly charts and momentum, so remember to be patient! No day trades here unless the stock soars up intraday. Today we’re covering:
COMPANY: BXP Inc
STOCK SYMBOL: BXP
POSITION: Long
TP1 Risk-Reward Ratio: 1.45
TP2 Risk-Reward Ratio: 2.89
Stop Loss: must wait AFTER daily candle closes to exit trade (regular candle, NOT Heiken Ashi)
Ultimate Stop Loss: can exit IMMEDIATELY if price reaches this level during any trading hours
EXPLANATION: Weekly momentum increased and confirmed on Tuesday 9/2/25 at 76.83/share. Although the stop losses are listed on the chart, if momentum has been lost then we can exit before the price reaches the stop loss.
DISCLAIMER: Please do your own due diligence before making any decisions. I am not an investment advisor, and I do not personally trade these stocks. These posts are stock trade ideas that follow my same weekly momentum strategy. Past results are not indicative of future performance.
P.S. - Stocks can soar. YOU can soar. Soaring is possible!
-Ayrfolio

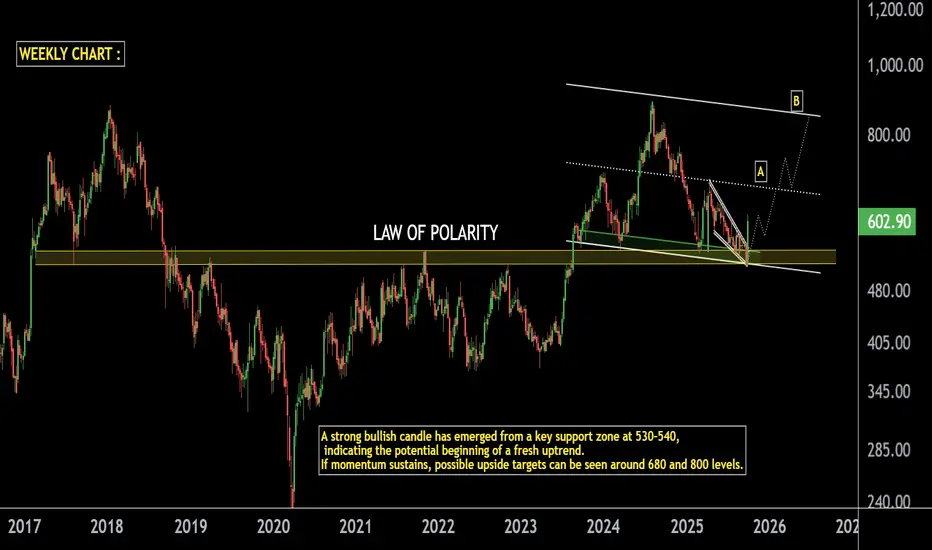
SUN TV on Fire: Explosive Move from Strong Support Zone.SUN TV Weekly Analysis
Support Zone: Stock is respecting the long-term LOP with strong support in the 520–530 range.
Bullish Candle: A powerful bullish candle has formed at this support zone, signaling strength.
Momentum Outlook: If momentum continues, a minor correction could act as a healthy pause before the next rally.
Resistance Levels:
First resistance / rally stop point near 680.
If 680 breaks, next resistance is positioned around 850.
Trend View: As long as the 520–530 support zone sustains, SUN TV may continue its rally in the coming sessions.
Thank You !!
BRX Stock Going UP, Bullish Momentum ConfirmedHello,
Ayrfolio trade ideas are based on weekly charts and momentum, so remember to be patient! No day trades here unless the stock soars up intraday. Today we’re covering:
COMPANY: Brixmor Property Group, Inc.
STOCK SYMBOL: BRX
POSITION: Long
TP1 Risk-Reward Ratio: 1.54
TP2 Risk-Reward Ratio: 3.09
Stop Loss: must wait AFTER daily candle closes to exit trade (regular candle, NOT Heiken Ashi)
Ultimate Stop Loss: can exit IMMEDIATELY if price reaches this level during any trading hours
EXPLANATION: Weekly momentum increased and confirmed on Tuesday 9/2/25 at $28.20/share. Although the stop losses are listed on the chart, if momentum has been lost then we can exit before the price reaches the stop loss.
DISCLAIMER: Please do your own due diligence before making any decisions. I am not an investment advisor, and I do not personally trade these stocks. These posts are stock trade ideas that follow my same weekly momentum strategy. Past results are not indicative of future performance.
P.S. - Stocks can soar. YOU can soar. Soaring is possible!
-Ayrfolio

WAFD Stock Going UP, Bullish Momentum ConfirmedHello,
Ayrfolio trade ideas are based on weekly charts and momentum, so remember to be patient! No day trades here unless the stock soars up intraday. Today we’re covering:
COMPANY: WaFd, Inc.
STOCK SYMBOL: WAFD
POSITION: Long
TP1 Risk-Reward Ratio: 1.79
TP2 Risk-Reward Ratio: 3.59
Stop Loss: must wait AFTER daily candle closes to exit trade (regular candle, NOT Heiken Ashi)
Ultimate Stop Loss: can exit IMMEDIATELY if price reaches this level during any trading hours
EXPLANATION: Weekly momentum increased and confirmed on Monday 8/18/25 at $31.73/share. Although the stop losses are listed on the chart, if momentum has been lost then we can exit before the price reaches the stop loss.
DISCLAIMER: Please do your own due diligence before making any decisions. I am not an investment advisor, and I do not personally trade these stocks. These posts are stock trade ideas that follow my same weekly momentum strategy. Past results are not indicative of future performance.
P.S. - Stocks can soar. YOU can soar. Soaring is possible!
-Ayrfolio

S&P 500: Pullback after flash dump is a Short opportunity
📝 1. Market Context
BLUEBERRY:SP500 recently witnessed a sharp drop from 6,698 down to 6,645, showing clear bearish momentum. After this fall, the index attempted a recovery, but the bounce was weak: green candles became smaller and stalled right at key resistance zones. A long red bearish engulfing candle then erased the entire recovery, proving sellers are back in control.
🟥 2. Static Resistance (Red Zone on Chart)
On the chart, the red zone represents static resistance, located around 6,671 – 6,664.62. This area aligns with:
• Dynamic resistance (moving averages).
• Static resistance (previous supply zone).
Every time price has tested this area, it faced rejection. This makes the red zone a high-probability level for sellers to step in again if price retests it.
🟩 3. Support Zone (Green Zone on Chart)
The nearest support lies at 6,639, highlighted as the green zone on the chart. This is the first logical downside target, where price might pause or react before choosing the next move.
🎯 4. Bearish Scenario
• Bias: Bearish continuation.
• Entry zone: 6,671 – 6,664.62 (red resistance zone).
• Target: 6,639 (blue support zone).
• Invalidation: If price closes firmly above 6,672, this bearish idea is no longer valid.
✅ 5. Summary
After a sharp decline, the weak bounce into resistance looks like an opportunity for sellers. As long as the index remains below the red resistance zone, the path of least resistance points lower, with 6,639 as the next key support to watch.
📈 Similar to the previous Buy setup, we can see that price is reacting in a similar manner — it touches the static support zone (marked in green) and the moving average (acting as dynamic resistance), before making a strong bounce.
Please like and comment below to support our traders. Your reactions will motivate us to do more analysis in the future 🙏✨

AGCO Stock Going UP, Bullish Momentum ConfirmedHello,
Ayrfolio trade ideas are based on weekly charts and momentum, so remember to be patient! No day trades here unless the stock soars up intraday. Today we’re covering:
COMPANY: AGCO Corporation
STOCK SYMBOL: AGCO
POSITION: Long
TP1 Risk-Reward Ratio: 1.70
TP2 Risk-Reward Ratio: 3.40
Stop Loss: must wait AFTER daily candle closes to exit trade (regular candle, NOT Heiken Ashi)
Ultimate Stop Loss: can exit IMMEDIATELY if price reaches this level during any trading hours
EXPLANATION: Weekly momentum increased and confirmed on Monday 5/19/25 at $107.18/share. Although the stop losses are listed on the chart, if momentum has been lost then we can exit before the price reaches the stop loss.
DISCLAIMER: Please do your own due diligence before making any decisions. I am not an investment advisor, and I do not personally trade these stocks. These posts are stock trade ideas that follow my same weekly momentum strategy. Past results are not indicative of future performance.
P.S. - Stocks can soar. YOU can soar. Soaring is possible!
-Ayrfolio

DOT / USDT : Momentum building for a strong rallyDOT/USDT is showing strong momentum and looks ready for a rally. If momentum continues to build, the next upside targets are $5 – $6.
Always manage risk and wait for confirmation before entering.

TATA CHEMICALS on Full Momentum – Don’t Miss the RideTATA CHEMICALS – 4 Hour Timeframe Update
Tata Chemicals is currently forming a broadening pattern and is in the process of completing its 4th leg.
The stock is showing strong momentum, supported by the Supertrend indicator, and continues to make new highs.
Support Zone: 980 – 990
Potential Upside Target: 1050 – 1070 (valid only if the support holds)
Thank you!

HTH Stock Bullish Momentum ConfirmedHello,
Ayrfolio trade ideas are based on weekly charts and momentum, so remember to be patient! No day trades here unless the stock soars up intraday. Today we’re covering:
COMPANY: Hilltop Holdings Inc.
STOCK SYMBOL: HTH
POSITION: Long
TP1 Risk-Reward Ratio: 1.34
TP2 Risk-Reward Ratio: 2.68
Stop Loss: must wait AFTER daily candle closes to exit trade (regular candle, NOT Heiken Ashi)
Ultimate Stop Loss: can exit IMMEDIATELY if price reaches this level during any trading hours
EXPLANATION: Weekly momentum increased and confirmed on Monday 8/18/25 at $34.68/share. Although the stop losses are listed on the chart, if momentum has been lost then we can exit before the price reaches the stop loss.
DISCLAIMER: Please do your own due diligence before making any decisions. I am not an investment advisor, and I do not personally trade these stocks. These posts are stock trade ideas that follow my same weekly momentum strategy. Past results are not indicative of future performance.
P.S. - Stocks can soar. YOU can soar. Soaring is possible!
-Ayrfolio

AFG Stock Confirmed Bullish/Going UPHello,
Ayrfolio trade ideas are based on weekly charts and momentum, so remember to be patient! No day trades here unless the stock soars up intraday. Today we’re covering:
COMPANY: American Financial Group, Inc.
STOCK SYMBOL: AFG
POSITION: Long
TP1 Risk-Reward Ratio: 1.45
TP2 Risk-Reward Ratio: 2.89
Stop Loss: must wait AFTER daily candle closes to exit trade (regular candle, NOT Heiken Ashi)
Ultimate Stop Loss: can exit IMMEDIATELY if price reaches this level during any trading hours
EXPLANATION: Weekly momentum increased and confirmed on Tuesday 9/2/25 at $138.65/share. Although the stop losses are listed on the chart, if momentum has been lost then we can exit before the price reaches the stop loss.
DISCLAIMER: Please do your own due diligence before making any decisions. I am not an investment advisor, and I do not personally trade these stocks. These posts are stock trade ideas that follow my same weekly momentum strategy. Past results are not indicative of future performance.
P.S. - Stocks can soar. YOU can soar. Soaring is possible!
-Ayrfolio

will SOFI be the HOOD of 2026?SOFI breaking out to all time highs.
Blue sky above.
Will NASDAQ:SOFI repeat what NASDAQ:HOOD did in 2025?
Both of them are in the top 10 momentum stocks of 2025.

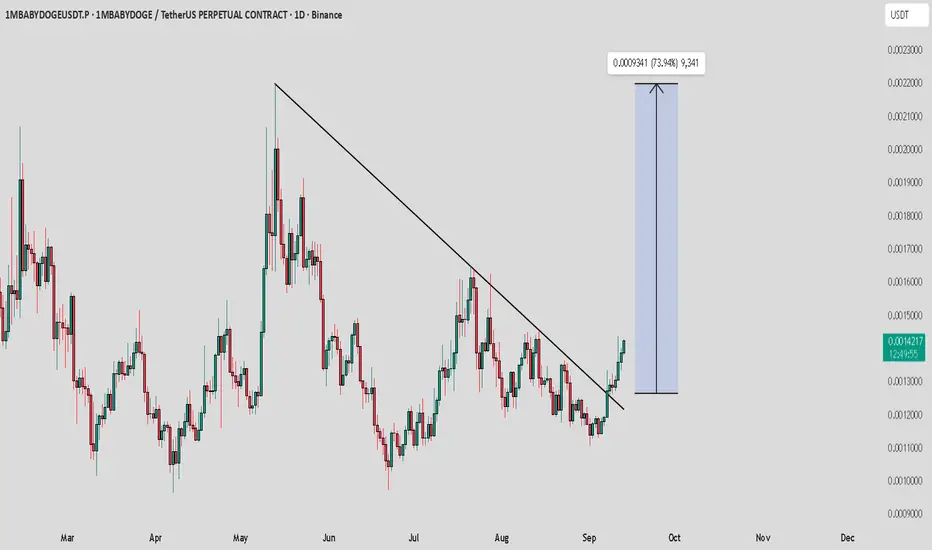
1MBABYDOGE / USDT : Showing strong momentum after breakout1MBABYDOGE/USDT is showing strong momentum after breaking out of trendline resistance. Already up +13%, but the structure still looks bullish.
Next targets: $0.0020 – $0.0025 if momentum continues.
Always manage risk and avoid chasing without confirmation.
OTTR Stock Confirmed Bullish/Going UPHello,
Ayrfolio trade ideas are based on weekly charts and momentum, so remember to be patient! No day trades here unless the stock soars up intraday. Today we’re covering:
COMPANY: Otter Tail Corporation
STOCK SYMBOL: OTTR
POSITION: Long
TP1 Risk-Reward Ratio: 1.67
TP2 Risk-Reward Ratio: 3.34
Stop Loss: must wait AFTER daily candle closes to exit trade (regular candle, NOT Heiken Ashi)
Ultimate Stop Loss: can exit IMMEDIATELY if price reaches this level during any trading hours
EXPLANATION: Weekly momentum increased and confirmed on Monday 8/18/25 at $85.97/share. Although the stop losses are listed on the chart, if momentum has been lost then we can exit before the price reaches the stop loss.
DISCLAIMER: Please do your own due diligence before making any decisions. I am not an investment advisor, and I do not personally trade these stocks. These posts are stock trade ideas that follow my same weekly momentum strategy. Past results are not indicative of future performance.
P.S. - Stocks can soar. YOU can soar. Soaring is possible!
-Ayrfolio

TREE Stock Long Position Confirmed Monday 8/4/25Hello,
Ayrfolio trade ideas are based on weekly charts and momentum, so remember to be patient! No day trades here unless the stock soars up intraday! Today we’re covering:
STOCK SYMBOL: TREE
POSITION: Long
TP1 Risk-Reward Ratio: 1.39
TP2 Risk-Reward Ratio: 2.79
Stop Loss: must wait AFTER daily candle closes to exit trade (regular candle, NOT Heiken Ashi)
Ultimate Stop Loss: can exit IMMEDIATELY if price reaches this level during any trading hours
EXPLANATION: Weekly momentum increased and confirmed on Monday 8/4/25 at $54.17/share. Although the stop losses are listed on the chart, if momentum has been lost then we can exit before the price reaches the stop loss.
DISCLAIMER: Please do your own due diligence before making any decisions.
P.S. - Stocks can soar. YOU can soar. Soaring is possible!
-Ayrfolio

BY Stock Confirmed Bullish/Going UPHello,
Ayrfolio trade ideas are based on weekly charts and momentum, so remember to be patient! No day trades here unless the stock soars up intraday. Today we’re covering:
COMPANY: Byline Bancorp, Inc.
STOCK SYMBOL: BY
POSITION: Long
TP1 Risk-Reward Ratio: 1.51
TP2 Risk-Reward Ratio: 3.01
Stop Loss: must wait AFTER daily candle closes to exit trade (regular candle, NOT Heiken Ashi)
Ultimate Stop Loss: can exit IMMEDIATELY if price reaches this level during any trading hours
EXPLANATION: Weekly momentum increased and confirmed on Monday 8/18/25 at $28.93/share. Although the stop losses are listed on the chart, if momentum has been lost then we can exit before the price reaches the stop loss.
DISCLAIMER: Please do your own due diligence before making any decisions. I do not personally trade these stocks, but these stocks follow my same weekly momentum strategy. Past results are not indicative of future performance.
P.S. - Stocks can soar. YOU can soar. Soaring is possible!
-Ayrfolio

FLNG Bullish Stock Confirmed Going UPHello,
Ayrfolio trade ideas are based on weekly charts and momentum, so remember to be patient! No day trades here unless the stock soars up intraday. Today we’re covering:
COMPANY: FLEX LNG Ltd.
STOCK SYMBOL: FLNG
POSITION: Long
TP1 Risk-Reward Ratio: 1.41
TP2 Risk-Reward Ratio: 2.82
Stop Loss: must wait AFTER daily candle closes to exit trade (regular candle, NOT Heiken Ashi)
Ultimate Stop Loss: can exit IMMEDIATELY if price reaches this level during any trading hours
EXPLANATION: Weekly momentum increased and confirmed on Monday 8/25/25 at $27.25/share. Although the stop losses are listed on the chart, if momentum has been lost then we can exit before the price reaches the stop loss.
DISCLAIMER: Please do your own due diligence before making any decisions. I do not personally trade these stocks, but these stocks follow my same weekly momentum strategy. Past results do not indicate future performance.
P.S. - Stocks can soar. YOU can soar. Soaring is possible!
-Ayrfolio

BANC Bullish Stock Going UP and Confirmed!Hello,
Ayrfolio trade ideas are based on weekly charts and momentum, so remember to be patient! No day trades here unless the stock soars up intraday. Today we’re covering:
COMPANY: Banc of California, Inc.
STOCK SYMBOL: BANC
POSITION: Long
TP1 Risk-Reward Ratio: 1.68
TP2 Risk-Reward Ratio: 3.36
Stop Loss: must wait AFTER daily candle closes to exit trade (regular candle, NOT Heiken Ashi)
Ultimate Stop Loss: can exit IMMEDIATELY if price reaches this level during any trading hours
EXPLANATION: Weekly momentum increased and confirmed on Monday 8/18/25 at $16.29/share. Although the stop losses are listed on the chart, if momentum has been lost then we can exit before the price reaches the stop loss.
DISCLAIMER: Please do your own due diligence before making any decisions. I do not personally trade these stocks, but these stocks follow my same weekly momentum strategy. Past results do not indicate future performance.
P.S. - Stocks can soar. YOU can soar. Soaring is possible!
-Ayrfolio

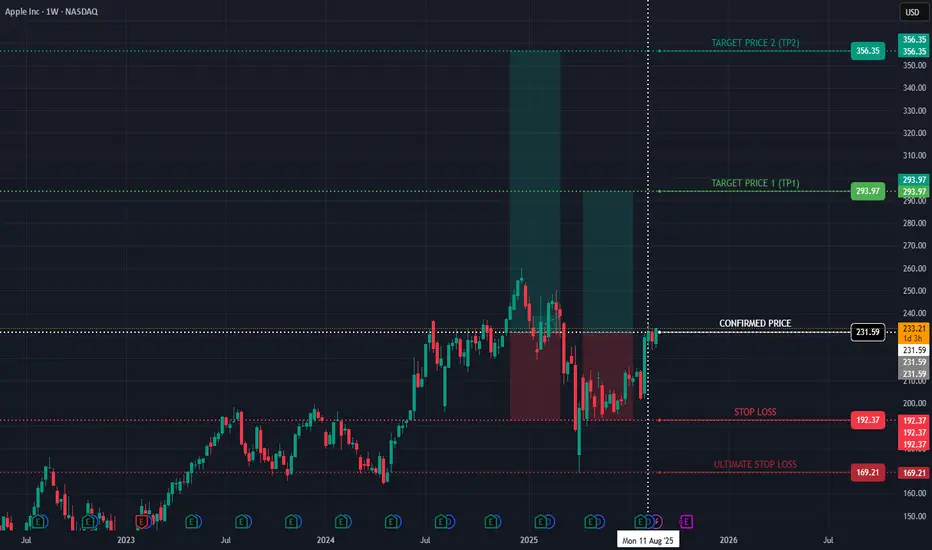
AAPL Bullish Stock Going UP and Confirmed!Hello,
Ayrfolio trade ideas are based on weekly charts and momentum, so remember to be patient! No day trades here unless the stock soars up intraday. Today we’re covering:
COMPANY: Apple Inc
STOCK SYMBOL: AAPL
POSITION: Long
TP1 Risk-Reward Ratio: 1.59
TP2 Risk-Reward Ratio: 3.18
Stop Loss: must wait AFTER daily candle closes to exit trade (regular candle, NOT Heiken Ashi)
Ultimate Stop Loss: can exit IMMEDIATELY if price reaches this level during any trading hours
EXPLANATION: Weekly momentum increased and confirmed on Monday 8/11/25 at $231.59/share. Although the stop losses are listed on the chart, if momentum has been lost then we can exit before the price reaches the stop loss.
DISCLAIMER: Please do your own due diligence before making any decisions.
P.S. - Stocks can soar. YOU can soar. Soaring is possible!
-Ayrfolio