Pepsi Bullish UpsideWhether its shares or options. Pepsi is very attractive at this level. For holders of the stock, Pepsi has raised its dividend for 50 straight years.
My levels for longs are this level with a tight stop below the daily higher low at 141.26 for options,
-conservative stop $138.57
-Risky stop $137.64
Target-Gap $150
next $157.71
3rd target $169.25
final boss target $177.28
Please do your own research. This is a slow mover so leaps for options or at least 3 months out. And for share HOLD.
Good luck. I will update this daily. ===All targets are on the chart.===
NOT FINANCIAL ADVISE!!!!
Moneymakers

Potential 600Pips on EURAUDWait for price to rally into the 1.7780 – 1.7805 region.
Confirmation:
A structural shift, confirmed by a break and close below 1.7690.
Possible Entries
Entry 1
Sell Limit @ 1.7885
Stop Loss @ 1.7838
Entry 2
Sell Limit @ 1.7870
Stop Loss: Refined on entry
Target Levels
T1: 1.7484
T2: 1.7330
T3: 1.7180
This move can be anticipated to develop between 19:00 UTC, 17th December 2025 and 02:00 UTC, 26th January 2026.
This setup offers a projected risk-to-reward of approximately 1:11 when executed from refined entries.
Trade Safe.
Patience is the Way!
Ieios

BUY STOP EURJPY 184+Buy stop , Eurjpy use proper techniques to manage your trades (50/50+Trial Stop)

Spy Bullish Daily CloseSpy closed the week out bullish as it closed green and up over 670 and is at 672 in after hours. If you look at the chart you will see that that wick on the daily trapped about 1% of the friday bears. Today was the highest volume candle of the week at over 100m.
Also,
There is about 50k in option put OI. Always remember to take a photo or screen shot of this on Friday and look at it again on Monday. We may get a morning squeeze to open up on Monday once these are closed. I do think we pull back more to retest this level before eventually going higher.
One trade could be shorting 684 back into 672. (stop 685.) These are all short term as the longer term thesis is bullish.
I believe we see 700 spy by EOD.
See you on the other side.

Zomdf bull thesis Zomdf is in a good spot to catch a bounce to .47. Then .82 ,gap at .99. Once this is over $1.00 it will squeeze to 2.08 which is my profit target.
If you use MA's. This broke the reclaimed and just held the retest of the 200 day SMA.
This capitulated in March with over 282 million is sale vol. Since then you have a rounded bottom. And recently the tech company that uses AI for you furry friends had great earnings.
I believe that this is a $2 stock by mid next year. But DYOR.

Methodology: Smart Money Concept (SMC) 📈 BULLISH ANALYSIS - XAUUSD (GOLD)
Timeframe: 15M - 1H
🎯 TRADE SETUP
· ENTRY ZONE: 3,930
· STOP LOSS: 3,892
· TAKE PROFIT: 4,018
· RISK/REWARD: 1:2.32 ✅
📊 MARKET CONTEXT
· Liquidity Sweep Complete: The market swept the buy stops below 3,900, trapping late sellers.
· FVG (Fair Value Gap) on 1H: A clear imbalance exists near 3,930, acting as a bullish magnet.
· Order Block (15M): Price rejection at 3,930 confirms institutional buying interest.
· Fakeout & Inducement: Retail was fooled into shorting the lows, just before the reversal.
🔍 SMART MONEY FLOW
Phase: Accumulation
Institutions loaded longs during the dip (3,892-3,930) while weak hands capitulated.
Next Target: 4,018
This is a liquidity pool above the recent high — where sell stops likely cluster.
New Higher High (HH) Incoming
A break above 4,018 confirms the resumption of the bullish trend.
🎮 TRADE LOGIC
Step 1: Liquidity grab below support (trapping sellers)
Step 2: Price returns into FVG + Order Block
Step 3: Rally toward liquidity above 4,018
⚖️ RISK & REWARD
· Risk: 38 points
· Reward: 88 points
· R/R Ratio: 1:2.32
· Position: Long (Buy-side)
📉 SCENARIOS
· Main (70%): Direct push to 4,018 after holding 3,930.
· Retest (30%): Quick dip to 3,910-3,920 before the rally.
· Invalidation: Close below 3,892 (break of accumulation zone).
💬 MOTIVATIONAL CLOSE:
“The market shook out the weak — now it’s our turn. We’re not chasing; we’re entering where institutions accumulated. The fakeout is over. The rally is just beginning. Trust your edge. Let’s ride this to 4,018! GOOD LUCK TRADERS…💪🎯

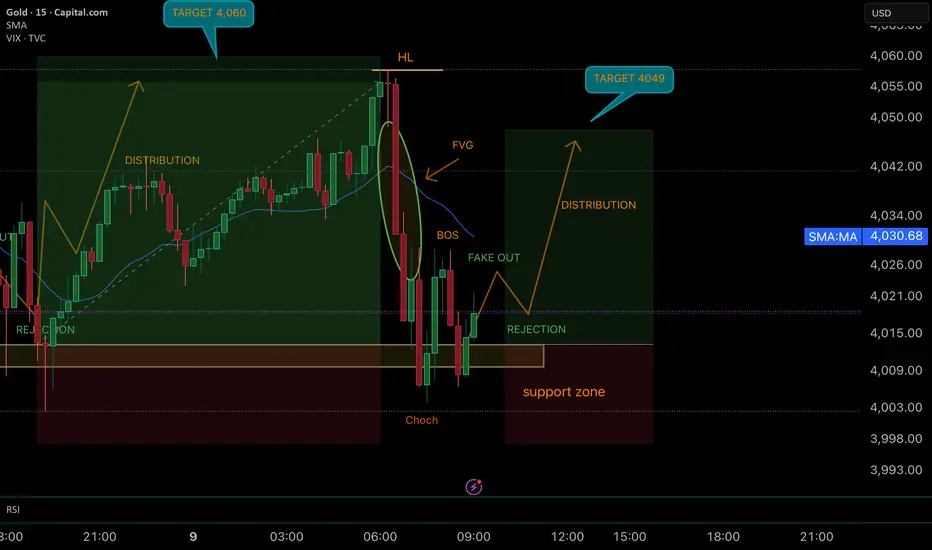
SMART MONEY CONCEPT (SMC)📊 SMC Analysis – GOLD 15M
• After the push into the distribution zone and reaching 4,060, price formed a higher low (HL) before dropping with a Break of Structure (BOS).
• We then saw a fake out into the FVG, followed by a rejection at the support zone.
• Current projection: institutions may use this reset to accumulate, preparing for a new distribution leg toward the target at 4,049.
• Market remains valid for a bullish continuation as long as the support zone holds.
🚀 This setup shows the power of patience: wait for liquidity grabs, respect support, and follow the structure toward new highs.
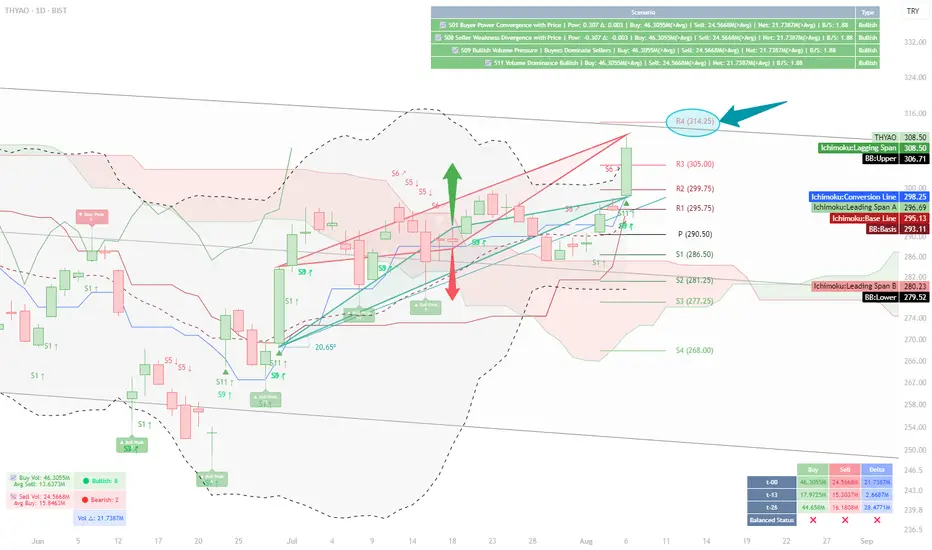
Volume and Structural Analysis of THYAO — Reaching Resistance at📝 Analysis:
My initial focus in this chart was on the daily buy and sell volumes.
According to the table displayed at the bottom of the chart for August 6th:
Buy Volume (t-0): 46.305M
Sell Volume (t-0): 24.566M
These values show a clear increase compared to previous checkpoints (t-13 and t-26).
Notably, the buy volume is 28.3M higher than t-13 and about 1.6M higher than t-26.
This gives us a broader picture: buying strength remains dominant, even though delta volume has not surpassed its value at t-26 (still about 7M short). Nevertheless, the current volume levels show stronger positioning compared to the mid-term past.
On the upper-right side of the chart, four system-based scenarios have been triggered via our custom indicator:
✅ Scenario 01 – Buyer Power Convergence with Price
✅ Scenario 08 – Seller Weakness Divergence
✅ Scenario 09 – Bullish Volume Pressure
✅ Scenario 11 – Volume Dominance Bullish
Together, they present a market that is tilting in favor of the buyers, with bullish sentiment supported by volume structure.
Next, my attention shifts to the triangle formations on the chart, which were automatically plotted based on cross high/low logic.
🔺 The green ascending triangle, with a slope of 20.65°, indicates a healthy and steady bullish structure.
Its top has not yet reached the resistance zone, where the red triangle forms a descending structure aligned with the R4 level at 314.25.
Beyond the technical interpretation, I also look at triangles symbolically.
Throughout history, from the Seal of Solomon (Star of David) to the Egyptian pyramids, triangles have represented stability, energy focus, and a path upward.
In this chart, that symbolism holds true — the green triangle embodies a progressive, rising support, while the red triangle offers a calculated obstacle.
What’s intriguing is the parallel structure of the triangle bases — suggesting a balanced energy field, ready to be tipped by momentum.
📊 When combined with other indicators:
Price is above the red Ichimoku cloud
It sits in the upper zone of the regression channel
Bollinger Bands show an upward breakout bias
Daily pivot levels align with this structure, and the R4 level (314.25) becomes a relevant resistance to monitor
📍 Conclusion:
Given the alignment of structural elements and volume behavior,
a move toward the resistance at 314.25 is well within reach under current market dynamics.
⚠️ This analysis is based on a custom-built indicator named Volume Based Analysis V 1.4+ and is provided strictly for educational and analytical purposes.
No investment or trading advice is intended.
👥 I welcome your interpretations and experiences —
Do you also see 314.25 as a realistic target?
Digital Assets and ESG: Market Trends 2025In 2025, financial markets are undergoing a profound transformation. The two primary forces driving this shift are the rapid expansion of digital assets and the widespread adoption of ESG principles (Environmental, Social, and Governance) in investment strategies. Together, these trends are redefining how both investors and financial institutions approach capital allocation.
One of the most significant developments is the tokenization of real-world assets. This technology allows physical assets—such as real estate, equity shares, and even fine art—to be converted into digital tokens that can be bought, sold, and traded with ease. Tokenization provides greater liquidity, lowers barriers to entry for individual investors, and introduces automation through smart contracts. In the first half of 2025 alone, the global volume of tokenized assets surpassed $450 billion, according to Digital Asset Group analysts.
Cryptocurrencies, once viewed as speculative and volatile, are now being embraced by institutional investors. Hedge funds, banks, and asset managers are increasingly allocating capital to Bitcoin, Ethereum, and stablecoins as a means of hedging risk and achieving portfolio diversification. Simultaneously, interest in decentralized finance (DeFi) continues to rise. These blockchain-based platforms offer higher returns and independence from traditional intermediaries—an appealing proposition even for risk-averse investors.
Alongside digitization, ESG investing has grown into a cornerstone of modern portfolio construction. According to the Global Sustainable Investment Alliance, more than 70% of large investment funds now integrate sustainability metrics into their decision-making processes. Companies that reduce environmental harm, promote fair labor practices, and maintain transparent governance are becoming the preferred choice for long-term investors. Green bonds and renewable energy funds, in particular, are attracting record inflows.
However, as ESG investing matures, so does scrutiny. Market participants are demanding clear standards and verifiable reporting. Regulators across the U.S., EU, and Asia are introducing mandatory ESG disclosure rules to combat greenwashing and ensure transparency. These measures are expected to reshape how sustainability is measured and reported across industries.
The convergence of digital innovation and sustainable finance is giving rise to a new class of investments—tech-enabled and socially responsible. Investors are increasingly using platforms that combine analytics, artificial intelligence, and ESG filters to identify assets that align with both financial performance and ethical values.
In conclusion, 2025 marks a pivotal year in the evolution of financial markets. Technology and sustainability are no longer separate trends; they are becoming the new standard. Those who embrace this shift are likely to be best positioned to thrive in an increasingly complex and interconnected investment landscape.

If the price enter these red-marked zones!Gold Market Analysis (Engulfing & Zone-Based Strategy)
This analysis is based on a straightforward zone-trading method using engulfing patterns and filtered key levels. The marked zones on the chart highlight high-probability trading areas.
Red Zones (Sell Areas):
If the price enters these red-marked zones, we look for bearish confirmation to enter sell trades.
These zones are derived from the 4H timeframe, making them more reliable. If the market reacts from here, you can target around 60–80 pips in profit.
A second sell zone offers potential for a larger move—up to 150+ pips—if the price respects it.
Green Zones (Buy Areas):
If the price drops and enters the green-marked zone, it’s a signal to look for buy setups.
This area may deliver a strong bounce, potentially yielding 100+ pips.
There’s no need for complicated patterns or indicators—just follow the zones. If the price hits a zone and shows confirmation, you trade it.
Trade at your own risk DYOR!!

USDJPY - Analysis and Potential Setups (Intraday- 25.04.25)Overall Trend & Context:
This pair is in an overall uptrend and has reacted off the 140.00 support levels (as well as the 200 EMA on the Daily chart).
Technical Findings:
Price is trading above 25, 50,100 and 200 EMA's on intraday charts.
Powerful break of structure which leaves no question about bullish force.
Current consolidation - Demand needs to be built before continuation.
Notes:
Price is currently at a historic support level however has not closed above daily supply, we are still in the area of doing so.
Manage your risk, take the trade with confirmations only.

This is my point of view regarding the S&P 500This is my point of view regarding the S&P 500. Will it play out exactly like this? Probably not, but as a general picture, I think there will be similarities.

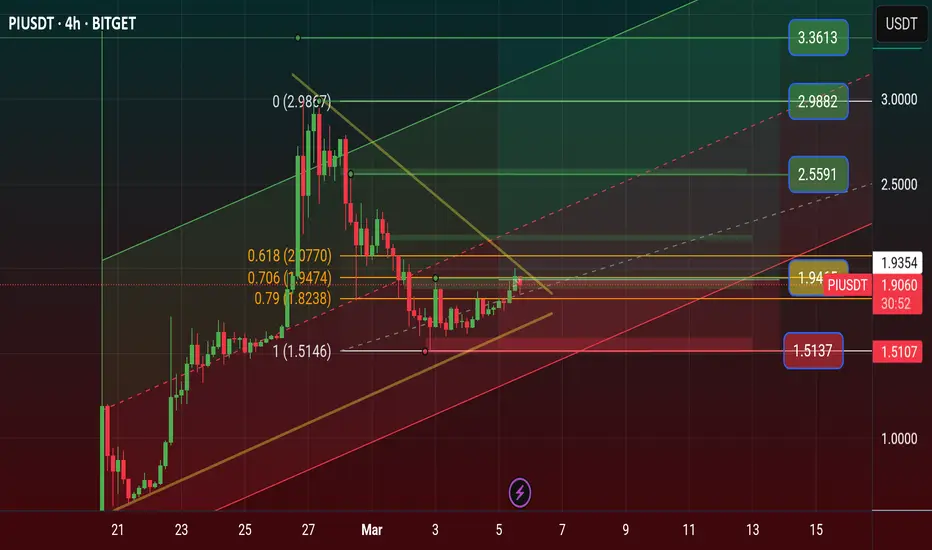
$PIUSDT Price Road to $11 Price Prediction 2025 Pi Network News: Can Pi Coin Price Hit $11? Key Levels Revealed, Pi Already Get place 11 of the Market.
Pi Network has gained 6.8% in the past 24 hours, outperforming major cryptocurrencies like Bitcoin (+7.5%), Ethereum (+8.9%), XRP (+11.1%), BNB (+9.8%), and Solana (+7.8%). But that’s not the real surprise.
Since its mainnet launch, PI's price has skyrocketed by an incredible 1,775.77%, while the overall crypto market has dropped by 11% in the same period. That’s a staggering contrast - and a sign that something big is happening.
With PI breaking key resistance levels and speculation about a major exchange listing growing, investors are wondering: How much higher can PI go? Could we see a breakout past $2? Let’s dive in.
💗 Why Is PI’s Price Rising?
Since February 20, PI has gained an incredible 1,775.75%, with a 7.5% jump in just the last 24 hours. This steady rise shows that Pi Network is moving independently of the broader market, maintaining strong momentum.
Key Reasons Behind PI’s Price Rally
Several factors are driving PI’s price increase:
Mainnet Migration Deadline Approaching
Pi Network is reaching its final deadline for users to migrate their holdings. According to a recent blog post from the team, March 17 is the last day to complete the migration. This deadline may be increasing buying pressure as investors prepare for the next phase.
🧡 Potential Binance Listing
Speculation around a Binance listing is another major factor. In a recent Binance community poll, over two-thirds of participants supported listing PI. If Binance or other major exchanges list it, the price could see a significant boost.
US Election Impact on Crypto
Donald Trump’s return to office is bringing a more crypto-friendly stance from the US government, which could benefit projects like Pi Network.
💝 Can PI Break $2.2?
Experts believe that if PI moves past the $2.2 resistance level with strong volume, it could rally toward $11. However, if it fails to break through, selling pressure could push it down to $1.5 Stoploss price area
To maintain its bullish trend, PI needs to hold support above $1.7. The price is currently just 1.11% below the key $2.2 level, making the next few days crucial in determining its next move.
🩷 Never Miss a Beat in the Crypto World!
Stay ahead with breaking news, expert analysis, and real-time updates on the latest trends in Bitcoin, altcoins, DeFi, NFTs, and more.
Pi Network has defied market trends and harsh criticism before, and if history is any guide, this rally might just be getting started.
🩵 Why Is Pi Coin’s Price Rising?
Pi Coin’s price is rising due to increasing exchange interest, migration deadlines, and strong community support, pushing demand higher.
💜 Nano History Will Pi Coin Reach $11?
If Pi breaks the $2 resistance with strong volume, experts predict a rally toward $11. Failure could lead to a drop below $1.5
💛 Is Binance Listing Pi Coin?
Binance has not officially listed Pi yet, but a recent community poll shows strong support, increasing the chances of a future listing.
$SOLUSDT Chart Say Finally Target Hit See on chart...BINANCE:SOLUSDT Chart Say Finally Target Hit See on chart...
Disclaimer: Digital asset prices are subject to high market risk and price volatility. The value of your investment may go down or up, and you may not get back the amount invested. You are solely responsible for your investment decisions and Binance is not available for any losses you may incur. Past performance is not a reliable predictor of future performance. You should only invest in products you are familiar with and where you understand the risks. You should carefully consider your investment experience, financial situation, investment objectives and risk tolerance and consult an independent financial adviser prior to making any investment.


Gap fillShort and sweet. Gap fill play on lucid with 01/2026 calls just incase it decides to squeeze

NVDA out of gas?H&S on the daily with 132.67 as the neckline. We also have another H&S that has played out and was followed by a double top, now failing once again under support. I'm in puts now with a stop-loss at 133. This is also where i would flip bias for potential squeeze at 133 after a backtest of 132.67

MU going for goldAt the third double bottom teasing 114.17 breakout to gap fill, it would be nice to see continuation here and what happens at 107.94 (monthly pivot). This one started with a breakaway gap September 25th and has recently filled the runaway gap, but the bullish trend is still intact from the current double bottom. I'm looking for 01/17/25 105c here, with a stop-loss at 99.05 (monthly pivot).

NZD/CAD Buy Opportunity Our market update already hit TP on NZD/CAD before with the sell position, which played out well. Now, we're shifting gears with a BUY possibility!
Entry: 0.82530
Take Profit: 0.84505
Stop Loss: 0.81089
This setup is based on a careful analysis of the current market conditions. As always, trade responsibly and manage your risk wisely! This is not financial advice.

KPGEL Diwali Pick 2024Stock Analysis and Trade Setup
This chart shows the stock breaking out of a long-term downward channel, suggesting a potential trend reversal:
• Bullish Setup : The price has broken above the descending channel, indicating bullish momentum. A strong consolidation above the support level around 631.1 could confirm this breakout. If the price maintains this upward trend, the next resistance at 716.75 would be the primary target, followed by further gains if momentum persists.
• Bearish Scenario : If the price fails to hold above 631.1, there could be a retest of lower levels. Watch for a potential short entry below the key support level at 525.9, as a breakdown could signal a continuation of the downtrend.
The RSI indicates room for further upside, and increasing volume supports the bullish breakout. Monitor these levels closely for entry and exit signals.
Disclaimer: This analysis is for educational purposes only. Please conduct your own research before making any trading decisions.

BITCOIN ONCE MORE ON THE RISE!!Hello and welcome back friends i have some exciting cooks for the next crypto PUSH of 2025.
Bitcoin is looking great despite the world events which is nothing more than a reason to set up bitcoin for its spring to the upside. After a war there's always profits once it resolves. Indicator (1). Donald T. Speculation if he wins it will push crypto, he is pushing a crypto narrative and wants to make the USA a BTC/Crypto Hub. Indicator (2). Banks are having innovation coming in 1-2 years through company SWIFT for adaptation of Digital Currency. Indicator (3). XRP just received greenlight for adaptation as one of DUBAI's currencies. Check your own facts so that you can correlate to this post as ive done my research to. Its just funny, as well as interesting to notice how the chart TELLS US where the market will go, and then the world events make it happen. Absolutely amazing to have conviction through these markets at these very moments we are in a bearish dip for BETTER BUYS. This baby will continue to pump thorugh 2025. Now..... For the Analaysis haha.
As we can see from the chart BTC seems to have a strong floor here at the 60,000 Price range. i have it marked up by a green textile box that price has a great level of support and resistance if you notice to the left. Currently sitting on the 0.236 of our Fibbs from a swing low to swing high out look, and as the jingle goes from low to high we're looking for buys at key levels of the fibb.
If she decides to dump a little further for reasons of war & fear, but as stated earlier thats actually a good thing for a higher push in economies. Black swan events despite being unfortunate bring prosperity in goods overtime. This level would be the 0.382 or price at 51,500 of BTC. this will be another VERY strong floor for BTC to quickly recover from notice the wick Monday 5 Aug. We're in for some Bullish runs team Lots of love keep yourselves well and DCA through this crypto market build your portfolios and HODL for 2025.

GBP/AUD TRADE IDEAVery important to wait for a clear break and retest of which direction the market is going to move.
this is the 30m timeframe. entrance would be at a 15m timeframe but we have to wait for a break of structure and retest.
patience is key here. no rush. trade can go either direction so we have to wait for a higher probability setup.
Most people are buying now due to the support line but i am waiting for a more clear entrance.

Alright $ETHUSD Traders It's Almost TimeCheck it out traders, and reference my other ideas in relation to how you could make this work for you.
$2500.... $2500.... $2500....
It's almost there, this is the point where the HODLing pays off, ignore this dip, it's a bull market, the pull back was healthy crypto needed it. Now, lets enjoy some consolidation ASMR and make some money.
- M1ndless
