USDCAD short term sell USDCAD broke and now is retesting a good S/R zone in which price bounced like 7+ times in the past 6-7 months.
Im selling here from 4H EMA and from this tight little zone formed from previous 4 touches. TP is the bottom of the leg, which gives plenty of room for the price to move
Moving Averages

Alight | ALIT | Long at $1.68Alight NYSE:ALIT is a cloud-based human capital technology provider that specializes in helping large organizations manage employee benefits, health, wealth, wellbeing, and related HR functions. It uses AI, data analytics, and personalized insights to improve employee experiences, boost engagement, and drive better outcomes for both employers and workers.
Technical Analysis:
The stock price entered, for the second time, my historical "crash" simple moving average zone. This area (green lines) is often a key location for share accumulation during algorithmic trading. While the lowest band is currently near $1.30 and trending lower (i.e. this is likely not officially bottom), it's a key zone for traders to consider entry for a potential bounce while leaving the emotions and guesswork at the door. But nothing is for certain in the stock market.
Insiders:
Significant buying and no selling through 2025: openinsider.com
Growth:
Modest rise in earnings per share and revenue expected between 2026 and 2028: tradingview.com
Health:
Debt-to-equity: 1x (just okay)
Quick ratio / ability to pay today's bills: 1.2 (just okay)
Altman's Z score / bankruptcy risk: 0.1 (high...)
Fair value: $8.00
Action:
While the price is at risk for heading into the low $1 range, I believe it is currently oversold based on the estimated fair value ($8), insider buying, and technical analysis. It's a risky play based on the financials and changing workforce, but it's a gamble that caught my attention. Thus, at $1.68, NYSE:ALIT is in a personal buy zone /starter position with potential for further declines near $1 - $1.30 in the near-term. Time will tell.
Targets into 2029
$2.00 (+19.0%)
$3.00 (+78.6%)

USD/CAD nine-day surge puts 50DMA in playUSD/CAD is enjoying its longest bullish streak since 2017, registering nine consecutive daily gains and breaking above the important 50DMA for the first time since early December. Given this level has repeatedly acted as support and resistance in the recent past, its proximity provides a decent level to build trades around, depending on how near-term price action evolves.
Even with the winning streak, the pair is not yet overbought on the daily timeframe on RSI (14), pushing further away from the neutral 50 level. MACD is on the cusp of flipping positive, having already crossed the signal line from below around the turn of the year, providing an overall picture of building bullish strength that favours buying dips over selling into strength despite the negative slope of both the 50 and 200DMAs.
Should USD/CAD manage to hold above the 50DMA, longs could be set targeting 1.4000, 1.4080 or the October high of 1.4140, depending on desired risk-reward from the setup. A stop beneath the 50DMA, 1.3900, or 200DMA would offer protection against reversal.
Alternatively, should the pair be unable to hold above the 50DMA, the setup could be flipped with shorts established beneath the level with a stop above for protection, targeting either 1.3900, 200DMA, 1.3800, 1.3725 or the December low of 1.3642.
Beyond technicals, USD/CAD has shown an increasingly strong relationship with shifts in market pricing for Fed rate cuts this year and moves at the front end of the U.S. interest rate curve, putting this week’s U.S. December consumer price inflation report in focus as a key risk event. Possible announcements surrounding the legality of the Trump Administration’s reciprocal tariffs and the replacement for Jerome Powell as Federal Reserve chair add an extra layer of complexity when assessing potential setups, ensuring risk management should be top of mind for anyone trading USD/CAD this week.
Good luck!
DS

Sol Leads CrossChain Flows Dominates Weekly Crypto ActivitySolana has become the superior blockchain in cross-chain capital movement. In the course of the previous week, the percentage of bridged and purchased tokens attributed to CRYPTOCAP:SOL was almost 67.8. This domination makes Solana way ahead of rival networks. The network remains popular among traders and users due to its speed and cost effectiveness. The confidence in the Solana infrastructure is reflected in capital rotation into it. The statistics show active trading and not sporadic speculation. The industry players are also evidently moving towards Solana as a settlement layer of choice.
Real Network Demand is Signaled by On-Chain Growth
The dominance of Solana is not limited to token bridging. The network activity is still increasing in several metrics. In the last year, the application revenue has hit the new heights. The supply of stablecoins in the network was growing. There was also a great increase in decentralized volumes of exchange. These indications point to the organic ecosystem development. Solana has developers who are working. Users are still making transactions on a daily basis. This continuous use confirms the status of Solana as a high-performance blockchain.
The Institutional Interest Enforcement Lends Solana more strength
The contribution of institutional adoption to the growth of Solana increases. SOL is becoming the preferred platform and used for quick execution and scaling operations by funds and platforms. The network is also efficient in terms of throughput. This renders it appropriate to large scale financial applications. Reliability and speed are important to institutions. Solana does not disappoint on either side. Such a consistent stream of institutional attention makes the network grow story more stable.
2026 Adds Momentum on a Long-term Basis
In the future, a number of stories justify the optimism that Solana has. Systems On-Chain AI agents are starting to communicate with systems. Assets tokenization in the real world keeps on gaining momentum. There is the growth of prediction markets and stablecoin payments. There is also an ecosystem development of privacy-oriented tools. The trends are in line with the technical strength of Solana. The network establishes itself as a base of automated and machine driven economies. The momentum keeps on growing as more people embrace it.

MARKET STRUCTURE CONTINUATION (temp. reversal)-The market is givng a clear setup here for short term sells.
-Im trying not to over think anything especially with external geo-political factors(which is just noise whch can temporarily voilate my setup)
-On a lower tf the market gave a clean SM setup & is currently in a daily OB for sells just waiting on a full & clean mitigation after clearing of obvisous liquidity/internal triple top. Due to liquidity being in the upside & downside i am also expecting a sweep that can create an new ATH (cause by the noise from geo-political news).
-Either option im waiting for the reaction to happen & entrying once its given me clear confirmation to enter. I am looking for sells; either short sells to my 4H POI to then push higher for buys after either liquidity sweep that will happen at the top or to my D.POI to then continue our buys or to re-evaluate our setup.
-Low probability is buy continuations without the market revisiting my POI's.
-Lets see.

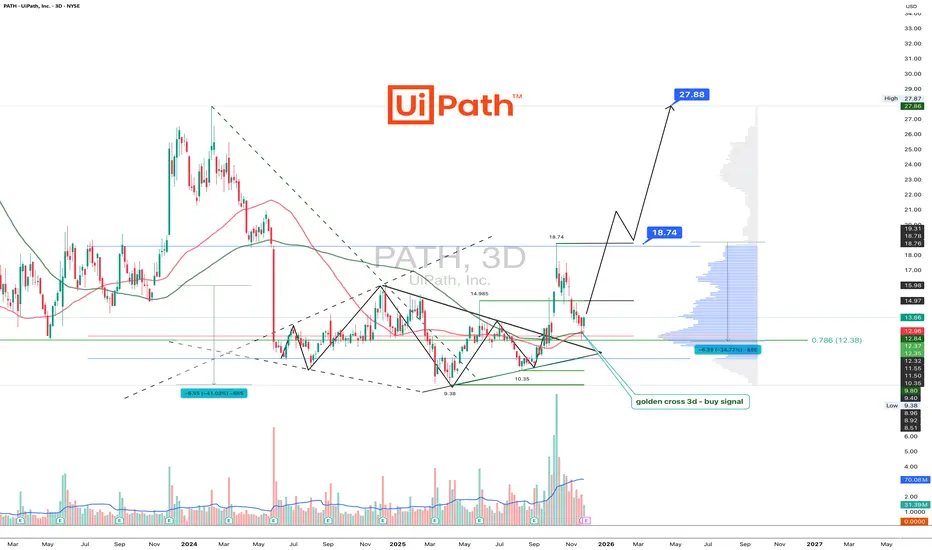
UiPath automates workflows and apparently the chart tooPATH pretends nothing happened after a perfect diamond breakout
PATH is trading at 13.86 after the diamond pattern completed a clean breakout toward 18.74 and shifted into a corrective phase. The pullback landed precisely in the Fibonacci 0.786 zone between 12.00 and 12.50 where a clear demand area formed. Buyers reacted sharply and the three day chart printed a golden cross through the MA50 crossing the MA100 which strengthens the bullish scenario.
As long as price holds above 12.00 the structure remains bullish. The next confirmation level sits at 14.97. A solid close above this zone opens the path back to 18.74 and later to the extended target at 27.88 where higher timeframe liquidity is located.
Fundamentally UiPath continues to show strength as of November 29 2025. Annual revenue exceeds 1.55 billion dollars which reflects a near 15 percent year over year increase. Gross margin stays near 83 percent indicating high operational efficiency. Cash reserves are above 1.7 billion dollars which keeps the balance sheet among the strongest in the automation sector. Customer growth remains steady across banking telecommunications and public sector clients. The transition to subscription based models continues to improve the predictability of cash flows. The main risk remains sensitivity of enterprise budgets in slow economic cycles.
The reaction to the 12.00 support confirms solid demand. Holding above this zone keeps the bullish scenario active with targets at 18.74 and 27.88. If buyers reclaim 14.97 the trend could accelerate quickly.
Automation removes friction from business processes and sometimes the chart removes friction for traders. Fibonacci and MA100 hint louder than words.
USD/JPY Hits Yearlong Highs. Is Intervention Imminent?USD/JPY is trading higher today as market attention has shifted sharply to the U.S. jobs report released this morning. December payrolls came in softer than expected, with just 50,000 jobs added, reinforcing a view that the Federal Reserve doesn’t have enough information just yet to push ahead with another rate cut. Despite the weaker job gain, the unemployment rate ticked lower to 4.4%, giving the U.S. Dollar support and lifting the currency against the Japanese Yen.
On the Japan side, uncertainty around the Bank of Japan’s next steps continues to weigh on the Yen. Recent commentary from BOJ officials suggests caution on further tightening even as domestic consumption trends improve, which reinforces the policy divergence with the United States and keeps the Yen under pressure. With broader risk sentiment stable and the greenback finding bids on U.S. macro data, USD/JPY remains elevated as traders digest today’s labor figures and await further cues on monetary policy – not to mention the increased risk of intervention due to the sharp deterioration in the Yen’s standing.
In the above chart, USD/JPY rates have pushed through the November and December highs, maintaining their steep uptrend from the October and December swing lows. The move to test the 2025 high at 158.88 is gathering pace, with 5-day exponential moving average (EMA), 20-day EMA, 50-day EMA, and 100-day EMA having positive rates of change. A move through the 2025 high and into the 160s could precipitate greater chatter, if not outright intervention, from Japanese officials about intervention.

RSI Oversold: Statistical Comparison on H4 TimeframeDAX is currently showing extreme momentum conditions on H4, with RSI levels comparable to previous historical cases (green circles).
However, unlike past occurrences, the current setup is not characterized by a single oversold spike, but by a prolonged RSI extreme over time.
Historically, persistent momentum exhaustion has tended to produce deeper and more sustained corrective phases, rather than fake or shallow pullbacks.
For this reason, the current structure favors a multi-leg, structurally bearish correction, rather than a temporary retracement.
📉 Expected price sequence (SHORT)
Test of the ascending trendline around 24,800
Technical bounce towards 25,000 – 25,050
Trendline retest followed by a confirmed bearish breakout
Start of the main short leg
🎯 Downside targets (grey horizontal levels)
TP1: 24,780 – 24,650
TP2: 24,480 – 24,450
⏱ Timing
Based on RSI statistical comparison, a market bottom is expected between late January and mid-February.
🧠 Conclusion
This setup is STRICTLY SHORT-biased.
Price action suggests distribution and bull trap dynamics before the final bearish continuation.

Dr. Reddy's Bearish view
This setup is based on a clean break of the prior pivot low around the level (₹1,246.61), confirming bearish momentum. Defined short entry zone just below ₹1,241.09, aligning with a weekly supply zone from the higher timeframe.
The zone confluence with a weekly 50 EMA also.
🔻 Entry: Short on retracement into the supply zone
🛡️ Stop Loss: Above the zone with a buffer of 15% DATR
🎯 Target: 1:3 Risk-Reward, aiming toward the ₹1,200 region
⚠️ Caution: Profit booking advised near the weekly demand zone and the orange-shaded caution area
This trade respects multi-timeframe confluence and risk management principles. Ideal for traders seeking structured short opportunities with clear invalidation and reward zones.

CVS: Will The Snooze Continue?CVS Health has been hibernating all winter, but some traders may think its snooze is ending.
The first pattern on today’s chart is the bearish gap on October 30, one day after earnings beat estimates. The stock had rallied into the report, so the decline may have been a case of “selling the news.”
Second, CVS spent two months stuck below the gap but it’s been recently pushing back above that level. Is resistance breaking?
Third, CVS has formed a potential basing pattern. Bollinger Bandwidth shrank to the narrowest range in more than two years. That period of compression may create potential for price expansion.
Next, the 8-day exponential moving average (EMA) is above the 21-day EMA and MACD is rising. Those signals may reflect a bullish short-term trend.
Finally, the 50-day simple moving average (SMA) is above the 100-day SMA. Both are above the 200-day SMA. That kind of sequence, with fast SMAs above slower ones, may reflect a bullish long-term trend.
TradeStation has, for decades, advanced the trading industry, providing access to stocks, options and futures. If you're born to trade, we could be for you. See our Overview for more.
Past performance, whether actual or indicated by historical tests of strategies, is no guarantee of future performance or success. There is a possibility that you may sustain a loss equal to or greater than your entire investment regardless of which asset class you trade (equities, options or futures); therefore, you should not invest or risk money that you cannot afford to lose. Online trading is not suitable for all investors. View the document titled Characteristics and Risks of Standardized Options at www.TradeStation.com . Before trading any asset class, customers must read the relevant risk disclosure statements on www.TradeStation.com . System access and trade placement and execution may be delayed or fail due to market volatility and volume, quote delays, system and software errors, Internet traffic, outages and other factors.
Securities and futures trading is offered to self-directed customers by TradeStation Securities, Inc., a broker-dealer registered with the Securities and Exchange Commission and a futures commission merchant licensed with the Commodity Futures Trading Commission). TradeStation Securities is a member of the Financial Industry Regulatory Authority, the National Futures Association, and a number of exchanges.
TradeStation Securities, Inc. and TradeStation Technologies, Inc. are each wholly owned subsidiaries of TradeStation Group, Inc., both operating, and providing products and services, under the TradeStation brand and trademark. When applying for, or purchasing, accounts, subscriptions, products and services, it is important that you know which company you will be dealing with. Visit www.TradeStation.com for further important information explaining what this means.

GENM.TO — Swing Trade Idea (TSX)💰 GENM.TO — Swing Trade Idea (TSX)
🏢 Company Snapshot
• Generation Mining is a Canadian development-stage miner advancing the Marathon Palladium-Copper Project in Ontario.
• Setup matters now as the stock digests a sharp momentum leg within a broader uptrend tied to renewed interest in PGM/base metals.
📊 Fundamental Context (Trade-Relevant Only)
• Valuation: Project-stage valuation — trades on asset optionality rather than earnings; leverage to metal prices.
• Balance Sheet: No material revenue yet; financing risk remains but recent activity suggests adequate near-term liquidity.
• Cash Flow: Negative by nature; catalyst-driven rather than cash-flow-driven.
• Dividend: None.
Fundamental Read: Fundamentals neither block nor drive the trade — this is a pure technical swing within a commodity-linked name.
🪙 Industry & Sector Backdrop
• Short-Term (1–4 weeks): Metals & mining showing selective rotation into developers after Q4 strength.
• Medium-Term (1–6 months): Volatile but improving relative strength vs TSX when metals bid.
• Macro Influence: Palladium/copper pricing and risk-on sentiment remain key drivers.
Sector Bias: Neutral-to-Bullish (tactical).
📐 Technical Structure (Primary Driver)
• Trend: Price remains above rising 50-SMA (~0.67) and well above 200-SMA (~0.42) — primary uptrend intact.
• Momentum: RSI(2) has reset from overbought into the 50–60 zone, consistent with a buyable pullback, not trend failure.
• Pattern: Pullback into prior breakout zone after a momentum expansion toward ~0.95.
• Volume: Recent selloff occurred on elevated volume — needs confirmation of selling exhaustion before entry.
Key Levels
• Support: 0.66 – 0.60 (50-SMA + prior range high)
• Resistance: 0.95 – 1.00 (December spike high / psychological)
🎯 Trade Plan (Execution-Focused)
• Entry: 0.60 – 0.66 on stabilization or bullish daily close (support reclaim).
• Stop: 0.58 (clean loss of breakout support + 50-SMA).
• Target: 0.95 (prior high / measured swing).
• Risk-to-Reward: ~2.8R.
Alternate Scenario:
• Failure to hold 0.60 opens a deeper pullback toward 0.50 (prior base). No long bias below 0.58 — trend structure compromised.
🧠 Swing Trader’s Bias
Price is in a confirmed higher-timeframe uptrend, pulling back into confluence support with momentum reset. Looking for a controlled reaction off the 0.60–0.66 zone to re-engage toward prior highs for a ≥2R swing. A decisive breakdown below 0.58 invalidates the setup.

Put Sale MSFTI wan to own at the 200SMA. If drops, its a great bouncing are, but if MSFT decides to keep its way up, then I'll keep premium :)

BTCUSD – DailyBitcoin (BTCUSD) has corrected sharply after a strong rally toward 120K+, and is now forming a higher low structure.
Price is currently compressed between:
• An ascending trendline
• A major horizontal resistance near 94,000
→ Ascending triangle / compression structure
Key Levels
• Dynamic Support:
Ascending trendline (87,000 – 88,000)
• Major Static Support:
85,000 – 86,000
• Key Resistance:
93,500 – 94,500
• Next Resistance:
98,000 → 102,000
Bullish Scenario (Primary)
If price:
• Closes above 94,500 (daily close)
• Confirms the breakout with a retest
➡️ Bullish continuation becomes likely.
Upside Targets:
98,000 → 102,000 → 110,000
Invalidation / Stop:
Daily close below 87,000
Bearish Scenario (Alternative)
If price:
• Breaks below the ascending trendline
• Closes under 87,000
➡️ Deeper correction is likely.
Downside Targets:
85,000 → 81,000
Bearish Invalidation:
Acceptance above 94,500
Final Takeaway
BTC is at a critical decision zone.
A breakout above 94K favors continuation, while losing 87K signals further downside.

Cipher Mining(CIFR) 1D: compression before expansionCipher Mining is a US-listed Bitcoin mining company with direct exposure to the BTC cycle and infrastructure scalability.
On the daily chart, price is forming a symmetrical triangle after the prior impulse. The key decision zone sits around 15, where the 0.786 Fibonacci level, diagonal support, MA100 and volume profile align. This area defines the execution zone, while direction is confirmed by higher timeframes.
Direction comes from the higher timeframes. On the weekly and monthly charts, indicators maintain a bullish configuration: moving averages are rising and positioned below price, the broader structure remains intact, and oscillators stay neutral-bullish with no reversal signals. This confirms that the current daily consolidation is occurring within a larger bullish context. The daily MA100 acts as dynamic support inside the range, strengthening the importance of the 15 level.
The base scenario assumes support holding at 15 followed by an upside breakout from the triangle. Initial targets sit near 20.5, followed by 25.5. A decisive breakdown below 15 invalidates the setup.
Fundamentally, CIFR remains a cyclical mining play. Revenue remains elevated, with the next quarterly estimate around $88M. EPS is still negative and free cash flow remains under pressure, which is typical during expansion phases. Strong financing inflows help support liquidity and ongoing infrastructure growth. The stock remains a leveraged bet on Bitcoin continuation.
In short: daily defines the entry, weekly and monthly define the direction.

Gold to $6000 !?Gold is holding above all supports on different time frames. We may see a correction to sub-4K, but it will very likely rise again to 6000 in the next few months.

GBP/USD Slumps Towards Two-Month Trend SupportGBP/USD is trading lower on the day as sterling comes under renewed pressure from soft U.K.-specific fundamentals and lingering uncertainty around the economic outlook. The pound weakened as investors continued to digest the Bank of England’s more dovish stance following last year’s rate cut, with markets increasingly pricing further easing as growth momentum cools. While broader risk sentiment has been relatively stable, sterling has underperformed peers as domestic concerns take precedence.
UK data and commentary continue to point to a fragile growth backdrop, particularly in interest-rate-sensitive sectors such as housing and construction, reinforcing expectations that the BOE will prioritize supporting activity over guarding against inflation. With little in the way of positive domestic catalysts today, GBP/USD has been driven lower by relative policy expectations, leaving the pound vulnerable as markets look ahead to upcoming U.K. data and further guidance from the BOE.
In the above chart, GBP/USD has retraced about half of its gains this week in the past two sessions, leaving the pair effectively unchanged for 2026. At first blush, the retracement would appear to be a correction within a modest uptrend since late-November, buttressed by positive slopes in each of the 20-day, 50-day, and 100-day exponential moving averages (EMA). A drop below 1.3400, however, would see the series of higher highs and higher lows over the past six weeks negated, concurrently representing a break below the 20-day EMA. Should GBP/USD trade above 1.3600 by the end of the month, traders may find a symmetrical triangle breakout taking shape.

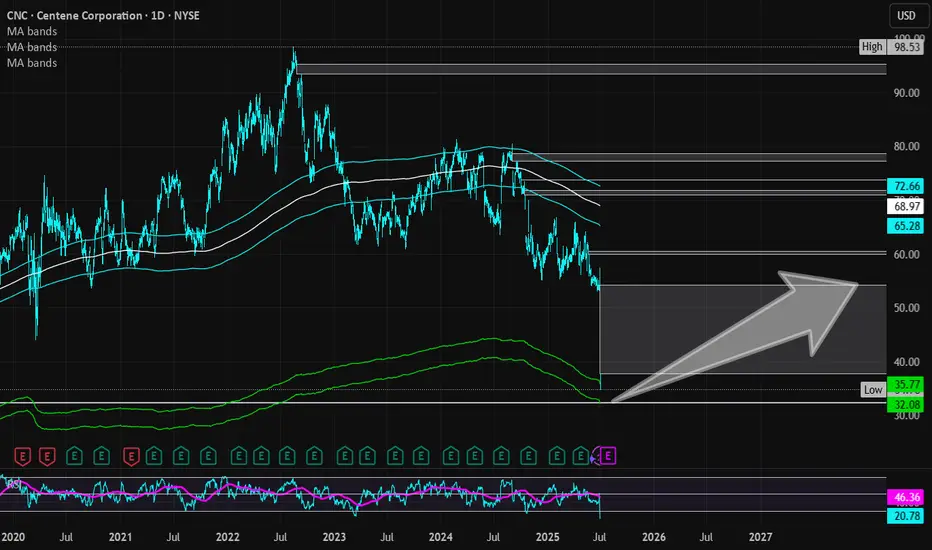
Centene Corp | CNC | Long at $35.00Centene Corp NYSE:CNC is a healthcare enterprise providing programs and services to under-insured and uninsured families, commercial organizations, and military families in the U.S. through Medicaid, Medicare, Commercial, and other segments. The stock dropped almost 40% this morning due to recent challenges, such as a $1.8B reduction in 2025 risk adjustment revenue and rising Medicaid costs (leading to withdrawal of 2025 earnings guidance). However, the company has a book value near $56, debt-to-equity of 0.7x (healthy), a current P/E of 5x, and a forward P/E of 9x.
It may be a few years before this stock recovers. But the price has entered my "crash" simple moving average area (currently between $32 and $36) and there is a price gap on the daily chart between $32 and $33 that will likely be closed before a move higher. Long-term, and potentially a new political administration, new life may enter this stock once again as the baby boom generation requires more healthcare services. But holding is not for the faint of heart...
Thus, at $35.00, NYSE:CNC is in a personal buy zone with a likely continued dip into the low $30s or high $20s before a slow move higher (where I will be accumulating more shares). Full disclosure: I am also a position holder in the $60s and cost averaging down.
Targets into 2028:
$45.00 (+28.6%)
$54.00 (+54.3%)
Cross.Wow. Ichimoku shows us a classic "bad cross" from the Kijun and Tenkan lines.
With a high degree of probability, the asset is awaiting a strong correction.

Philip Morris (PM – Daily)
Philip Morris (PM) has completed a strong medium-term uptrend and entered a descending corrective channel.
This move appears to be a healthy structural correction, not a trend reversal.
Key observation:
• Price has broken above the descending channel
• Currently retesting the breakout zone
→ Classic break-and-retest behavior
Key Price Levels
• Key Support:
154 – 156
• Major Support:
148 – 150
• Immediate Resistance:
160 – 162
• Next Resistance:
168 → 172
Bullish Scenario (Primary)
If price:
• Holds above the 154–156 zone
• Shows bullish continuation from the retest
➡️ Corrective phase is complete and trend continuation is likely.
Upside Targets:
160 → 168 → 172
Invalidation / Stop:
Daily close below 148
Bearish / Failed Breakout Scenario
If price:
• Fails to hold above 154
• Falls back inside the descending channel
➡️ A deeper corrective move toward the channel lows becomes likely.
Downside Targets:
148 → 142
Bearish Invalidation:
Strong acceptance above 160
Final Takeaway
PM is transitioning from correction to potential continuation.
Holding above 154 keeps the bullish bias intact.

NYSE: ZETA— Swing Trade Idea (Gap Up Continuation)💰 ZETA — Swing Trade Idea (Gap Up Continuation)
🏢 Zeta Global Holdings Corp. (NYSE: ZETA)
🏢 Company Snapshot
• Zeta Global provides AI-driven customer data and marketing analytics software
• In focus due to renewed momentum in AI / data infrastructure names and strong post-gap price acceptance
📊 Fundamental Context (Trade-Relevant Only)
• Valuation: Premium vs traditional SaaS peers, justified by AI exposure and revenue growth
• Balance Sheet: Manageable debt, no near-term liquidity stress
• Cash Flow: Improving operating leverage as scale increases
• Dividend: None (growth-focused)
Fundamental Read: Fundamentals support trend continuation but are not the catalyst — price and volume are the drivers.
🪙 Industry & Sector Backdrop
• Short-Term (1–4 weeks): Data / AI software showing relative strength vs SPX
• Medium-Term (1–6 months): Growth tech recovering leadership after prolonged compression
• Macro Influence: Rates stabilizing → supportive for higher-multiple software
Sector Bias: Bullish
📐 Technical Structure (Primary Driver)
• Trend: Price reclaimed and is holding above 50-SMA and well above rising 200-SMA
• Gap Behavior: Clean bullish gap with strong volume expansion and no immediate fill attempt
• Pattern: Gap-and-go into prior resistance → now acting as potential support
• Volume: Expansion on the gap confirms institutional participation
Key Levels
• Support: 22.10 – 22.40 (gap support / breakout retest zone)
• Resistance: 24.80 – 25.20 (measured move / prior supply zone)
🎯 Trade Plan (Execution-Focused)
• Entry: 22.80 – 23.10 on controlled pullback or tight consolidation above gap low
• Stop: 21.95 (loss of gap support + failure back into range)
• Target: 25.00
• Risk-to-Reward: ~2.4R
Alternate Scenario:
If price holds above 23.40 with no pullback, continuation entry on a high-tight flag breakout is valid with reduced size and tighter stop.
🧠 Swing Trader’s Bias
Bullish bias as long as price holds above gap support and the 50-SMA. Looking for acceptance above prior resistance to target a continuation leg toward the mid-$25s. A decisive close below 22.00 invalidates the setup.

Possible XLM PumpIt's looking bullish on multiple charts, but I'm gonna focus on the ETH one as it has a consistent top. This is a short term trade, once it pumps we'll be out not too long after. Currently bouncing off of the 200SMA on the weekly and holding steady.

Hasboro | HAS | Long at $66.00Hasboro $NASDAQ:HAS. Bouncing in an out of the historical simple moving average (SMA). While it may take a bit for it to spring out and continue its upward trend, it looks poised to do so. However, there is a small price gap that was never closed in the $40's that investors should stay cautious of if the downward trend continues. But a "confirmation" of a reversal will be either a continued move up or a retest of the lower historical SMA band (to close the recent price gaps) followed by a further move up. Fundamentally, NASDAQ:HAS has a high level of debt, but earnings growth is forecasted in its future. At $66.00, $ NASDAQ:HAS is in a personal buy zone, but patient investors may wish to wait for further confirmation of a reversal.
Target #1 = $73.00
Target #2 = $81.00
Target #3 = $87.00
Target #4 = $119.00 (very long-term...)
