MICROSOFT on a short-term rebound before drop to $410.Around 3 months ago (November 06 2025, see chart below) we gave a Sell Signal on Microsoft (MSFT) targeting $450:
The signal was confirmed and the target got hit last week, with the price immediately rebounding as it hit the 0.5 Fibonacci retracement level from the April 07 2025 Low.
This Low was also formed on the 1W MA100 (green trend-line) and based on the long-term Channel Up pattern that has been in effect for the past +4 years, is a natural technical rebound made half-way through a Bearish Leg.
Both previous Bearish Legs experienced similar rebounds when the 1W RSI hit (or approached) the 40.50 Symmetrical Support level and later resumed the dominant bearish trend. As you can see all Bearish Legs are in the form of a (red) Channel Down.
Once the bearish trend is resumed, we expect this Leg to seek the 1W MA200 (orange trend-line), which is currently exactly at the bottom of the 4-year Channel Up and is where both previous Bearish Legs priced their bottoms on April 07 2025 and October 21 2022.
Assuming a minimum -26.20% decline (like the previous Leg) and not a -38.88% of the first one, we are targeting at least $410 next.
---
** Please LIKE 👍, FOLLOW ✅, SHARE 🙌 and COMMENT ✍ if you enjoy this idea! Also share your ideas and charts in the comments section below! This is best way to keep it relevant, support us, keep the content here free and allow the idea to reach as many people as possible. **
---
💸💸💸💸💸💸
👇 👇 👇 👇 👇 👇
Microsoft (MSFT)

Salesforce Wins $5.6B Army Deal: AI & Strategic AnalysisAn in-depth analysis of Salesforce’s $5.6B U.S. Army contract and its multi-domain impact on CRM stock.
Geostrategy and Geopolitics: The Defense Pivot
Salesforce effectively entered the hard-power arena with its $5.6 billion U.S. Army contract. This move transcends typical software procurement. It signals a strategic alignment between Silicon Valley innovation and national security imperatives. The Pentagon, now emphasizing an "AI-first" warfighting stance, requires robust commercial partners. Salesforce’s "Missionforce" initiative directly addresses this geopolitical need. By securing this foothold, Salesforce mitigates risks associated with purely commercial market fluctuations. The deal positions the company as a critical infrastructure provider for the Department of Defense. This geopolitical integration offers a long-term hedge against global economic instability.
Business Models and Economics: The IDIQ Structure
Investors must scrutinize the "indefinite-delivery, indefinite-quantity" (IDIQ) nature of this agreement. While the $5.6 billion headline figure grabs attention, it represents a ceiling, not guaranteed revenue. The actual economic value depends entirely on the velocity of task orders. This business model shifts the focus from immediate bookings to long-term consumption utility. Analysts note a transition from buying software to "orchestrating outcomes at scale." Consequently, revenue recognition will likely trickle in rather than surge. This structure demands patience from shareholders expecting immediate quarterly spikes.
Technology and High-Tech Innovation: Agentic AI
The core value proposition lies in "Agentic AI." Salesforce aims to deploy autonomous agents that streamline logistics and decision-making. This technology leapfrogs traditional static dashboards. The Army contract specifically targets the unification of disparate data sources. By creating a "trusted data fabric," Salesforce lays the groundwork for advanced AI deployment. This focus aligns with the Pentagon’s broader GenAI.mil initiative. Success here proves that Salesforce’s AI tools work in high-stakes, chaotic environments.
Industry Trends and Competition
The government IT sector remains a crowded battlefield. Microsoft and Oracle traditionally dominate this space, while Palantir commands the data analytics niche. Salesforce’s entry disrupts this oligopoly. The contract validates Salesforce’s ability to compete for massive federal allocations. It challenges the assumption that CRM tools lack the robustness for defense applications. This trend suggests a blurring line between enterprise customer service tools and military-grade logistics. Salesforce is aggressively carving out market share from established defense contractors.
Management and Leadership: Strategic Alignment
Salesforce leadership executed a precise pivot toward the public sector. Kendall Collins, CEO of Missionforce, effectively operationalized this strategy. This leadership success highlights an adaptive corporate culture capable of navigating complex federal procurement. Furthermore, alignment with Defense Secretary Pete Hegseth’s "AI-first" vision demonstrates high-level strategic synergy. Peter Lington, VP for the Department of War business, emphasizes data as a "strategic asset." This coherent messaging between corporate executives and Pentagon leadership instills market confidence.
Cyber Security and Data Sovereignty
Security remains the linchpin of this deal. The Army requires absolute trust in its data before unleashing autonomous agents. Salesforce’s "Computable Insights" subsidiary addresses these specific security mandates. The emphasis on a "Modular Open-Source Approach" (MOSA) reduces vendor lock-in risks. It also forces Salesforce to prove its cybersecurity resilience constantly. Any breach would jeopardize not just the contract, but the company's entire federal reputation. Therefore, cybersecurity excellence acts as the primary gatekeeper for realizing the contract’s full value.
Macroeconomics and Market Sentiment
Salesforce shares ticked up 0.6% to $229.40 following the news. This muted reaction reflects investor caution regarding the macroeconomic environment. High interest rates continue to pressure tech valuations. Traders currently weigh the "hype" of AI against tangible book orders. The upcoming February 25 earnings report becomes the critical litmus test. The market demands proof that federal wins effectively counter broader economic slowdowns. Until then, the stock likely remains range-bound, waiting for concrete revenue data.
Patent Analysis and Science
The underlying science of this deal rests on data unification and API orchestration. Salesforce must leverage its intellectual property to connect legacy military systems. This requires advanced patent-protected methods for data ingestion and normalization. The "Golden Record" concept, a single source of truth, relies on sophisticated algorithmic reconciliation. Future patent filings will likely focus on "Agentic" behaviors and secure government cloud architectures. This intellectual property moat protects Salesforce from competitors seeking to clone its government-specific solutions.

MSFT Microsoft Corporation Options Ahead of EarningsIf you missed buying MSFT when they took a 49% stake in OpenAI:
Nor sold the recent double top:
Now analyzing the options chain and the chart patterns of MSFT Microsoft Corporation prior to the earnings report this week,
I would consider purchasing the 475usd strike price Calls with
an expiration date of 2026-2-20,
for a premium of approximately $14.60.
If these options prove to be profitable prior to the earnings release, I would sell at least half of them.

MSFT: Seller maintains control of the initiativeHi traders and investors!
While the monthly candle has not yet closed (around 5 days remain until the close), on the 14-day timeframe the seller candle from January 2 closed within the seller’s initiative.
This means that the seller has pushed the price back into the range on this timeframe.
Notably, this candle has the largest volume since March 2025, which gives grounds to expect a continuation of the seller’s initiative.
At the same time, the first target — the 50% level of the trading range at 450.12 — has already been reached. From here, we continue to monitor how the situation develops.
Now let’s look at the daily timeframe:
A seller initiative is present. At the lower boundary of the latest seller initiative, there was a seller candle with strong volume, which was then absorbed by an even larger buyer volume. Under normal conditions, this could suggest a potential continuation of the buyer’s move.
However, there is an important nuance: in this buyer candle, the key volume was accumulated in the upper part of the candle, above the start of the seller initiative at 463.15 (marked by the blue band on the chart). This structure may also indicate a bull trap.
Where it makes sense to look for long-term buying opportunities was outlined in the previous review.
Profitable trades!
This analysis is based on the Initiative Analysis (IA) method.

Stock Market Forecast | BTC TSLA NVDA AAPL AMZN META MSFTStock Market Forecast | CRYPTOCAP:BTC TSLA NVDA AAPL AMZN META MSFT
SP:SPX CME_MINI:ES1! CME_MINI:NQ1!
Weekly stock market analysis covering the S&P 500 (SPY), Nasdaq 100 (QQQ), Bitcoin (BTC), and major large-cap stocks. In this video, we break down technical charts, key support and resistance levels, sector rotation, market sentiment, dark pool activity, earnings, and macroeconomic data to identify high-probability market scenarios for the week ahead.
Timestamps are included below so you can jump directly to specific tickers and chart analysis.
0:00 Intro & Market Overview
0:58 Sector & Sentiment Data
2:10 MAG 7 ETF / Dark Pools
5:12 ARK / Innovation & Small Caps
6:34 Earnings & Economic Calendar
8:44 S&P 500 (SPY)
12:12 Nasdaq 100 (QQQ)
15:22 Bitcoin (BTC)
22:15 Tesla (TSLA)
25:00 Meta (META)
26:30 Amazon (AMZN)
28:00 Microsoft (MSFT)
32:58 Google (GOOGL)
36:27 Apple (AAPL)
39:38 Nvidia (NVDA)
42:40 Outro

MICROSOFT Hit a WALL. DOUBLE TOPPED and WILL DROPPrice action has confirmed and triggered a double top pattern.
Calling tops in tech is dangerous as we all know.
But as Tech fatigue hits, and selloffs quicken, the risk of a deeper shakeout increases.
Remember US stock market is 230% of GDP.
With increasing Job Losses.

$MSFT Microsoft Potential BUY/Support AreasNASDAQ (NQ) did not have a good start to the new year. It has been hitting lows after lows so far and yet to make a proper 2026 high. This downward correction is being reflected in nearly all major tech stocks.
MSFT (Microsoft) clearly created a double top while running inside and touching upper end of a channel. It is now retracing and can possibly come to one of the support areas/levels which can act possible targets for shorts and levels for buys.
As the channel is upwards, this can be good retracement for buy opportunities and if NASDAQ makes anew high, it can pull MSFT higher to new highs too.
Lets wait and watch and always this is not and advice but just an observation. Risk management is extremely important as always.

SPY 20JAN 2026 READ DESCRIPTIONSpy is about to hit this level. Just be careful if you are short.
Market can easily bounce and go up from here.
I am travelling and will try to update spy weekly asap.

Microsoft. Great business. Tough tape.Microsoft came into the year priced for AI dominance and flawless execution. The business still delivers. The stock does not have the same margin for error. Rallies into the 430–440 zone have failed. Buyers hesitate. Sellers appear. That tells you expectations are heavy.
The OpenAI advantage is narrowing at the margin. Models are commoditising faster than the market expected. Compute is expensive but available. Distribution still matters, and Microsoft owns it, but narrative premiums are compressing. That hits multiples, not revenues.
Capex is the next pressure point. Data centre spend is enormous and visible. Investors are no longer waving it through. They want returns, timelines and proof. Add political and social scrutiny around power usage and infrastructure and the risk premium rises.
There is also internal tension. AI boosts productivity but threatens parts of Microsoft’s legacy software economics. Copilot is strategic. It is also cannibalistic. Transitions like that are rarely clean in the eyes of the market.
Competition matters too. Alphabet is executing better. The gap story is fading, even if Microsoft remains the enterprise leader.
If 400 breaks, momentum traders step away and 370 becomes the natural magnet . That is where longer-term investors may return.
Microsoft remains a great business. This year, it is a crowded trade adjusting to reality. The stock feels like digestion, not discovery.
The forecasts provided herein are intended for informational purposes only and should not be construed as guarantees of future performance. This is an example only to enhance a consumer's understanding of the strategy being described above and is not to be taken as Blueberry Markets providing personal advice.

Stock Market Forecast | BTC TSLA NVDA AAPL AMZN META MSFT0:00 Intro & Overview
0:22 Sector Data & Sentiment
2:42 Dark Pools (RSP & MAG7)
6:44 S&P 500 (SPY)
9:21 Nasdaq 100 (QQQ)
11:37 Bitcoin (BTC)
15:04 Tesla (TSLA)
18:17 Meta (META)
22:03 Amazon (AMZN)
23:25 Microsoft (MSFT)
26:54 Google (GOOGL)
31:16 Apple (AAPL)
34:58 Nvidia (NVDA)
37:26 Outro
Stock Market Forecast | BTC TSLA NVDA AAPL AMZN META MSFT
SP:SPX AMEX:SPY CME_MINI:ES1! CME_MINI:NQ1!

Microsoft (MSFT) shares fall below $460Microsoft (MSFT) shares fall below $460
As the Microsoft (MSFT) share chart shows:
→ yesterday’s candle closed below $460 — the lowest level since early June last year;
→ the decline from the all-time high near $550 has exceeded 16%.
Why MSFT shares are falling
The downward move may reflect a shift in market sentiment from AI-driven euphoria to a more sober reassessment of the actual returns on investment. Investors are locking in profits amid concerns that the company’s current infrastructure spending may not pay off in the near term.
Concerns have been reinforced by media reports of:
→ disappointing sales momentum for its AI products (Microsoft 365 Copilot);
→ intensifying competition, including from Google Gemini and Amazon AWS;
→ rising capital expenditure (forecast at more than $80bn per year).
Technical analysis of Microsoft (MSFT) shares
From a long-term perspective, the share price continues to move within a key ascending channel. In this context:
→ the lower boundary acted as support in April 2025;
→ the upper boundary has served as resistance. The orange arrows highlight aggressive selling pressure whenever the price moves beyond it. The black arrow points to rising volumes during the price decline in early November — a bearish signal following overbought conditions;
→ the QH line, which divides the upper half of the channel into two parts, has switched from support to resistance near the psychological $500 level;
→ the current price has fallen towards the channel’s median, where supply and demand typically come into balance (marked by the blue arrow).
In light of the above, it is reasonable to assume that the market may find an equilibrium that could persist until 28 January, when the quarterly earnings report is scheduled for release.
This article represents the opinion of the Companies operating under the FXOpen brand only. It is not to be construed as an offer, solicitation, or recommendation with respect to products and services provided by the Companies operating under the FXOpen brand, nor is it to be considered financial advice.

Stock Market Forecast | BTC TSLA NVDA AAPL AMZN META MSFT0:00 Intro
0:19 Sector Data
0:44 Sentiment Data
1:38 Dark Pools (Mag 7 ETF)
5:10 S&P 500 (SPY)
7:12 Nasdaq 100 (QQQ)
10:46 Bitcoin (BTC)
13:44 Tesla (TSLA)
16:39 Meta (META)
18:16 Amazon (AMZN)
19:11 Microsoft (MSFT)
21:35 Apple (AAPL)
23:55 Nvidia (NVDA)
26:06 Outro
QQQ stock market Forecast
Nvidia Stock NVDA Forecast
Apple Stock AAPL Forecast
Microsoft Stock MSFT Forecast
Google Stock GOOGL Forecast
Amazon Stock AMZN Forecast
Meta Forecast Technical Analysis
Tesla Stock TSLA Forecast
Magnificent 7 stocks forecast
Bitcoin BTC forecast
CRYPTOCAP:BTC SP:SPX NASDAQ:NDX NYMEX:NG1!
#daytrading #btc #stockmarketanalysis #nvda #tsla #aapl #msft #technicalanalysis #stockmarketeducation #mag7

Microsoft: Back in the Target Zone!Microsoft’s stock has slid back, settling again within our green Target Zone between $477.87 and $451.84. We anticipate an imminent upward movement as part of the magenta wave (5), which is expected to push price beyond the resistance at $562.17. Just above this level, the large blue wave (I) is likely to complete before a significant correction begins. There’s also a 38% chance of additional selling pressure below the support at $392.97. In this case, the high of $562.17 would align with the beige wave alt.III , while the low of wave alt.IV would form below $392.97.

MSFT: Risk of a buyer trap near the upper boundary of the rangeThe beginning of a new year is a good time to look at the annual and monthly timeframes.
Hello traders and investors!
Annual chart
On the annual timeframe, the buyer initiative remains intact. The range of the annual initiative is as follows:
lower boundary — 213.43,
upper boundary — 555.45,
50% of the initiative — 384.44.
A key level to highlight is 349.67 — the upper boundary of the previous buyer initiative on the annual chart. This level has already been retested, and the current active level is 344.79. This area represents an important structural support zone in the event of a deeper correction.
It is also important to note that, on last year’s candle, the minimum price range where at least 50% of the volume was traded is located in the upper part of the candle. In fact, this entire area is above the previous annual high, which indicates sustained buyer interest at higher prices.
Monthly chart
On the monthly timeframe, the market remains in a sideways range that was formed back in 2024. In March–April 2025, there was a manipulation of the lower boundary of this range — a false breakout on increased volume followed by a return of price back into the range.
As a result, a buyer zone was formed with an upper boundary at 402.15. The manipulated level 385.58 also stands out, as it nearly совпides with 50% of the annual trading range (384.44). This confluence strengthens the importance of the area and makes it attractive for searching for long-term buying opportunities.
The buyer managed to push the price above the upper boundary of the range (468.35), but failed to develop the initiative further. The structure formed above this level (468.35) strongly resembles a manipulation (false breakout). Despite the previously noted sustained buyer interest at higher prices, in the current context this move may turn into a trap for late buyers.
Above the upper boundary of the range, all candles with increased volume are seller candles, indicating seller pressure and a lack of further result from the buyer side.
If the price returns back into the range, the first resistance will be 450.12 (50% of the range). If this level fails to hold the price, the probability increases for gap closures below, with a move into the 402.15–385.58 area, where it makes sense to closely monitor patterns for long-term buying, provided there is confirmation from volume and initiative structure.
On the daily timeframe , the market is in a sideways range.
The price has broken out of this range to the downside, and if the seller now initiates a trend by forming another initiative, this could indicate a decline in price toward 450 and then further down to 402.
Profitable trades!
This analysis is based on the Initiative Analysis (IA) method.

Stock Market Forecast | BTC TSLA NVDA AAPL AMZN META MSFTQQQ stock market Forecast
Nvidia Stock NVDA Forecast
Apple Stock AAPL Forecast
Microsoft Stock MSFT Forecast
Google Stock GOOGL Forecast
Amazon Stock AMZN Forecast
Meta Forecast Technical Analysis
Tesla Stock TSLA Forecast
Magnificent 7 stocks forecast
Bitcoin CRYPTOCAP:BTC forecast
SP:SPX NASDAQ:NDX CME_MINI:NQ1! CME_MINI:ES1!

MSFT accumulation phaseAfter all that buying on the left, smart money is accumulating longs again by creating a trading range.
They had a stop hunt to grab a ton of orders, then kept buying on the lows of the range. Just before they move prices higher, they have a shake out to get rid of weak hands who keep selling into their uptrend. The volume is much lower on the retest of the shakeout bar, which means No Supply, now they are confident that there are no more sellers to slow their move up until they reach new highs (liquidity). Breakout to new highs will get retail traders to buy so they can sell into without driving prices down. Target is at a 50 percent retracement

Stock Market Forecast | BTC TSLA NVDA AAPL AMZN META MSFTQQQ stock market Forecast CME_MINI:ES1! SP:SPX NASDAQ:NDX
Nvidia Stock NVDA Forecast
Apple Stock AAPL Forecast
Microsoft Stock MSFT Forecast
Google Stock GOOGL Forecast
Amazon Stock AMZN Forecast
Meta Forecast Technical Analysis
Tesla Stock TSLA Forecast
Magnificent 7 stocks forecast
Bitcoin CRYPTOCAP:BTC forecast

Stock Market Forecast | BTC TSLA NVDA AAPL AMZN META MSFTQQQ stock market Forecast
Nvidia Stock NVDA Forecast
Apple Stock AAPL Forecast
Microsoft Stock MSFT Forecast
Google Stock GOOGL Forecast
Amazon Stock AMZN Forecast
Meta Forecast Technical Analysis
Tesla Stock TSLA Forecast
Magnificent 7 stocks forecast
Bitcoin CRYPTOCAP:BTC forecast
SP:SPX NASDAQ:NDX CME_MINI:ES1!

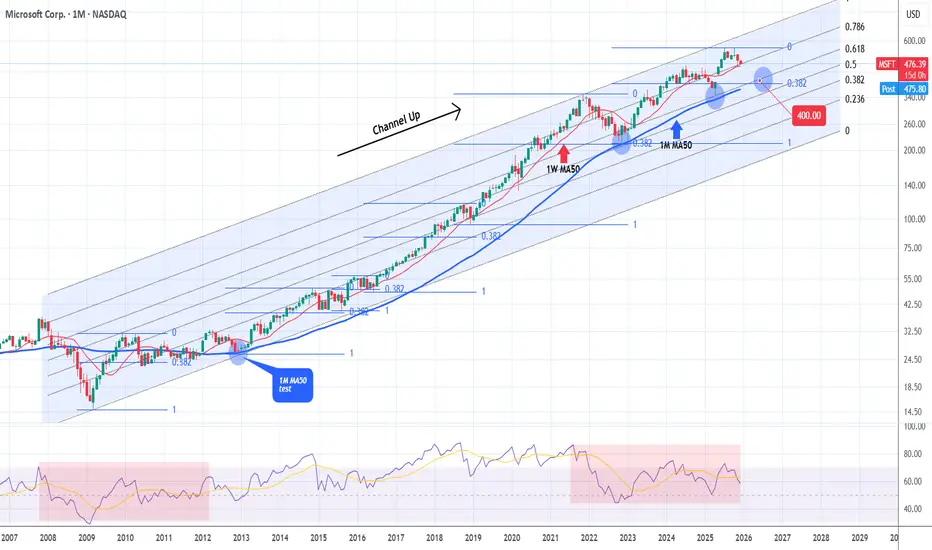
MICROSOFT testing the most important Support of the Cycle.Microsoft (MSFT) hit last month its 1W MA50 (red trend-line) and held. The rebound seems short-lived however as again half-way through December, the market is about to re-test that Support again.
This is a critical Support level for the Bull Cycle that started upon the November 2022 market bottom, as the last two times this broke, the price pulled-back to the 1M MA50 (blue trend-line).
That level has in fact been the ultimate long-term Support since 2012, the most important level of the Channel Up that started after the 2008 Housing Crisis.
We also see here that almost all of the strong bearish corrections within this pattern, hit the 0.382 Fibonacci retracement level and rebounded.
As a result, if 1W MA50 breaks again, we expect the subsequent correction / Bear Cycle to hit $400 at least.
---
** Please LIKE 👍, FOLLOW ✅, SHARE 🙌 and COMMENT ✍ if you enjoy this idea! Also share your ideas and charts in the comments section below! This is best way to keep it relevant, support us, keep the content here free and allow the idea to reach as many people as possible. **
---
💸💸💸💸💸💸
👇 👇 👇 👇 👇 👇
MSFT Selling Pressure Activated — Time to Short!🔥 MSFT Bearish Profit Playbook — Thief-Style Layer Attack Activated! 🔥
Asset: MSFT — Microsoft Corporation (NASDAQ)
Style: Swing / Day-Trade Playbook 📉💼
📉 Plan: Bearish Pressure Play — Smart Sell-Side Thief Approach
Microsoft is showing potential exhaustion on the upside, and this setup focuses on a structured bearish move using a layered sell-limit strategy (Thief Layer Method) 😎🕵️♂️.
🎯 Entry Strategy (Thief Layer Method)
Using the thief-style multi-layer approach, we stack multiple sell-limit orders at different levels to catch premium liquidity:
Sell Limit Layers:
$500, $490, $480
(You can increase or adjust layers based on your own risk tolerance.)
This method aims to fade upward pushes, catching price exhaustion during liquidity grabs.
🛑 Stop Loss (Risk Control)
This is the Thief SL @ $510 🛑
Note: Dear Ladies & Gentlemen (Thief OG’s), I’m not recommending that you use only my stop-loss. It’s your money — your rules. Manage your risk like a pro. 💼⚠️
🎯 Target (Exit Zones)
We are aiming toward strong support zones + potential oversold zones where bearish momentum may slow.
Main Target: $450
Trap may form — escape with profits before the market police catch us 🚓💨
Note: Dear Ladies & Gentlemen (Thief OG’s), I’m not recommending using only my target. Exit where you feel safe and profitable. 🏦✨
📊 Market Summary (Clean, TV-Safe Explanation)
Bearish attempt based on overextended zones
Layered entries help clip premium during upside wicks
Targeting liquidity pockets near support
SL above structural invalidation
Setup respects TradingView House Rules: No financial advice, no promises, no signals, educational thief-style humor only ✔️
🔗 Related Pairs to Watch (Correlation Insights)
Because MSFT is a heavyweight in tech + NASDAQ index weighting:
1️⃣ NASDAQ:QQQ (NASDAQ 100 ETF)
Strongly correlated
If QQQ rejects from local resistance → MSFT bearish play strengthened
QQQ weakness = tech sector weakness
2️⃣ AMEX:SPY (S&P500 ETF)
Broader market risk sentiment
SPY pullback often pressures mega-caps like MSFT
3️⃣ NASDAQ:AAPL (Apple Inc.)
Moves similarly during liquidity rotations
Apple weakness = added pressure to mega-cap tech basket
4️⃣ NASDAQ:NVDA (Nvidia Corp.)
High-beta tech name
When NVDA loses momentum, MSFT downside probability increases through sector rotation
5️⃣ NASDAQ:GOOGL (Alphabet Inc.)
If large-cap tech corrects collectively, MSFT rarely moves opposite
Perfect correlation watch ⚡
Watching these pairs helps confirm bearish bias through sector-wide confirmation, not isolated signals.
✨ “If you find value in my analysis, a 👍 and 🚀 boost is much appreciated — it helps me share more setups with the community!”
⚠️ Disclaimer:
This is a thief-style trading strategy just for fun.
Educational only — not financial advice. Trade at your own risk. 😄🕵️♂️

Stock Market Forecast | BTC TSLA NVDA AAPL AMZN META MSFTStock Market Forecast | CRYPTOCAP:BTC CME_MINI:ES1! CME_MINI:NQ1! SP:SPX
Mag 7 | TSLA NVDA AAPL AMZN META MSFT GOOGL

Stock Market Forecast | BTC TSLA NVDA AAPL AMZN META MSFTStock Market Forecast | CRYPTOCAP:BTC SP:SPX NASDAQ:NDX CME_MINI:ES1!
Mag 7 | TSLA NVDA AAPL AMZN META MSFT GOOGL

QS V3 Weekly Call Opportunity – MSFT Bullish TrendMSFT Weekly Signal | 2025-12-05
MSFT Weekly Call Option
Direction: Buy Calls (Long / Bullish)
Strike: $482.50
Entry Price: $5.62 – $5.70
Profit Target 1: $8.90 (≈60% gain)
Profit Target 2: $11.20 (≈100% gain)
Stop Loss: $3.90 (≈30% loss)
Expiry: Dec 12, 2025 (7 days)
Position Size: 2% of portfolio
Confidence: 58%
Rationale: Katy AI predicts upward trajectory to ~$497 by Friday; MACD bullish divergence suggests potential multi-day reversal.
Risk Notes: High – Friday expiration with gamma effects; low VIX may reduce premium capture. Monitor actively.
