Stock Market Forecast | BTC TSLA NVDA AAPL AMZN META MSFTStock Market Forecast | SP:SPX CME_MINI:NQ1! CME_MINI:ES1! CRYPTOCAP:BTC
Mag 7 | TSLA NVDA AAPL AMZN META MSFT
Microsoft (MSFT)

You Not Mess This [weekly analysis Nov. 24-28th 2025]Get ready for a deep dive into the key market moves, upcoming catalysts, and trade ideas you can’t afford to miss. In this week’s edition we’ll cover:
EURUSD BTc S&P500 AUDNZD AUDNZD GBPCAD
AMZN MSFT FTSE
🔔 Don’t forget to subscribe and hit the bell so you never miss a weekly breakdown.
📣 Share your thoughts in the comments: What are you bullish/concerned about this week? What setups are you watching?

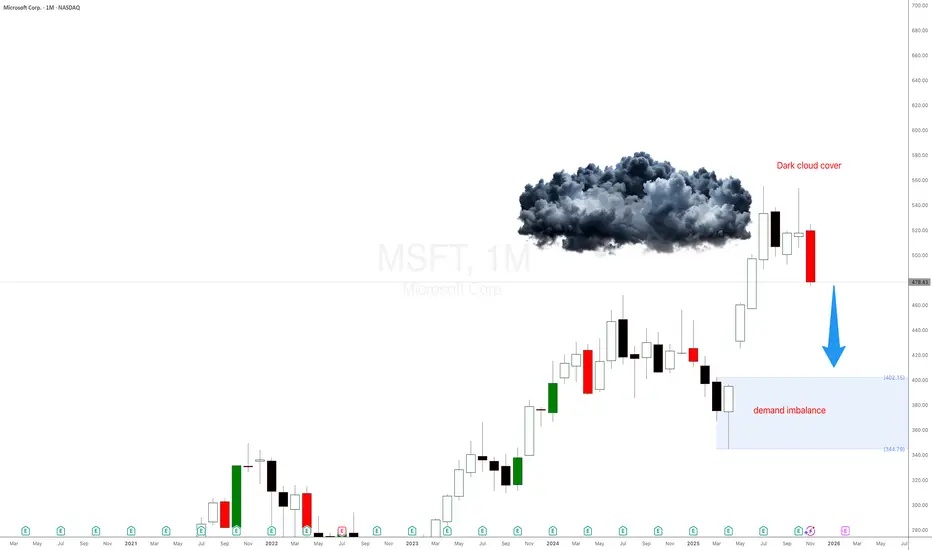
Why is Microsoft Stock $MSFT dropping hard?Microsoft just did what every impatient trader hates… after a massive rally, the candles are shrinking, emotions are rising, and here comes the correction everyone said ‘couldn’t happen.’ Today I’ll show you—using pure supply and demand—why MSFT is being magnetically pulled back into the monthly demand imbalance like a toddler to a candy shop. No fundamentals, no drama… just price action, imbalances, and patience. Let’s dive in.
Microsoft Monthly Supply & Demand Analysis
After Apple’s strong monthly correction setup, Microsoft (MSFT) is showing the exact same pattern — but even cleaner.
This is what I love when I teach traders to learn to trade stocks using pure price action and supply and demand imbalances. You don’t need news, earnings, or any guru opinion — everything is already priced in at the higher timeframes. Just like I explained in the Supply and Demand Free Course , the bigger timeframes tell you what the professionals already did months ago.
Let’s break it down.
Candles Shrinking = Momentum Weakening
Fast-forward to mid/late 2025:
- The wide-bodied candles disappeared
- Small-bodied candles appeared
- Then came the big bearish candle
This is classic momentum decay. This is exactly when most traders start acting emotionally:
- They zoom into 5-minute charts
- Their IQ drops by 50 points
- They forget the trend
- They forget the imbalance
- They become chart zombies
But price action never lies — we’re simply seeing exhaustion after a massive markup.
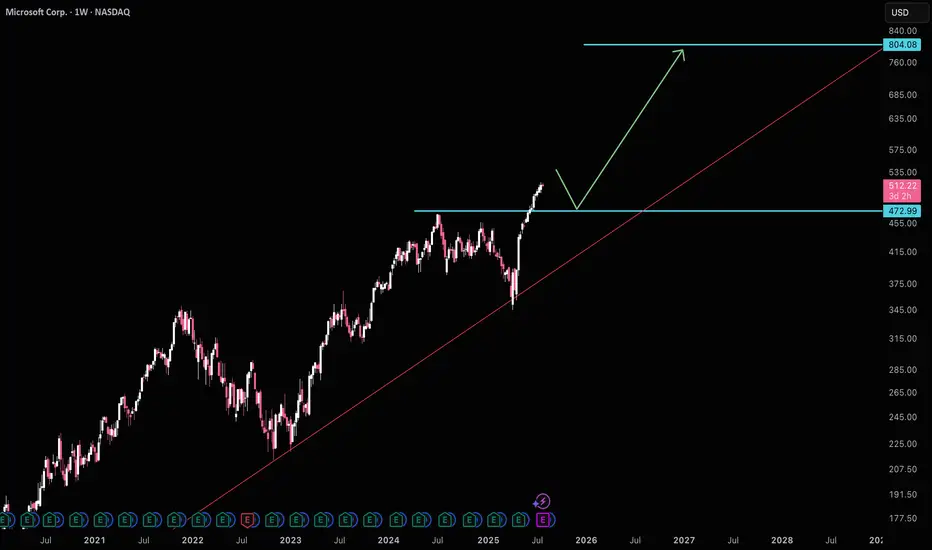
Mircrosoft wants to pullback to $470MSFT is likely to test $470 support before making it's move to $800. Another thing to be weary about is ratio MSFT/AAPL is at historical avg highs, which usually signals a bias towards AAPL. Waiting for $470 is a good idea before getting long again.
Good luck!
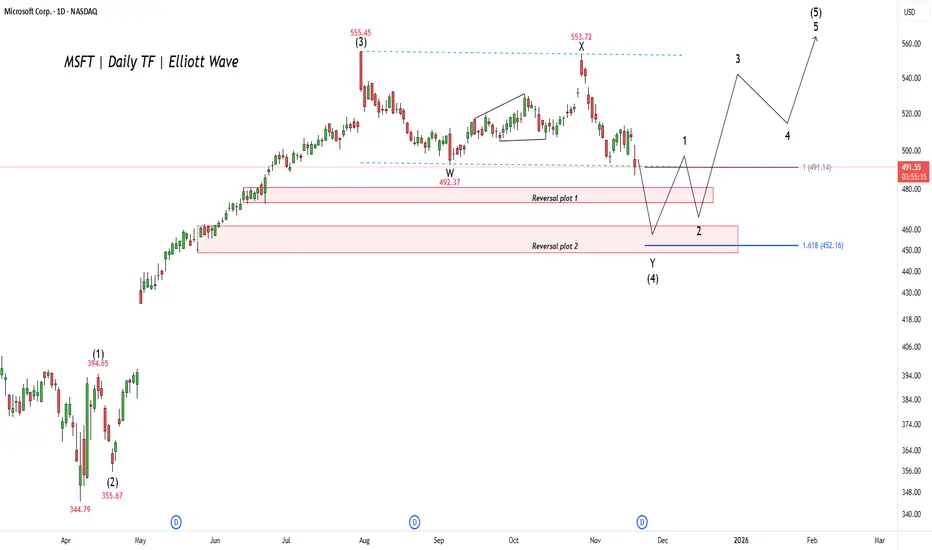
MSFT: Final Dip Before the Next LeapPrevious Idea:
Microsoft (MSFT) shows the stock is enduring a significant correction, which is the final pullback before a massive rally. This phase, labeled wave (4), is expected to find its bottom within a key support area. Traders are looking for this downswing to complete anywhere between the $452 and $492 zones. Hitting this target range would conclude the current multi-month drop and clear the path for the next major advance.
Once the correction successfully bottoms out in that crucial support range, the market expects a powerful final bullish surge, known as wave (5), to begin. This next wave is projected to drive the stock significantly higher, easily surpassing the previous all-time high of $555.45 . This bullish scenario will remain valid as long as the stock respects the identified support zone and begins its ascent from that area.
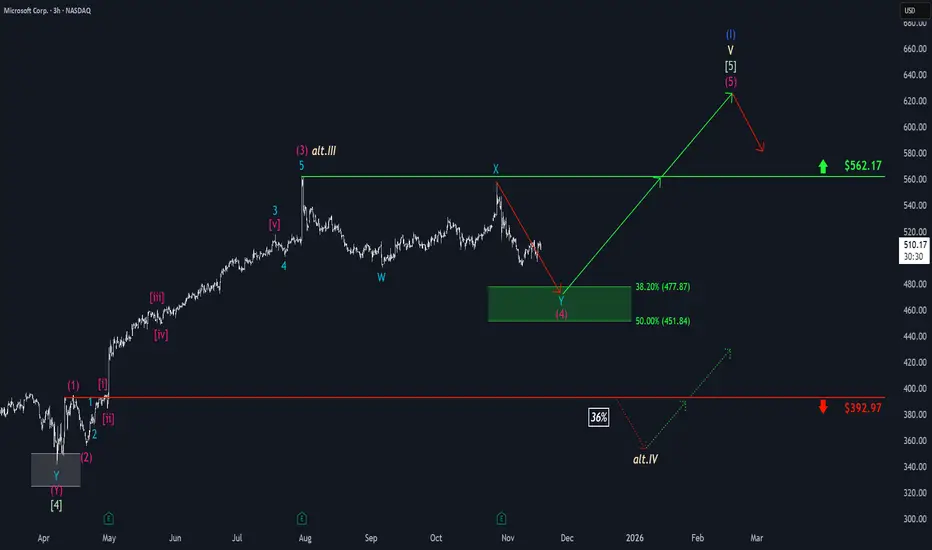
Microsoft: Stuck in Sideways PatternMicrosoft shares have continued to show weakness recently, although the stock has shifted into more of a sideways pattern. In the near term, we anticipate another downward move, which should establish the low for wave (4) in magenta within our green Target Zone between $477.87 and $451.84. From our perspective, this range remains attractive for long entries, as we expect a new upward impulse to follow as part of magenta wave (5). This move should push the stock above resistance at $562.17 and complete the larger blue wave (I). Alternatively, there is a scenario in which the high at $562.17 marks the end of beige wave alt.III (probability: 36%). In that case, we would expect a substantial decline below support at $392.97, where the low of wave alt.IV would be found.
Stock Market Forecast | TSLA NVDA AAPL AMZN META MSFTStock Market Forecast | SP:SPX NASDAQ:NDX CME_MINI:ES1! CME_MINI:NQ1!
Mag 7 | TSLA NVDA AAPL AMZN META MSFT GOOGL

Lucky FOREX Analysis (November 17th-21st 2025)In this week i talked bout EUR/USD AUD/NZD BTC AUD/USD S&P500 AMZN MSFT
Welcome to our weekly market breakdown — get ready for actionable forex insights to guide you through the week ahead. In this episode we cover:
🔍 Major currency pairs and key support/resistance levels
🧲 Trend analysis: where the momentum is shifting and what may be driving it
📆 Economic events to watch (interest rate decisions, inflation releases, central-bank commentary)
🛠️ Trade setups: potential entries, stop-loss zones & profit targets
🎯 Risk management tips: how to approach the week with discipline
Whether you’re a day trader, swing trader or simply keen to stay ahead of the curve, you’ll find value in this edition.
🔔 Remember:
Markets move fast. Use this analysis as one part of your trading decision process—not the whole. Always perform your own due diligence and manage your risk carefully.

S&P At The End Of The Trend?Seems like on the weekly and monthly charts, the S&P has completed a 5 wave Elliott which started in fall 2022, exactly 3 years ago. The indicators also seem getting weaker on both time frames. Probably there is a distribution going on. Everybody you see is talking about a recession in 2026, mostly towards the middle of the year and we will have a Christmas rally this year. Well, by now we have learned that if everybody is expecting something to happen, either it doesn’t happen or it happens earlier . We’ll see because nobody knows the future. Though, as I see, most people now are in the mood that every fall is a buying opportunity and “this time it’s different” with ai. So many cocky opinions flying around. Maybe this time it’s different but for now, I am thinking that we will have a 3 wave Elliott downwards. Actually, I didn’t like the sentiment that is going around. We’ll see if we will wear our shorts in winter.

Microsoft - This bullrun will end soon!💊Microsoft ( NASDAQ:MSFT ) might reverse soon:
🔎Analysis summary:
Microsoft created a textbook bullish break and retest back in the beginning of 2025. After this retest, we then witnessed a major rally of about +50% over the past couple of months. But considering the recent weakneses and resistance, this rally might be over very soon.
📝Levels to watch:
$550
SwingTraderPhil
SwingTrading.Simplified. | Investing.Simplified. | #LONGTERMVISION

It looks so gloomyWhat I’m Watching:
Reaction to the trendline on the next retest
Whether volume confirms a true bounce or a breakdown
Price behavior as it re-approaches the highlighted green zone, which has repeatedly acted as both support and resistance

Has $MSFT topped? NASDAQ:MSFT looks like it has put in a top up at the $555 level.
This is actually one of the most bearish looking charts as I think there's potentially a longer term top being put in here.
I think it's possible that price goes to at least the $287 level, but potentially all the way down to the lower supports in the low $100s before it can see a sustained bounce.

MSFT: The “Top Pick” Trap? Or Real Breakout Fuel?Microsoft is testing a critical support zone — and with Morgan Stanley just naming it a top pick in tech, buyers may be gearing up for control. 📈
Quantitative stats back the setup: Sortino Ratio of 0.42 and 90% win rate on this pattern.
👉 What’s your call — breakout to new highs… or one more dip before the rally?

Stock Market Forecast | TSLA NVDA AAPL AMZN META MSFTStock Market Forecast | CME_MINI:NQ1! CME_MINI:ES1! SP:SPX NASDAQ:NDX
Mag 7 | TSLA NVDA AAPL AMZN META MSFT

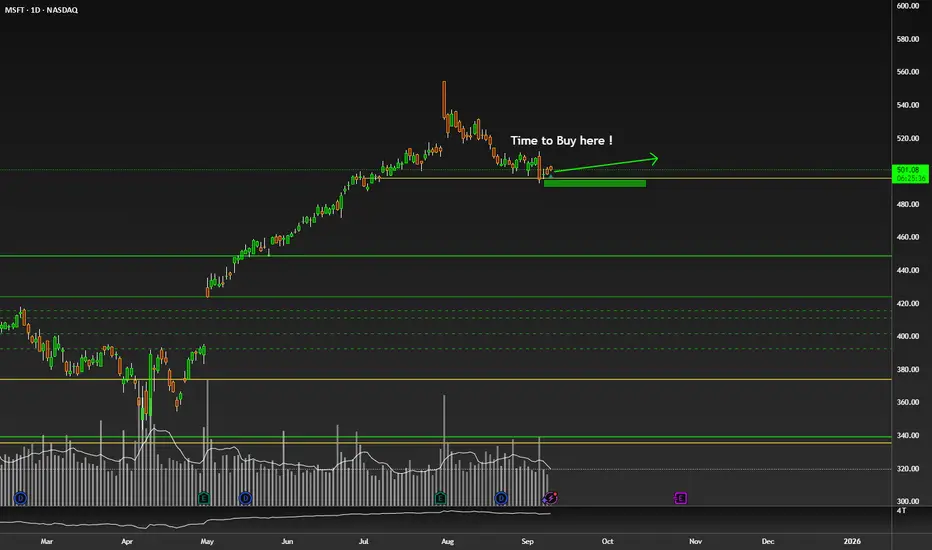
$NASDAQ:MSFT Nice Area to Long or Accumulation !NASDAQ:MSFT Nice Area to Long or Accumulation !
Price Action Tells Every thing !
Cooled already here.
Accumulation place.
nice support area.
Boost if you agree !
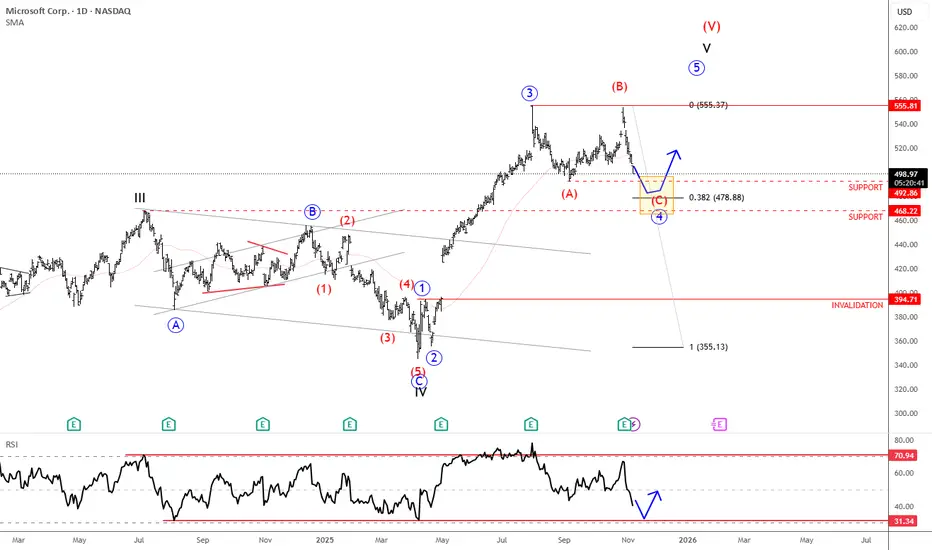
Microsoft Is Finishing Wave 4 CorrectionMicrosoft is in a wave 4 correction, and once it's fully completed, it can extend the rally within wave 5 from a technical point of view and according to Elliott wave theory.
Microsoft is a global technology company founded by Bill Gates and Paul Allen in 1975. It’s best known for its Windows operating system, Microsoft Office suite, and cloud platform Azure. Over the years, Microsoft has expanded into gaming (with Xbox), professional networking (LinkedIn), and AI (through partnerships like OpenAI). Today, it’s one of the world’s most valuable and influential companies, shaping software, hardware, and cloud computing industries.
Microsoft reported earnings last Wednesday after the close, with the price turning lower after reaching new highs. The structure still appears to be a wave four in progress — a flat correction where the current drop likely represents wave C. Wave C often stabilizes near wave A levels, suggesting support around 492 and 468 (the former 2024 high). Holding this zone could set up the next rebound into the final higher-degree wave five.
Highlights:
Trend: Corrective phase, wave C of flat in progress
Potential: Rebound toward new highs once support holds
Support: 492 / 468
Invalidation: Below 394
Note: Watch for stabilization at support before potential wave five continuation
MICROSOFT may fall to $450 if this Support breaks.Microsoft (MSFT) has been trading within a 4-year Channel Up since the November 22 2021 High. Last week it got rejected exactly on its July 28 2025 Resistance (which was a Higher High for the Channel Up) and formed a Double Top, which continues to decline this week as well.
With its 1W RSI also displaying a Bearish Divergence (since the July High) similar to past sell alerts within this Channel Up, it is possible for the stock to correct to at least $450, which represents the 0.5 Fibonacci level where the previous July 2024 - March 2025 correction found Support. That was just above the 1W MA200 (orange trend-line), which also priced the bottom of the October 31 2022 Low but that correction was -38.69%, considerably stronger that -26.54%, which is also plausible if 2026 is a Bear Cycle.
The level that has confirmed those two correction Sell Signals within this Channel Up has been the 1D MA150 (red trend-line). On both occasions, Microsoft closed a 1W candle below the 1D MA150 and confirmed the correction, something that hasn't happened at any other time during these 4 years.
-------------------------------------------------------------------------------
** Please LIKE 👍, FOLLOW ✅, SHARE 🙌 and COMMENT ✍ if you enjoy this idea! Also share your ideas and charts in the comments section below! This is best way to keep it relevant, support us, keep the content here free and allow the idea to reach as many people as possible. **
-------------------------------------------------------------------------------
💸💸💸💸💸💸
👇 👇 👇 👇 👇 👇

MSFT Bearish: H&S Breakdown Eyes 455–465 SupportMicrosoft (MSFT) just cracked lower from a three-month range. After topping near 560 in early August, price chopped between 500 support and 530 resistance before breaking beneath the 20/60-day MAs and the neckline at 510–515. It’s now pressing the 120-day MA around 502 with expanding volatility and heavy sell volume—classic signatures of a confirmed head-and-shoulders top.
Primary path: favor fades into resistance and breakdowns. A weak bounce that stalls inside 515–525 (neckline retest) keeps the short idea intact; a break-and-daily-close below 502 unlocks 490 first, then the 455–465 demand zone. Tactically, shorts can also lean on an intraday trigger (e.g., 1H close below 512) with stops tightened if momentum accelerates. Invalidation for shorts is clean: a daily close back above 531, which would neutralize the breakdown.
Alternative: if 502 holds and buyers reclaim the range, a daily close above 530–531 would negate the bearish structure and open a squeeze toward 555–560. Bulls still have work to do while price sits below the falling 20/60-day MAs and the 530 ceiling.
This is a study, not financial advice. Manage risk and invalidations

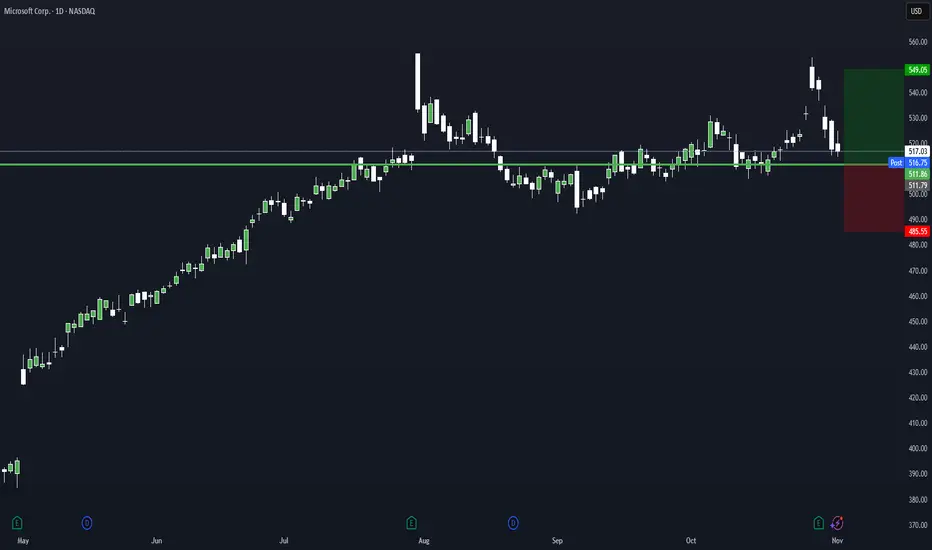
Rebound Setup: Limit-Buy after Short-Term Exhaustion (MSFT)Hi Traders
This is a systematic mean-reversion setup I use across liquid ETFs and large-cap equities.
The goal is simple: enter weakness into exhaustion, not falling knives.
I will place a limit order for MSFT at $511.86. If the order remains unfilled, I will cancel it at the close of trading tomorrow.
Key Concepts:
Oversold short-term conditions
Price deviation vs recent mean
Volume/volatility context
Limit order for the next session only when criteria align
Exit next session open (or rules-based exit, depending on version)
I don’t chase dips — I predefine levels and only enter when price comes to me. This trade idea triggered a limit buy level for today on EFA at 93.55.
General notes:
Works best in mean-reverting environments
Avoid news catalysts & low-liquidity names
This is not a signal service — just a research-based framework
If you like data-driven, rule-based setups, follow along —
I will share more systematic edge ideas like this.
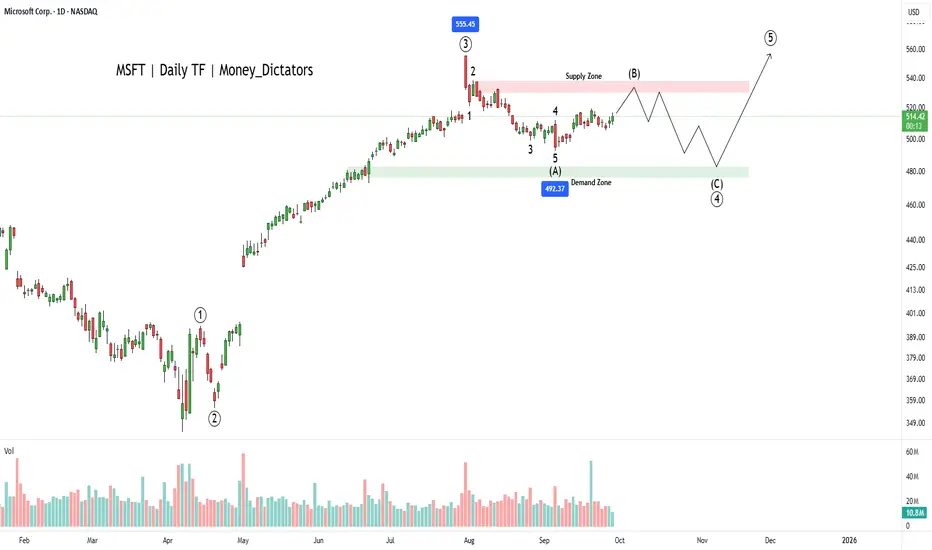
Why MSFT Could Be a Smart Pick in 2025?MSFT has bullish signals from the multiple moving averages, RSI and volume analysis. However, wave principle asks evidence from the buyers. The wave count suggests that the corrective wave (B) is ongoing, and bears will control the final wave of the primary wave 3.
Wave C will start falling nearby the supply zone and high of the 2nd wave of wave intermediate wave A. Wave C can fall up to 476 which will be the strength for wave primary wave 5. As per the chart, breakout above 540 will be a good signal for bulls to take charge back.
Zones:
Supply zone: 538 - 528
Demand zone: 482 - 476
I will update the chart and details shortly.
Microsoft: Wave X Top Confirmed! As primarily anticipated, Microsoft shares recently reached the high of turquoise wave X just below resistance at $562.17 before quickly reversing lower. This decline, part of the same-colored wave Y, is likely to bottom within our magenta long Target Zone between $477.87 and $451.84, where we also expect the low of magenta wave (4). In our view, this range presents attractive opportunities for long positions, as we anticipate a renewed upward move during magenta wave (5) to follow. This rally should push price above the $562.17 resistance and complete the larger blue wave (I). Alternatively, we see a scenario in which the high at $562.17 marked only the end of beige wave alt.III (probability: 36%). In this case, a drop below the $392.97 support would be expected to form the low of wave alt.IV.

Stock Market Forecast | TSLA NVDA AAPL AMZN META MSFTStock Market Forecast | CME_MINI:NQ1! CME_MINI:ES1! NASDAQ:NDX SP:SPX
Mag 7 | TSLA NVDA AAPL AMZN META MSFT GOOGL

Today's Market Wrap: Fed, Gold, and Earnings – 29/10/2025The Federal Reserve cut interest rates by 25 basis points, marking the lowest level since 2022. However, Fed Chair Jerome Powell hinted at a possible pause in further rate cuts for the rest of the year. Still, the S&P 500 gained 0.2%, and the Nasdaq gained 1%, both hitting fresh record highs.
Gold remained flat at $3,950 an ounce after Powell warned that a December rate cut is not guaranteed. Potential progress on the US-China trade framework has also reduced some safe-haven demand.
In corporate earnings, Microsoft beat expectations but saw a ~2.5% drop in after-hours trading due to a slight miss in cloud revenue. Meta posted strong results but fell ~8% after hours, driven by concerns over capital expenditure. Alphabet exceeded earnings and revenue forecasts, with strong performance across Search, YouTube, and Cloud, sending shares up ~5% in after-hours trading.
