MSFT Selling Pressure Activated — Time to Short!🔥 MSFT Bearish Profit Playbook — Thief-Style Layer Attack Activated! 🔥
Asset: MSFT — Microsoft Corporation (NASDAQ)
Style: Swing / Day-Trade Playbook 📉💼
📉 Plan: Bearish Pressure Play — Smart Sell-Side Thief Approach
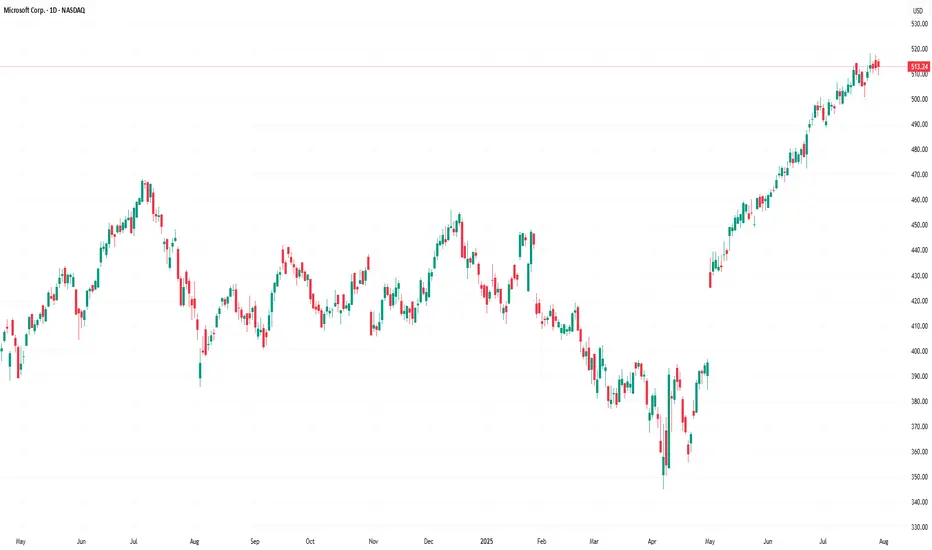
Microsoft is showing potential exhaustion on the upside, and this setup focuses on a structured bearish move using a layered sell-limit strategy (Thief Layer Method) 😎🕵️♂️.
🎯 Entry Strategy (Thief Layer Method)
Using the thief-style multi-layer approach, we stack multiple sell-limit orders at different levels to catch premium liquidity:
Sell Limit Layers:
$500, $490, $480
(You can increase or adjust layers based on your own risk tolerance.)
This method aims to fade upward pushes, catching price exhaustion during liquidity grabs.
🛑 Stop Loss (Risk Control)
This is the Thief SL @ $510 🛑
Note: Dear Ladies & Gentlemen (Thief OG’s), I’m not recommending that you use only my stop-loss. It’s your money — your rules. Manage your risk like a pro. 💼⚠️
🎯 Target (Exit Zones)
We are aiming toward strong support zones + potential oversold zones where bearish momentum may slow.
Main Target: $450
Trap may form — escape with profits before the market police catch us 🚓💨
Note: Dear Ladies & Gentlemen (Thief OG’s), I’m not recommending using only my target. Exit where you feel safe and profitable. 🏦✨
📊 Market Summary (Clean, TV-Safe Explanation)
Bearish attempt based on overextended zones
Layered entries help clip premium during upside wicks
Targeting liquidity pockets near support
SL above structural invalidation
Setup respects TradingView House Rules: No financial advice, no promises, no signals, educational thief-style humor only ✔️
🔗 Related Pairs to Watch (Correlation Insights)
Because MSFT is a heavyweight in tech + NASDAQ index weighting:
1️⃣ NASDAQ:QQQ (NASDAQ 100 ETF)
Strongly correlated
If QQQ rejects from local resistance → MSFT bearish play strengthened
QQQ weakness = tech sector weakness
2️⃣ AMEX:SPY (S&P500 ETF)
Broader market risk sentiment
SPY pullback often pressures mega-caps like MSFT
3️⃣ NASDAQ:AAPL (Apple Inc.)
Moves similarly during liquidity rotations
Apple weakness = added pressure to mega-cap tech basket
4️⃣ NASDAQ:NVDA (Nvidia Corp.)
High-beta tech name
When NVDA loses momentum, MSFT downside probability increases through sector rotation
5️⃣ NASDAQ:GOOGL (Alphabet Inc.)
If large-cap tech corrects collectively, MSFT rarely moves opposite
Perfect correlation watch ⚡
Watching these pairs helps confirm bearish bias through sector-wide confirmation, not isolated signals.
✨ “If you find value in my analysis, a 👍 and 🚀 boost is much appreciated — it helps me share more setups with the community!”
⚠️ Disclaimer:
This is a thief-style trading strategy just for fun.
Educational only — not financial advice. Trade at your own risk. 😄🕵️♂️
Msftanalysis

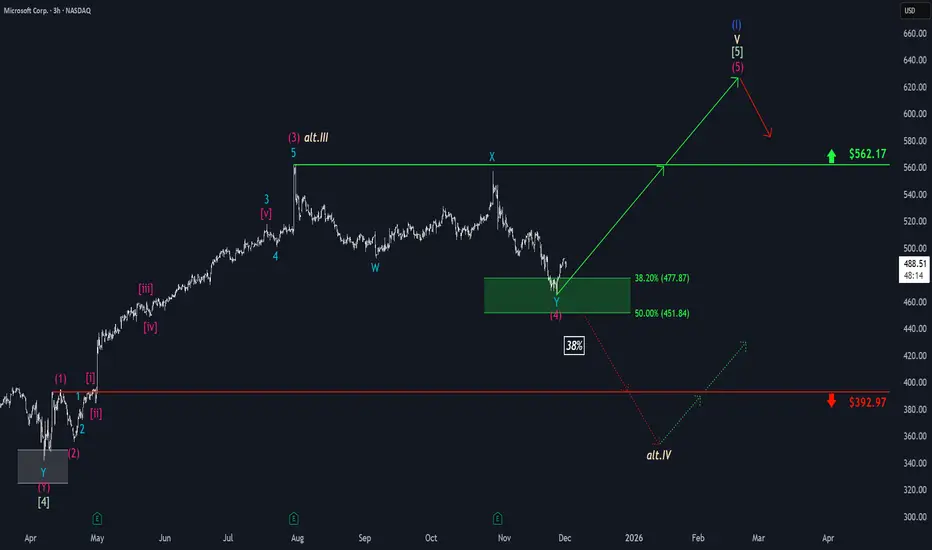
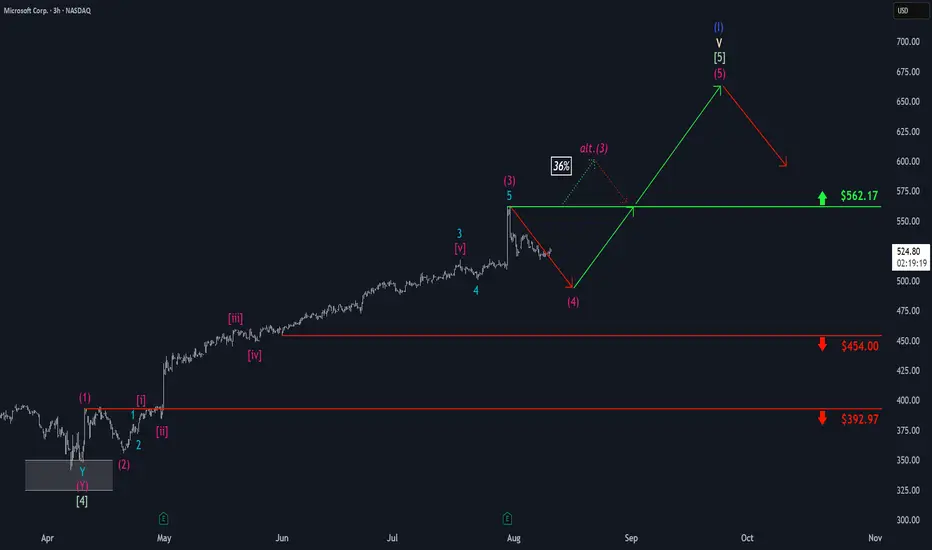
Microsoft: Target Zone Hit!Microsoft has reached our green Long Target Zone between $451.84 and $477.87 as anticipated. In the meantime, the stock has successfully completed the magenta wave (4) and has since broken out of the Target Zone to the upside. We now expect further gains as wave (5) unfolds, targeting a move above the resistance at $562.17, where the larger blue wave (I) is expected to conclude. After that, we anticipate a pronounced correction phase. However, there remains a 38% chance that MSFT could break down through the Target Zone and fall below the support at $392.97. In this case, we would reclassify the last significant high at $562.17 as the top of the beige wave alt.III and prepare for a new low in wave alt.IV .
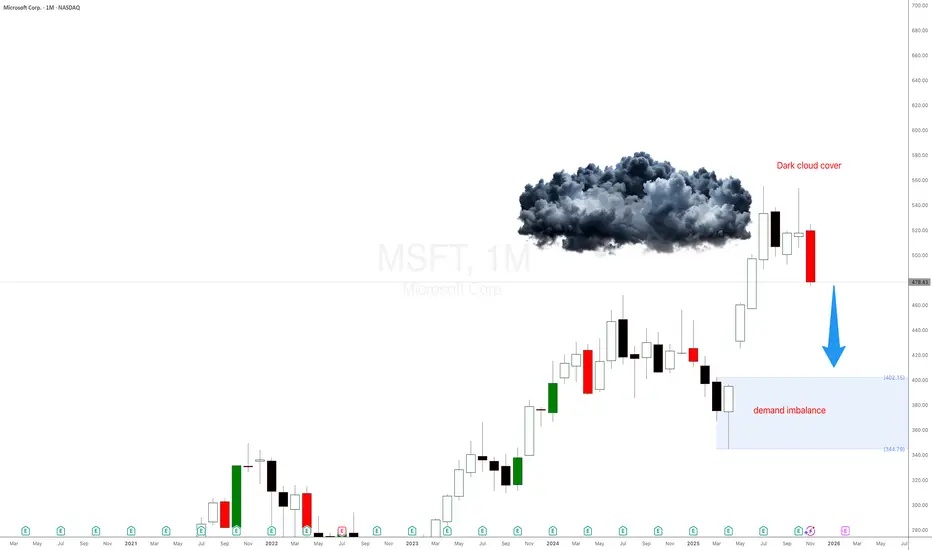
Why is Microsoft Stock $MSFT dropping hard?Microsoft just did what every impatient trader hates… after a massive rally, the candles are shrinking, emotions are rising, and here comes the correction everyone said ‘couldn’t happen.’ Today I’ll show you—using pure supply and demand—why MSFT is being magnetically pulled back into the monthly demand imbalance like a toddler to a candy shop. No fundamentals, no drama… just price action, imbalances, and patience. Let’s dive in.
Microsoft Monthly Supply & Demand Analysis
After Apple’s strong monthly correction setup, Microsoft (MSFT) is showing the exact same pattern — but even cleaner.
This is what I love when I teach traders to learn to trade stocks using pure price action and supply and demand imbalances. You don’t need news, earnings, or any guru opinion — everything is already priced in at the higher timeframes. Just like I explained in the Supply and Demand Free Course , the bigger timeframes tell you what the professionals already did months ago.
Let’s break it down.
Candles Shrinking = Momentum Weakening
Fast-forward to mid/late 2025:
- The wide-bodied candles disappeared
- Small-bodied candles appeared
- Then came the big bearish candle
This is classic momentum decay. This is exactly when most traders start acting emotionally:
- They zoom into 5-minute charts
- Their IQ drops by 50 points
- They forget the trend
- They forget the imbalance
- They become chart zombies
But price action never lies — we’re simply seeing exhaustion after a massive markup.
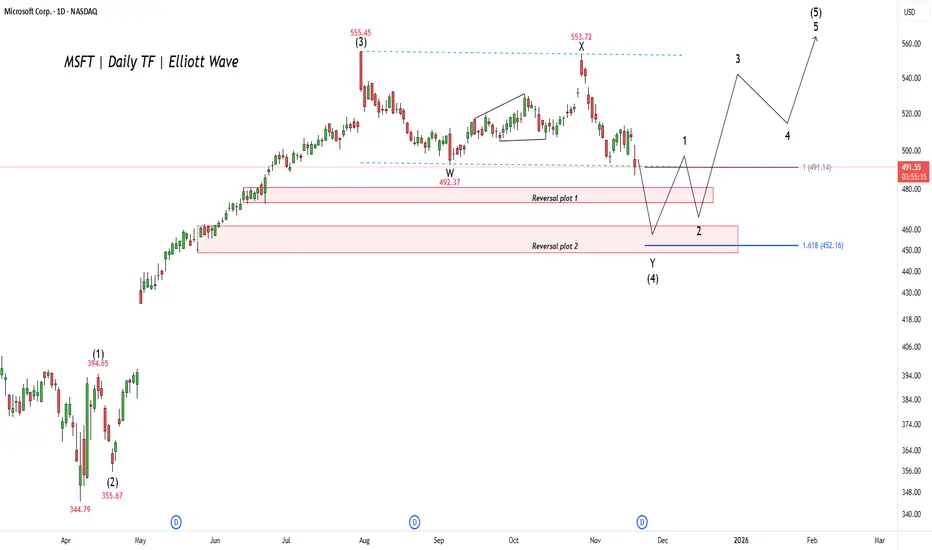
MSFT: Final Dip Before the Next LeapPrevious Idea:
Microsoft (MSFT) shows the stock is enduring a significant correction, which is the final pullback before a massive rally. This phase, labeled wave (4), is expected to find its bottom within a key support area. Traders are looking for this downswing to complete anywhere between the $452 and $492 zones. Hitting this target range would conclude the current multi-month drop and clear the path for the next major advance.
Once the correction successfully bottoms out in that crucial support range, the market expects a powerful final bullish surge, known as wave (5), to begin. This next wave is projected to drive the stock significantly higher, easily surpassing the previous all-time high of $555.45 . This bullish scenario will remain valid as long as the stock respects the identified support zone and begins its ascent from that area.
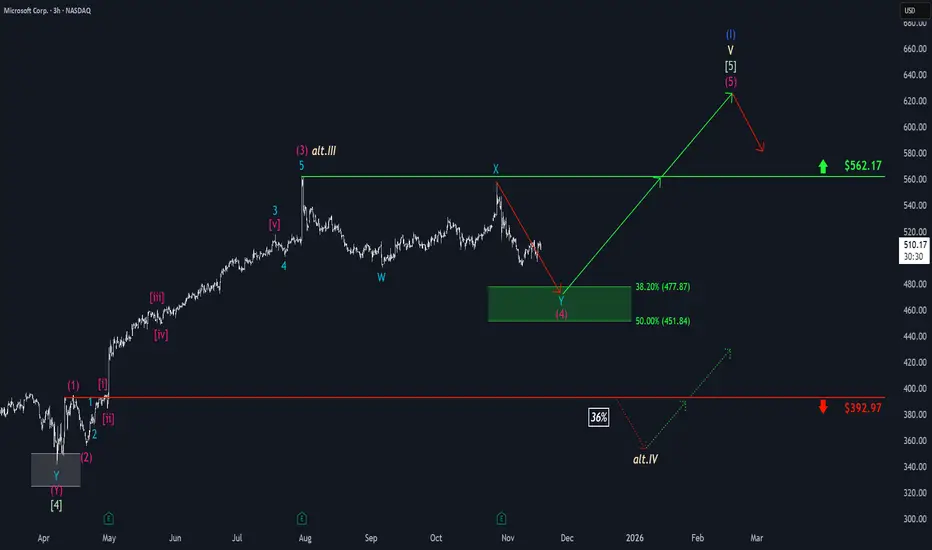
Microsoft: Stuck in Sideways PatternMicrosoft shares have continued to show weakness recently, although the stock has shifted into more of a sideways pattern. In the near term, we anticipate another downward move, which should establish the low for wave (4) in magenta within our green Target Zone between $477.87 and $451.84. From our perspective, this range remains attractive for long entries, as we expect a new upward impulse to follow as part of magenta wave (5). This move should push the stock above resistance at $562.17 and complete the larger blue wave (I). Alternatively, there is a scenario in which the high at $562.17 marks the end of beige wave alt.III (probability: 36%). In that case, we would expect a substantial decline below support at $392.97, where the low of wave alt.IV would be found.
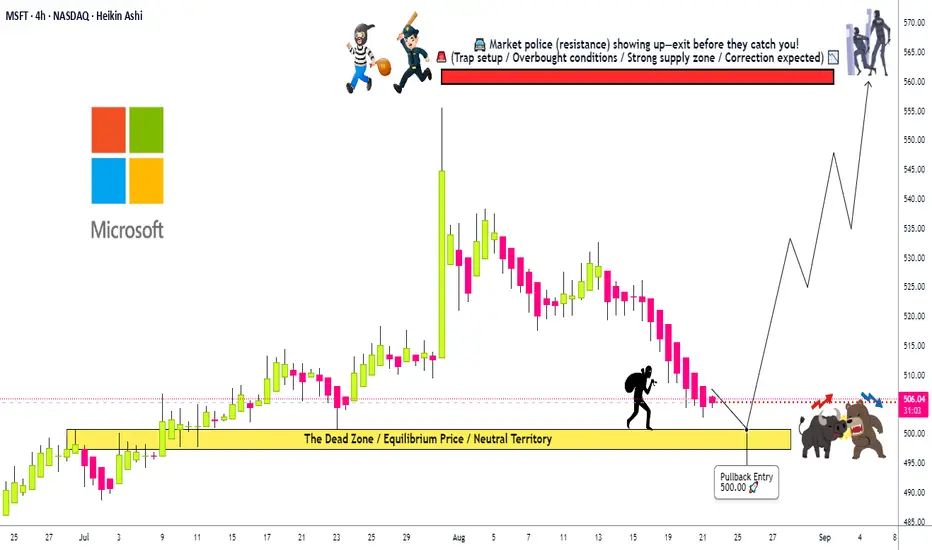
Microsoft: The Perfect Pullback Is Coming. Are You Ready?🌟 MSFT HEIST ALERT! 🌟 Steal from the Cops, Not from the Citizens! 🚔➡️🤑
Dear Ladies & Gentleman of the Thief Trading Guild, 🎩👒
Based on the 🔥Thief Trading Style Analysis🔥, here is our master plan to heist the Microsoft Corporation (MSFT) fortress. Our intel confirms a BULLISH ambush is setting up! It's time to loot! 💰💸✈️
🦹♂️ THE HEIST PLAN (SWING TRADE) 🦹♂️
Entry Point: The Perfect Pullback Loot Zone! 🎯
We're waiting for the asset to pull back to our LAYERED LIMIT ORDER TRAP! 🪤 Thief OG's use multiple entries to maximize the steal!
LAYER 1: 510.00 (First dibs!)
LAYER 2: 505.00 (Loading the bag!)
LAYER 3: 500.00 (MAIN HEIST - Perfect Pullback!)
LAYER 4: 498.00 (Bonus loot! Add more layers based on your own risk, thieves!)
Stop Loss: The Getaway Car Location! 🛑🏎️
This is Thief SL @ 485.00. This is where the trade idea is invalidated. Dear Thieves, adjust your final SL based on your own risk, strategy, and how many layers you used. Don't get caught! 👮♂️🚔
Target: The Police Barricade! 🚧🚨
Intel shows a major resistance wall (Police Barricade) at 565.00. Our mission is to escape with the stolen money BEFORE we get there! Escape Target: 560.00! Count your profits and live to trade another day! 💵🎉🤝
📢 THIEF'S BROADCAST 📢
Yo! Listen up, crew! 🗣️ If you're placing limit orders on this pullback, your stop loss should be set ONLY AFTER your order is filled! You feel me? Now, if you're smart, you'll place that stop loss where I told you 📍, but if you're a rebel, you can put it wherever you like 🤪 - just remember, you're playing with fire 🔥, and it's your risk, not mine! 👊
⚠️ TRADING ALERT : EARNINGS & NEWS ⚠️
MSFT is a big cap stock, and news/earnings can cause extreme volatility! To protect your stolen loot:
Avoid entering new layers before major news.
Consider taking some profit before earnings.
Use trailing stop-loss orders to protect running positions!
💖 Supporting our robbery plan = 💥Hitting the Boost Button💥 It fuels our getaway car and helps us find the next big heist! Let's make stealing money look easy! 🏆💪❤️🎉
I'll see you at the next heist, so stay tuned! 🤑🐱👤🤗🤩
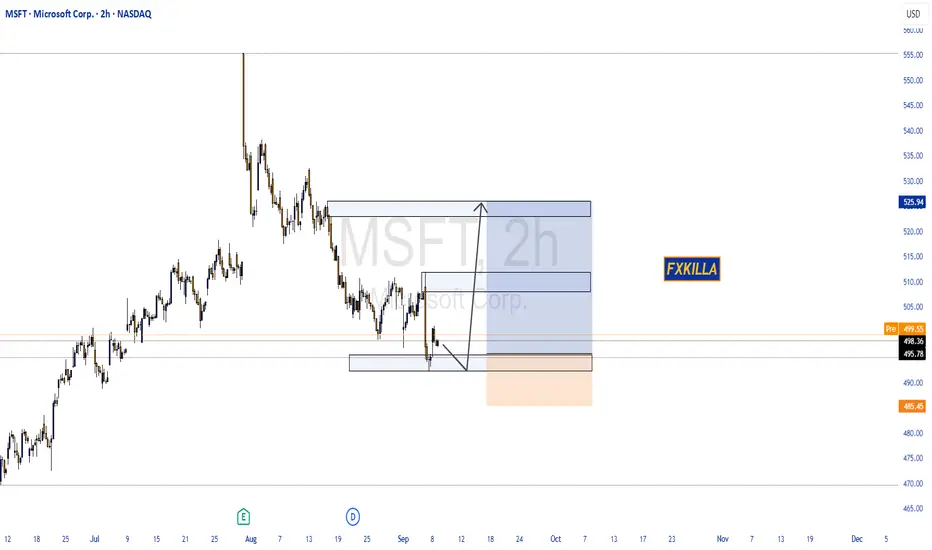
MICROSOFT CORP. HIGH PROBABILITY SETUP SOON!!🚨 MSFT HIGH PROBABILITY BUY SETUP 🚨
* Here We Can See Clearly The Next Potential Move For MSFT Coming Hours/Days.
* Keep Your Eyes Close On Your Trading Positions.
* Happy PIP Hunting Traders.
FXKILLA.
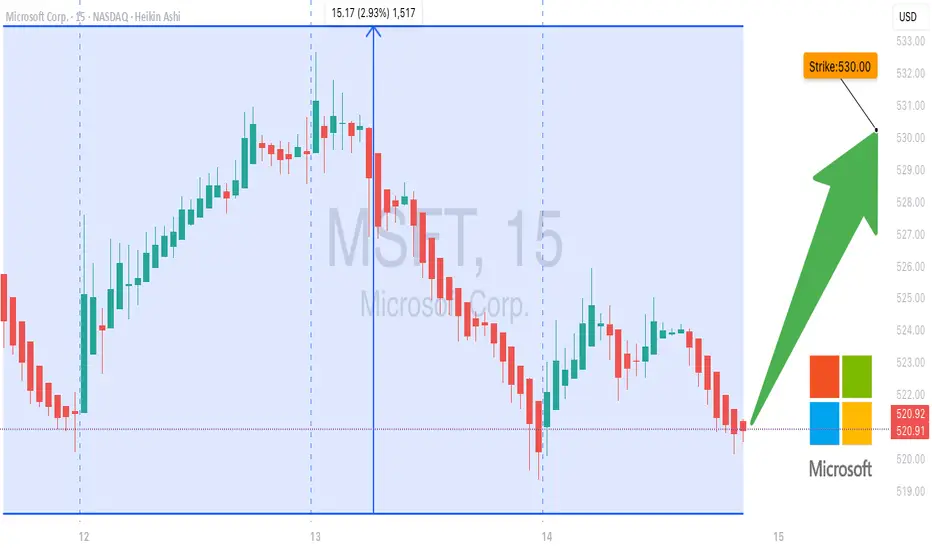
MSFT Weekly Calls on Fire – Can Bulls Beat the Clock?🚀 MSFT Bulls Charge at \$530 – Can They Double Before Expiry?
**Sentiment:** 🟢 *Strong Bullish*
* **Daily RSI:** 61.3 📈
* **Weekly RSI:** 81.4 🔥
* **Trend:** Bullish above key MAs & resistance
* **Volume:** Weak (0.5× last week) → watch for consolidation
* **C/P Ratio:** 2.34 (Institutional bullish flow)
* **VIX:** 15.0 → favorable for calls
---
### 📊 **Consensus Snapshot**
✅ Strong RSI + bullish options flow across all models
✅ Low volatility supports directional trades
⚠️ Volume weakness = possible pause before push
---
### 🎯 **Trade Setup**
* **Type:** CALL (Naked)
* **Strike:** \$530.00
* **Expiry:** 2025-08-15
* **Entry:** \$0.69
* **Profit Target:** \$1.38 (+100%)
* **Stop Loss:** \$0.34 (–50%)
* **Confidence:** 75%
* **Entry Timing:** Market open
---
💬 *One-day gamma sprint — manage risk, exit quick.*
📌 *Not financial advice. DYOR.*
---
**#MSFT #OptionsTrading #WeeklySetup #TradingSignals #StocksToWatch #DayTrading #OptionsFlow #GammaSqueeze**
Microsoft: Wave (3) Complete – Wave (4) Pullback in ProgressAs Microsoft has reached a pronounced peak, followed by a notable move to the downside, er now consider wave (3) finished. Thus, we see price currently in the corrective phase of wave (4), which still has some immediate downside potential but should hold above support at $454. The subsequent wave (5) is expected to mark the high of the broader blue wave (I). At this point, we assign a 36% probability to the scenario where wave alt.(3) makes a higher high above the new resistance at $562.17.
Microsoft Soars to Record High Following Strong Earnings ReportMicrosoft Stock (MSFT) Soars to Record High Following Strong Earnings Report
As the chart illustrates, Microsoft (MSFT) shares surged sharply after the close of the regular trading session – an immediate market reaction to the company’s strong quarterly results.
According to available data, MSFT's post-market price jumped to $555 per share, exceeding its previous all-time high by more than 8%.
Why Did MSFT Share Price Rise?
The quarterly report provided several reasons for optimism, including:
→ Earnings per share (EPS) came in at $3.65, beating analysts’ expectations of $3.37 by over 8%. Revenue also exceeded forecasts, totalling $76.4 billion versus the projected $73.9 billion.
→ Microsoft’s cloud revenue rose by 27% to $46.7 billion, while Azure’s annualised revenue exceeded $75 billion, driven by growing demand for AI-related services.
In response to these results, Barclays analysts quickly raised their price target for Microsoft shares from $550 to $625.
Technical Analysis of MSFT Chart
It is worth noting that the previous quarterly report was also strong, resulting in the formation of a large bullish gap on 1 May, followed by a sustained upward trend (highlighted by the purple trendline S). Importantly, the gap in the $395–425 range remains unfilled.
Yesterday’s report is also likely to result in a large bullish gap at the market open today, though this time, the market context could lead to a different scenario.
The key factor here is the long-term ascending channel (shown in blue), which reflects MSFT’s price movements throughout 2024–2025. After the previous strong report, the share price moved from the median to the upper boundary of the channel without setting a new record high. However, following the most recent report, the price has surged deep into overbought territory, potentially setting a multi-month high on the RSI and achieving a significant breakout to a new record.
As a result, once the initial excitement around the earnings subsides – and the desire of investors to close long positions intensifies – MSFT could undergo a correction from the upper boundary of the channel. In this scenario, the following support levels could come into play:
→ The psychological level of $550 in the short term;
→ The S trendline, as a possible support during a deeper correction.
This article represents the opinion of the Companies operating under the FXOpen brand only. It is not to be construed as an offer, solicitation, or recommendation with respect to products and services provided by the Companies operating under the FXOpen brand, nor is it to be considered financial advice.
MSFT Earnings Play (2025-07-31) — STRONG BULLISH SETUP
**🚨 MSFT Earnings Play (2025-07-31) — STRONG BULLISH SETUP 🚨**
**Microsoft \ NASDAQ:MSFT Pre-Earnings Trade Idea — 545C (Aug 1)**
---
### 🧠 **Earnings Thesis (🔥 80% Conviction)**
MSFT is set to report **BMO July 31**, and all signs point *bullish*:
📈 **Revenue Growth**: +13.3% YoY, driven by **AI + Cloud** momentum
💰 **Margins**: Profit 35.8%, Op 45.7%, Gross 69.1% — textbook pricing power
📊 **Guidance**: 100% beat history, avg. +5.8% surprise
📌 **Analyst Consensus**: 💪 Strong Buy | Target: \$549.90
📊 **Sector Tailwinds**: Tech favored in current macro with Fed on hold
➡️ **Score: 9/10 Fundamentals | Bullish Momentum Across the Board**
---
### 🔍 **Options Flow & Technicals**
🔥 **Implied Move**: \~6.3% by Aug 1
📉 **IV Rank**: 0.75 (Room to expand post-earnings)
💸 **Call Flow**: Strong OI in 540–550 zone, gamma buildup may fuel squeeze
📊 **RSI**: 70.14 → Bullish, close to overbought
📈 **Support**: \$505 | **Resistance**: \$518.29
➡️ **Score: 8/10 Options | 8/10 Technicals**
---
### 🧨 Trade Setup: 545 CALL (Aug 1 Exp)
🎯 **Entry Price**: \$0.90
📅 **Expiry**: 2025-08-01
📈 **Profit Target**: \$1.80 (⚡️+100%)
🛑 **Stop Loss**: \$0.45
📐 **Size**: 2 contracts (2% portfolio risk)
💡 **Timing**: Enter **EOD July 30 (Pre-earnings)**
⚠️ **IV Crush Alert** → Exit within 2 hours *post-earnings*
---
### ✅ RISK PLAN
* Position: Max 2–3% of portfolio
* IV crush & gap protection: Tight stop and quick post-earnings exit
* Exit Plan: \$1.80 or Stop \$0.45, OR close manually after earnings move
---
📊 **Trade JSON Snapshot**
```json
{
"ticker": "MSFT",
"direction": "CALL",
"strike": 545,
"entry": 0.90,
"target": 1.80,
"stop": 0.45,
"expiry": "2025-08-01",
"entry_time": "EOD Jul 30",
"earnings_date": "2025-07-31 BMO",
"confidence": "80%",
"expected_move": "6.3%",
"iv_rank": "0.75"
}
```
---
🧠 **Summary**
MSFT is poised for a **clean earnings beat** with bullish fundamentals, strong options flow, and upside momentum. This is a **high-conviction, short-dated trade** with defined risk.
🎯 **Watchlist it. Size smart. Exit fast.**

Microsoft: Progress!Microsoft successfully completed the magenta wave (2) and made further progress during the subsequent wave (3). Imminently, this wave (3) has some more room to rise, and after a temporary pullback in the following wave (4), the price should eventually overcome the resistance at $456.16. On the other hand, our 31% likely alternative scenario envisions a new low for the green wave alt. and would include a detour below the support at $348.18. Primarily, we consider the regular wave as already completed (in our previous Target Zone).

Microsoft (MSFT) Becomes the World’s Most Valuable CompanyMicrosoft (MSFT) Becomes the World’s Most Valuable Company
According to financial data, Microsoft’s market capitalisation currently stands at approximately $3.24 trillion, while the valuations of Apple and Nvidia — second and third on the list respectively — remain below $3 trillion.
This follows a sharp surge in Microsoft’s share price (MSFT), which has risen by over 26% from its April low.
Why has Microsoft’s share price risen?
The main driver behind the MSFT stock rally was last week’s quarterly report, which outperformed analysts’ expectations:
→ Earnings per share: actual = $3.46, forecast = $3.22;
→ Revenue: actual = $70 billion, forecast = $68.4 billion.
As reported in the media, investors responded positively to a notable increase in revenue from Azure cloud services.
Technical Analysis of Microsoft (MSFT) Shares
A wide bullish gap — over 7% — pushed the price above a key support line that had underpinned the 2024 uptrend in Microsoft stock.
However, following the report’s release, the price stabilised just below a resistance line drawn through previous key highs.
This provides grounds to interpret the current setup as a symmetrical triangle pattern with an axis around the $427 mark, suggesting short-term price consolidation within the defined boundaries.
Going forward, further key news related to Microsoft — a company less exposed to trade war impacts than Apple — could:
→ help maintain its status as the world’s most valuable firm;
→ support a potential bullish breakout through the resistance line and a continuation of the 2024 uptrend.
This article represents the opinion of the Companies operating under the FXOpen brand only. It is not to be construed as an offer, solicitation, or recommendation with respect to products and services provided by the Companies operating under the FXOpen brand, nor is it to be considered financial advice.

Microsoft (MSFT) Share Price Jumps Nearly 9% – What’s Next?Microsoft (MSFT) Share Price Jumps Nearly 9% – What’s Next?
As the chart shows, Microsoft (MSFT) shares surged sharply, forming a large bullish gap: while trading closed around $391 on 30 April, yesterday’s candlestick closed just below the $425 mark.
What Drove the Rally in Microsoft Shares?
Microsoft released its financial results for the first quarter of 2025, exceeding Wall Street expectations on both revenue (actual = $70.1 billion, 2.4% above forecasts) and earnings per share (actual = $3.46, 7.4% above forecasts).
Particular attention was drawn to the strong performance of Azure – revenue from Azure and other cloud services soared by 33% year-on-year. A significant part of this growth was fuelled by robust demand for artificial intelligence services, which helps ease concerns about the return on large-scale infrastructure investments related to AI.
In addition, Microsoft issued an upbeat outlook for the next quarter, which ultimately triggered the sharp rise in its share price.
Technical Analysis of MSFT Chart
Yesterday’s candlestick closed near its low (highlighted by the arrow), indicating that bears were active during the trading session. From a technical analysis perspective, this can be explained by the proximity of the price to two key resistance lines:
1 → The upper boundary of a descending channel drawn from significant price action patterns (marked in red). The relevance of this channel is confirmed by the price’s behaviour near its median line (dashed).
2 → A former trendline that served as support throughout 2024.
Therefore, a short-term correction cannot be ruled out following the sharp rally in MSFT shares, potentially tempering some of the enthusiasm generated by Microsoft’s strong quarterly report.
This article represents the opinion of the Companies operating under the FXOpen brand only. It is not to be construed as an offer, solicitation, or recommendation with respect to products and services provided by the Companies operating under the FXOpen brand, nor is it to be considered financial advice.

IS THIS MAG7 DARLING ABOUT TO CRASH?!NASDAQ:MSFT
🔥 IS NASDAQ:MSFT ABOUT TO FALL OVER 21%?! 🔥
Let's not panic yet, but Microsoft's weekly charts are flashing some intriguing signals. Here’s the lowdown:
As long as NASDAQ:MSFT stays within its symmetrical pattern, we’re in the clear. But if it breaks downward, we’re looking at a potential 6% drop from the Volume profile shelf and possibly a dangerous 22% plunge, breaking the 2024 Head & Shoulders pattern. Enter the "Low Five Setup"—the bearish counterpart to my "High Five Setup."
Key factors to watch:
- Williams %R: Lower High
- MACD: Dangerously close to crossing below the zero line (BEARISH)
- RSI: Below RSI MA with lower highs, at 46—lots of room before oversold
- Trend: Lower high, red through yellow downward move indicating a downtrend on the weekly chart
Microsoft has been Wall Street’s golden goose, untouched by the FUD that hit the MAG7 stocks. Apple had China FUD, Tesla faced the ELON BAD FUD, Google with AI SEARCH FUD, Amazon with spending and margins FUD, Meta with metaverse spending FUD, and Nvidia with growth concerns FUD.
But as Willy Wonka taught us, every golden goose lays a bad egg sometimes. This is a weekly chart setup, so it will take time to play out. No one's immune to Wall Street’s FUD wrath, not even Microsoft. We shall see what happens...
P.S. I’m not in this name yet—just putting it on your radar. We’re early to the party, just like I always am with my setups. If you’re still here, you value solid, well-thought-out market analysis. Props to you!
Have a great Sunday, friends! 👊
Not Financial Advice #HighFiveSetup #LowFiveSetup

MSFT has room to the daily 50 SMA.NASDAQ:MSFT daily chart shows consolidation just below the daily 50 and 65 EMAs. If MSFT can confirm this daily supply to the upside, there is significant space on the chart up to the daily 50 SMA, which gives this trade a large measured potential. Many NASDAQ:QQQ names have reclaimed their daily 50 SMAs, and as long as the index continues to build above its daily 50 SMA, MSFT is likely to catch up. As MSFT is a thinner name, this trade will be more likely to work during the morning trading session when liquidity is higher.

💻Microsoft Corp💻 is Ready to Decrease➖15%🏃♂️ Microsoft Corp is moving near the 🟡 Potential Reversal Zone(PRZ)($437-$422) 🟡.
💡Also, we can see Regular Divergence(RD-) between two Consecutive Peaks .
🌊From the theory of Elliott waves , it seems that the macro can complete five main impulse waves in 🟡 Potential Reversal Zone(PRZ)($437-$422) 🟡.
🔔I expect the Microsoft Corp to at least fall to the 🟢 Support zone($368_$342) 🟢 after the completion of wave 5 and the breaking of the Uptrend line .
Microsoft Corp (MSFTUSD) Analyze, Daily time frame⏰.
Do not forget to put Stop loss for your positions (For every position you want to open).
Please follow your strategy; this is just my Idea, and I will be glad to see your ideas in this post.
Please do not forget the ✅' like '✅ button 🙏😊 & Share it with your friends; thanks, and Trade safe.

MSFT ~ Snapshot TA (Daily / Nov 2023)NASDAQ:MSFT chart mapping/analysis.
Bullish price momentum within an ascending parallel channel (green).
Bull target(s)
Breakout above ascending trend-line resistance (white dotted)
Upper range of ascending parallel channel (green)
Upper range of ascending parallel channel (light blue)
23.6% Fib + ascending parallel channel(s) confluence resistance zone
Bear target(s)
Underlying gap fills (~357.54 / ~339)
Ascending trend-line support (white dotted)
38.2% Fib
Lower range of ascending parallel channel (green)
38.2% Fib + parallel channel (green) confluence support zone
50% Fib
Gap fill (~280.39) + Golden Pocket Fib confluence support zone
Lower range of ascending parallel channel (light blue)

Microsoft Corp - NASDAQ -Target makes an impulse wave to wave 4 downtrend
- Max "SL" (361.56)
- Target 1 (334.64)
- Target 2 (327.91)
- Target 3 (321.18)
hint>
Weekly Corective wave (Wave 3 to Wave 4)

[EN] MSFT will close the gap of April 2023 // GaliortiTradingNASDAQ:MSFT had a bullish gap in April 2023 from which the last bullish leg originated . It is currently developing a countertrend bearish leg within a descending channel. There is a clear bearish divergence with the oscillator .
We think there is a high probability that it will try to close this bullish gap . To do so, it will have to look for the floor of the current bearish channel (July 2023), which will be pierced. The declines will be stopped by the liquidity zone of $275-280 and the medium-term bullish guideline (December 2018).
From there , the probability of an upward restructuring should be contemplated since a pull-back to the $310 support would be essential to continue rising or to perform a second downward leg (ABC).
Pablo G.

Microsoft 23/10 MovePair : Microsoft Corp
Description :
Symmetrical Triangle as an Corrective Pattern in Short Time Frame , Rejecting from the Upper Trend Line and Demand Zone. Completed Impulsive Waves and Corrective Waves " abc " , If it Breaks the Lower Trend Line and Retest then it will Short
Entry Precaution :
Wait for the Proper Rejection with Strong Price Action

Microsoft accidentally revealed that Xbox Series X|S Microsoft accidentally revealed that Xbox Series X|S sales exceeded 21 million units worldwide
As posted by Twitter user 'John Welfare' after being spotted by @Lukastaves Microsoft held a presentation during this year's BIG Festival in Brazil which is taking place from June 28th through July 2nd. Interestingly, during this presentation, Microsoft showed a sheet revealing Xbox console sales numbers, including sales numbers for the Series X|S.
I don't think this is news at all.
Graphically, the price is testing its monthly high.
In two years, a test of the level.
I think it's a great zone to sell the stock and buy it back cheaper.
marked the green zone.
Waiting for the decline.
if you like the idea, please "Like" it. This is the best "Thanks!" for the author 😊 P.S. Always do your own analysis before a trade. Put a stop loss. Fix profits in installments. Withdraw profits in fiat and please yourself and your friends.

MSFT STOCK STRUCTURE overviewmsft breakout of its structure after 50 percent of the retracement you guys can go for selling opportunity with proper confirmation
