MSFT NASDAQ Trade PlanBullish Indications
1- Ascending parallel channel
2- fib @38%
Bearish Indications
1- Dow: LH and LL
2- Shooting Star
3- trendline support breakout
Biased: Long
Trade Plan A: Long
Buy @current price (323) with SL @ 315
TP1: 331
TP2: 339
Trade Plan B: Short
Sell @current price (323) with SL @ 328
TP1: 315
TP2: 307
Msftidea

MSFT - rest on the way upFibonacci confluence zone, a break in Microsoft is expected until one of those two averages

Microsoft Analysis, The Bulls Are Not StoppingHello everyone, as we all know the market action discounts everything :)
_________________________________Make sure to Like and Follow if you like the idea_________________________________
The MSFT has been having a great year so far and the Bullish trend doesn't seem to be slowing down yet. over the year the trend has been going up and forming new support levels and it started after the fall that happened to the stock on February 13 2020.
MSFT is currently trading near its 52 week high, which is a good sign. The S&P500 Index however is also trading near new highs, which makes the performance in line with the market.
MSFT has an average volume of 21698600. This is a good sign as it is always nice to have a liquid stock.
Scenario for the market action :
The price has reached and brokeout all the daily resistance lines spreading from 301.42 to 304.71, a very strong movement for the stock today, If the bulls were able to keep this momentum up then the stock won't have any problem reaching the weekly resistance line located at 306.86 by the end of the week. but if the trend lost some short-term momentum then we will see the price drop a bit and sit near the 304.71 level for this week.
Technical indicators show :
1) The market is above the 5 10 20 50 100 and 200 MA and EMA (Strong Bullish sign)
2) The RSI is at 65.52 showing Great strength in the market. there is a possibility for a divergence to form soon as the market is showing but nothing too big yet
3) The ADX is at 30.53 showing that the market is trending, With a positive crossover between DI+ (28.33) and DI- (14.33)
Daily Support and Resistance :
support Resistance
1) 298.13 1) 301.42
2) 296.47 2) 303.05
3) 294.84 3) 304.71
Weekly Support and Resistance :
support Resistance
1) 293.34 1) 300.10
2) 290.98 2) 304.50
3) 286.58 3) 306.86
Fundamental point of view :
MSFT has a Return On Assets of 18.36%. This is amongst the best returns in the industry. The industry average is -4.59%. MSFT outperforms 96% of its industry peers, and the stock Profit Margin of 36.45% is amongst the best returns of the industry.
In addition to announcing a six-cent-per-share dividend increase, Microsoft announced a share buyback program. The company’s three-year dividend growth is over 31%, which is exceptional. And this is an example of a stock that is also making growth investors happy. Since the correction at the start of the Covid-19 pandemic, MSFT stock has seen its share price rise 102% as of this writing. The success of Microsoft Teams to facilitate the need for remote work as well as remote learning will likely continue to be a catalyst for some time. Analysts still foresee a nearly 10% upside for the stock from its current price at around $303 per share. According to marketbeat
This is my personal opinion done with technical analysis of the market price and research online from fundamental analysts for The Fundamental point of view, not financial advice.
If you have any questions please ask and have a great day !!
Thank you for reading.

MICROSOFT Daily TIMEFRAMESNIPER STRATEGY
This magical strategy works like a clock on almost any charts
Although I have to say it can’t predict pullbacks, so I do not suggest this strategy for leverage trading.
It will not give you the whole wave like any other strategy out there but it will give you huge part of the wave.
The best timeframe for this strategy is Daily, Weekly and Monthly however it can work any timeframe above three minutes.
Start believing in this strategy because it will reward believers with huge profit.
There is a lot more about this strategy.
It can predict and also it can give you almost exact buy or sell time on the spot.
I am developing it even more so stay tuned and start to follow me for more signals and forecasts.

msft update microsoft still broke the highest but it's time to down , because the market it's saturation of buying
sell the market
MSTF 1H What Can Stop Microsoft's grow Supercycle?Today, we will look at the behavior of the share price of Microsoft Corporation on a global chart.
Patient investors have been gaining the position of Msft shares for 13 long years, and the price itself during this period was stuck in the consolidation of $20-37
However, look at the result: as of now, the share price has risen +1000% , and the super cycle of growth itself has been going on for 8 years.
Moreover, during this long super cycle of growth, there have not yet been significant corrections. The recent news that the Pentagon is breaking a $10 billion contract with Microsoft shook the share price down 1%, but the next day, Msft's share price updated its all-time high.
Even during the Covid market drop in February-March 2020, Msft shares fell by only -30% and left the price within the parabolic rally. For example, then the S&P500 fell by -35%, the DJI index -38%, and for example, the hypes TSLA shares by as much as -60%
By the way, yesterday we made an idea for TESLA, we invite you to view:
For ourselves, we set the bar for the growth of Msft shares to $349-350 , from where a long correction may begin. Of course, against the backdrop of such a powerful growth, it is hard to believe in such a deep correction, but it would be nice to test the strength of the top level of $60 per share for Microsoft
An alternative scenario is a breakout and consolidation of the price above $350 , then nothing will prevent the price from moving further with parabolic growth, and the zone of $825-880 per share of MicrosoftCorporation will wait from above

MICROSOFT records the highest value since inception New support and resistance , probability to correction but the trend remains up

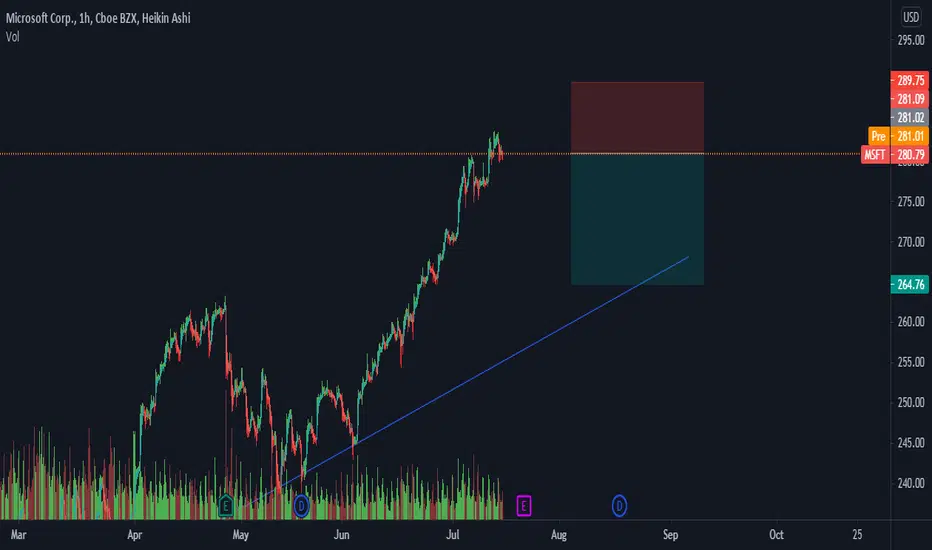
MSFT seems to be going down soonMSFT shows to be overbought, floating, I’m expecting a drop and then pull backs at the 78.60 Fibonacci levels.

MSFT could continue the uptrendMSFT rise yesterday above the last resistance, so I expect an increase in the following days.

Microsoft Long📈 NASDAQ:MSFT LONG H4
🛒Buy above = 245.52
🎯Target1 = 255.23
🎯Target2 = 261.2
🎯Target2 = 270.95
🛑Stop loss or cancel trade = 229.79

$MSFT 6-Month long formation. Microsoft has been seeing a lot of momentum towards the upside, while still holding intact a 6 months symmetrical triangle. I am waiting for another move through our (green) top ray, and to support upon our (blue) 224.49 level.

A potential area to get long for a MSFT swingWith the rotation into value over the past week or two tech has either dropped or consolidated. Looking at MSFT chart we can see some potential weakness in the giant so not all that interested in buying here for the long term. Looking at 206-207 as price target in order to start buying in big on MSFT.

Reversing Short to Long at 209.42
The Ingenuity Trading Model is a Hidden Markov Model with specific inputs related to Price, Time, Volume , and Volatility .

Short on open: 209.40
Real-Time Algorithmic Trading Signals. All trades are based on a Geometric HMM.
The Ingenuity Trading Model is a Geometric Hidden Markov Model with specific inputs related to Price, Time, Volume , and Volatility .
Our Algorithmic Trading Model offers real-time buy or sell signals with specific entry and exit prices. This affords you the freedom to successfully trade across all markets and market regimes. We are not interested in biased economic research or opinions on the latest Wall Street narratives. We do not trade based on conventional financial analysis. Our signals prove the power of taking a more scientific approach to trading the market.

MSFT LONG SET UP (MICROSOFT CORP.)TITLE/(DATE)- BUY MSFT/USD
ASSET- STOCK
PLATFORM-MT4
ORDER TYPE- BUY Market
Time Frame-4hr
ENTRY PRICE 1- $206.50✅ market
ENTRY 2- $202.50 pending
STOP LOSS- $199.50 (70 PIPs)
TAKE PROFIT 1-$213.50 (70PIPS)
TAKE PROFIT 2- $220.50(140 PIPS)
TAKE PROFIT 3- $227.50 (210 PIPS)
TAKE PROFIT 4- $234.50 (280 PIPS)
TAKE PROFIT 5- $241.50 (350 PIPS)
STATUS:🏃🏽♂️RUNNING 🏃🏽♂️
