Msftlong


🚨 Compression On Microsoft! (MSFT)💰 LET'S GET INTO SOME MICROSOFT ANALYSIS!💰
1️⃣ First off SMASH that LIKE BUTTON & Give us a FOLLOW for DAILY ANALYSIS! ❤❤❤
(Overall Market Sentiment) 🐻 Bearish
- Currently showing signs of compression at previous structural high. A pullback would indicate a double top.
- The candle is still green but is a doji at a very critical price area. Next we want to see it xrop below the green and then the red line for a strong selloff.
- All 3 ema dots on the bottom are firing red, indicates a bearish sign.
- I will be taking a short here and setting a 1% stoploss.
Drop a comment down below and share your chart with us, we would love to see what you think will happen next! 🍻🍻🍻🍻🍻❤❤❤❤❤❤
Thanks for checking out our analysis! ✌😁✌
🥇MLT | MAJOR LEAGUE TRADER

🤔 Hidden Bearish Pattern For Microsoft? (MSFT)🐻 Similar to amazon stock I notice a rising wedge from the main structures. This could lead to a fakeout trap as we approach the upside of previous high and selloff.
Patterns do not always mean what they are said to mean in the textbook but we can use them to help us look for our next play. The top of the wedge lines up with previous high. Be cautious. Play short if the bottom support of wedge breaks.
You never know we could get caught off guard and the bulls could run it up. Anything is possible. Just manage the risk if it were to flip.
Happy trading! ✌😁✌
🥇MLT | MAJOR LEAGUE TRADER


MSFTWaiting for the breach of the 50 level strongly to buy!
Exit at level 61 or level 78
Let's wait and see what happens in the coming weeks.
Microsoft longHere is an easy ta from Microsoft long.
At first I want you take a look on gaps that going hand in hand mostly every earnings. In upward trend you can see outbreaking gap on 22. oct followed by exhausting gap on earnings 29. jan.
Then reversal island compared to corona falling shows trend reversal to a short-term downtrend. Strong support around 132 mark continue the primary uptrend amongst others with continuing gap 14. april.
So for next earnings there are some bullish scenarios. As you can see, volume was high last weeks. Like my last ideas also here you must have to watch SP500 (take a minute and compare it, its almost same trend) and here what Fed is pumping on.
In my opionion, next upcoming earnings are accompanied by gaps and high volume. All my bullish scenarios are made for longterm investments:
We have trendline support line around 164 mark, next softcore support is around 156 from uptrend and last but not least the most important support 132 from primary uptrend.
Going up, first resistance is on 180 mark, next is ATH 190.
I think on the fundamental side of life msft is heavy weight in corona crisis and and MSFT Teams, Azure and co could show good growth cause of working home.
Any comments are welcome Im learning ta :)

MSFT is the same configuration than IndicesBreaking 166 would increase confidence in this count. Invalidation at 180.


MSFTA lot going on here I’m watching...
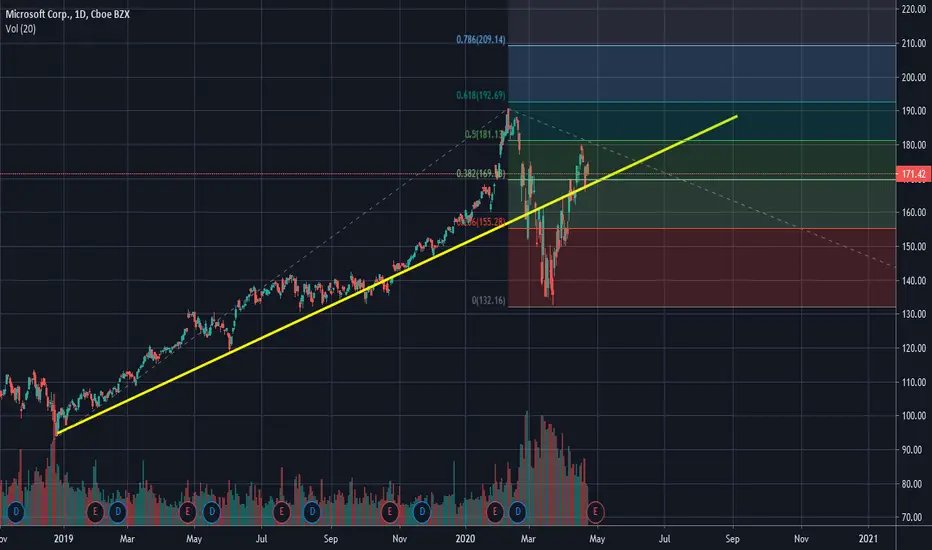
1) ABC up (green) appears to be near completion with impulse wave c near/at a lot of key levels. This would suggest potential reversal.
2) Currently between 618 and 786 retrace levels of overall market drop, suggesting ABC up is near complete.
3) Currently sitting in an important supply level, suggesting potential opportunity to short especially with a completion of the ABC. HOWEVER, the yellow 175 is the top of the previous wave B of the initial ABC market down. If price were to push past this level then...
i) this suggests potential continuation higher as in a regular correction, once price pushes past prior wave B down it can be a signal for an entry LONG.
Sorry a little long, but just my thoughts and opinion. I’m currently just watching price action with no positions entered yet.


Microsoft large cup and handleMSFT has formed a large cup and handle
I expect the cup to land a trendline that extends to 1988
This is the best spot for a long entry


MSFT, 25.3.2020Hi, traders.
My name is Lukas and I am a beginner in trading, respectively, I only trade 6 months. But that means I have to do the necessary analyzes without it I can't trade. I want to show you how I work on myself and document my beginnings. I use Vix and my strategy is built on to return to average. I highlight the important support levels and resistances that flow from the volume profile, all drawn on graph. These zones determine the ability to respond in some way to the market from 1 to 3, with 1 being the largest.
Short description of analysis:
After yesterday's growth today I expect a slight consolidation, the market will gain energy with the help of the FED, and so will have room to rise until the next resistance. This happens after Microsoft teamed up with the WHO to introduce a hackathon about COVID-19. Of course, my analysis does not serve like market forecasts and I am not responsible for your trades if you use my analysis for your own trades.
AND Chceck my new twitter :)

Nearing Support for MSFTLooking for a bounce on the support line (entry) and a retracement to the .382

Long MSFT during COVID-19 Outbreak - Long-TermLong Microsoft ($137.35) after getting beaten down by the coronavirus. Positive outlook after the economy figures itself out. Resistance at $135 and been jumping between 135-148 the past week and a half showing its strength against macro effects. This creates a safe entry position between $135-$148 per share. Or could consider waiting until McGinley Dynamic 20 & lines cross again as a more confident indication of an entry point.

Microsoft hidden bullish divergenceWeekly chart, first off this goes against my case for a depression however I believe tech stocks will prop the market up during these rough market conditions, which is congruent with another one of my previous analyses. The divergence is hidden as RSI shows lower lows while price maintains higher highs, a parabolic move can be seen on MSFT if this continues it may lead to a bearish divergence on the RSI. Best move is to buy here and sell at $160-165 for short term profits, or just go long lol.

Alex Vieira $1 Billion Profit Investing in Microsoft long-termAlex Vieira urged investors to invest in Microsoft long-term since the incompetent Balmer left the company he never downgraded the stock since then

MSFT - LongMy Strategy of "Trend is Friend" with another Large Market Cap Company is here now. I have two Long positions opened with 21% and 26% take profit set and Risk to Reward Ratio is 1/2. Your suggestions will be appreciatable. Thanks

$MSFT Looking real good hereRising wedge on $MSFT. Might be time to look for an entry. This is a real bullish chart and excited to find a position. Look for wedge breakout this upcoming week.

Microsoft broke the All-Time High !Hello, Traders!
Monfex is at your service and today we overview Microsoft .
Last Friday, the Pentagon selected Microsoft as the winner of its winner-takes-all cloud contract, which could be valued as high as $10B.
The Global 2000: The World’s Best Employers List consists of 500 companies.
In the second place - Microsoft !
A Flat top triangle pattern was broken and the price is over the resistance zone with a bullish formation and it's a good buy signal. Bulls dominance.
The target is 127% Fibonacci.
The target zone ~ $155
The local support zone ~ $142-142.5
The support zone ~ $136-137
Market Cap
1096.412B
Share your thoughts, ideas about the market under the chart.
Watch for our Updates to be the first who gets well-timed signals !
GOOD LUCK AND LOTS OF PROFITS !!
Disclaimer
This report is for information purposes only and should not be considered a solicitation to buy or sell any trading assets. Monfex accepts no responsibility for any consequences resulting from the use of this material. Any person acting on this trade idea does so entirely at their own risk.
