BTCUSD — Weekly Inside Bar StructureMarket Context
BTC remains inside a bearish weekly inside bar, defined by 95,950 as the upper boundary and 80,524 as the lower boundary. Until price closes beyond either side, the higher-timeframe structure remains unchanged.
Friday’s low was liquidated, triggering a clean internal rally, but all movement is still contained within the broader weekly bracket.
Technical Frame (CORE5 Logic)
MSM: The sweep of Friday’s low expanded the internal range, but the broader regime remains bearish until 92,716.42 breaks.
VFA: The reaction formed at a negative two-channel volume confluence, a typical exhaustion zone where responsive buyers step in.
OFD: Order flow thinned immediately after the sweep, signaling a low-liquidity reversal rather than sustained demand.
PEM: The internal long was valid and the stop-to-breakeven logic holds, but conviction remains tactical until weekly structure confirms.
The key internal level is 92,716.42.
A clean break above it would mark the first meaningful bullish structural shift since the weekly inside bar formed.
Fundamental Context
Next week’s macro calendar—CPI, PPI, Retail Sales—anchors the landscape.
Weekly bias depends on how BTC behaves around the internal high as macro volatility increases.
Until then, internal rallies remain part of the broader weekly compression.
CORE5 Rule of the Day
Structure sets the truth. Emotion sets the trap.
Summary Insight
BTC remains in controlled weekly compression.
Internal rallies gain meaning only if structure confirms.
92,716.42 is the hinge.
— CORE5DAN
Institutional Logic. Modern Technology. Real Freedom.
MSM

BTCUSD — next Target 89,697 CORE5 Pillar: MSM (Market Structure Mapping)
Bitcoin balanced last week’s imbalance and rejected lower with strength, showing buyers are still present at the lower liquidity pockets.
The internal structure remains bullish, even though price continues to operate inside a defined range.
Current behaviour shows rotation through discount rather than trend continuation. This confirms that participation is still intact and the structural map hasn’t broken.
The mid-range liquidity pool at 89,697 is the most logical magnet if buyers maintain control inside discount.
Until that level is cleared with conviction, expect rotation instead of expansion. Price still respects the range environment, and behaviour continues to favour a move into the mid-range liquidity before anything larger develops.
Bullish bias remains valid — but the range is still in control.
Respect the map. Follow the liquidity. Read behaviour, not hope.
— CORE5DAN
Institutional Logic. Modern Technology. Real Freedom.

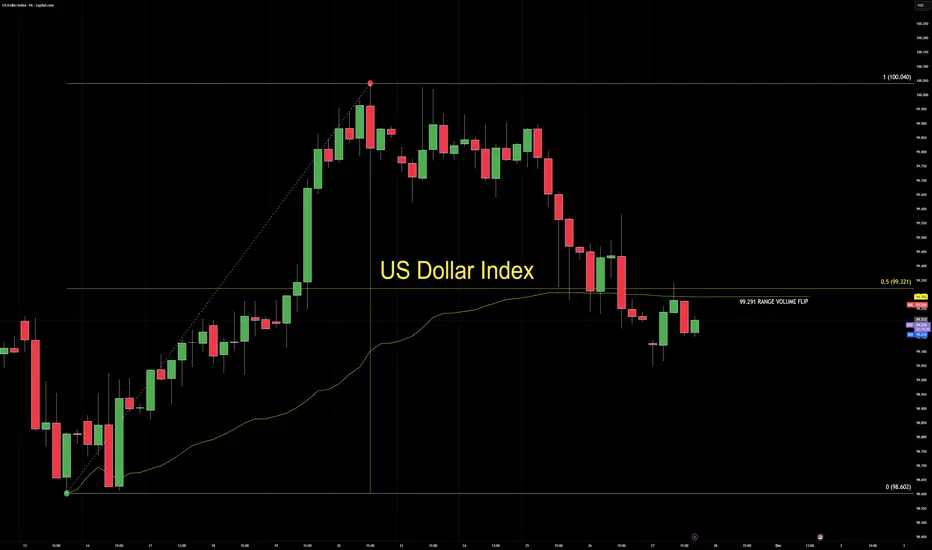
US DOLLAR UPDATEDollar is trading in the discount of the daily bullish range, losing momentum, and flipping the range volume node bearish at 99.291.
Range 98.602 → 100.040.
1. DRIVERS
Softening Dollar with fading participation.
2. STRUCTURE
Discount test with weak rotation.
Bearish node flip shows shifting participation, not a macro break.
3. IMPLICATION
Range location doesn’t confirm a flush.
Cross-market rally only forms when yields, risk tone, and correlations align.
4. CORE5 PILLARS
MSM: discount test
DGM: momentum fading
VFA: bearish flip at 99.291
OFD: no strong absorption
PEM: wait for confirmation
5. TAKEAWAY
This is a probe, not a confirmed reversal.
— CORE5DAN
Institutional Logic. Modern Technology. Real Freedom.
The 74,420.69 Decision Zone: Bitcoin’s Next Regime Depends on ItBitcoin is approaching 74,420.69, a long-term structural decision level where macro conditions, liquidity behavior, and monthly market structure converge.
Macro conditions are tightening: the Dollar is firm, yields are stable, and liquidity across major crypto venues is thinner into month-end. This is the first time BTC has tested a structural ceiling under genuine macro pressure.
Key upcoming catalysts influencing liquidity and Dollar direction include U.S. CPI, Core CPI, PPI, FOMC Minutes, weekly labor data, consumer confidence, month-end rebalancing flows, and Q4 options positioning. BTC is meeting structural resistance at the exact moment these events cluster.
From a Market Structure Mapping perspective, the monthly bullish regime remains intact only if November closes above the prior range low. A close beneath that threshold would trigger a rare long-horizon regime inversion, shifting models from accumulation toward distribution. Monthly structural breaks are uncommon and typically define multi-year liquidity cycles.
Participation metrics confirm the tension. Volume Flow Analytics shows significant absorption at the high, with buy-side flows consistently consumed across major venues. Order Flow Dynamics aligns, indicating buyers being absorbed rather than defended — a common pattern at structural ceilings.
74,420.69 is not a target. It is the structural axis around which Bitcoin’s next multi-year regime will form. Confirmation requires the monthly close.
— CORE5DAN
Institutional Logic. Modern Technology. Real Freedom.

BTCUSD updateMacro Context
Dollar strength, rising U.S. yields, and elevated volatility keep global risk conditions defensive.
Crypto follows that tone: liquidity is cautious, and participation slows ahead of a heavy macro week.
Crypto News Snapshot
Bitcoin trades near a six-month low as fading rate-cut expectations pressure risk assets.
Ethereum headlines a new “supercycle” claim, though critics question whether fundamentals support it.
XRP gains attention as ETF-related institutional flow expectations rise.
MSM — Market Structure Mapping
BTC trades in the daily discount zone under prior bearish highs.
Liquidity from last week’s 92,630 remains active.
VFA — Volume Flow Analytics
The previous bullish volume node is lost.
Participation favors defensive flow rather than expansion.
OFD — Order Flow Dynamics
Orderflow is bearish at negative 2 deviation levels.
Sell-side engagement is cleaner than buy-side behavior.
PEM — Precision Execution Modeling
Engagement is difficult at these levels.
Dollar strength and rising yields tighten conditions across crypto and risk assets.
Until macro stabilizes, stick to structure + flow alignment.
No anticipation. Only confirmation.
CORE5 Rule of the Day
Slow down when the macro speeds up.
One-Line Summary
BTC trades in a defensive macro regime with selective participation and a neutral-to-cautious bias.
— CORE5DAN
Institutional Logic. Modern Technology. Real Freedom.

DXY Is Entering a Decision Zone — The Next Move Starts Here.DXY | Neutral Bias | 4H Frame
CORE5 View: Price has filled its inefficiencies and now meets the weekly balance head-on. This is the decision point for the next impulse.
Fundamental Context
Tomorrow is the real driver: PPI + jobless claims, with CPI right behind it.
These three data points set the short-term path for the dollar’s yield expectations.
Markets are holding steady into the releases — no rush, no conviction.
This is a waiting zone until numbers show direction.
Market Structure Context
Price has pushed into the discount side of the 4H range, tapping the same zone that has triggered rotations before.
All single prints beneath have now been filled, removing imbalances.
Now the structure is pressing the weekly balance at 98.766, a level that normally slows momentum and forces the market to show its hand.
This is where structure decides between rotation or continuation.
MSM — Market Structure Mapping
The 4H structure carries a bearish tone, but it is pushing straight into weekly balance, which often neutralizes momentum.
Nothing is broken, but nothing is confirmed.
This is where professionals wait for liquidity to choose dominance.
DGM — Dynamic Geometry Modeling
The downward leg into discount matches the prior leg in size and rhythm.
Symmetry is complete.
Geometrically, this is a natural location where rotation can start — but only if liquidity agrees.
VFA — Volume Flow Analytics
Anchored volume sits at 98.725, only a few points below current price.
This is a reliable decision level:
• Rotation often begins here when volume defends.
• If price accepts below this node, bearish continuation opens quickly.
It’s a participation pivot — the market chooses, not us.
OFD — Order Flow Dynamics
Order flow still favors the bearish side.
No meaningful attempt higher, no failed push, no shift in intent.
Buyers are quiet; sellers are steady.
Patience here protects capital.
PEM — Precision Execution Modeling
We’re sitting mid-range into end-of-day liquidity with clear pools both above and below.
In these conditions, price often drifts, cleans both sides, and waits for tomorrow’s data.
For cross-market positioning, holding off until USD bias confirms is the professional move.
🧠 CORE5 Rule of the Day
“Context leads. Direction follows. Structure only works when you let it speak first.”

BTCUSD | Bearish Range | Daily — Market on Hold Ahead of CPIBTCUSD’s still in a bearish structure, bouncing between the two volume fractal pivots — 106463 and 100996. It’s hanging near the bottom of the daily range (116410 to 98892) with no clean push either way. Volume flow’s midrange around 108333, showing balance — no real momentum. With dollar strength and CPI data on deck this week, the market’s just soaking liquidity and waiting for the next macro trigger to hit.
Volume tells the truth before price does!
-core5dan

BTCUSD UPDATE Yesterday, BTCUSD hovered near 106,463, staying quiet most of the day.
This morning, the Euro session broke that balance — ran yesterday’s high, triggered stops, and dropped fast. ETF inflows that pushed price earlier in the week slowed down.
Funding turned negative, showing traders are less confident short term.
Now price trades lower, and yesterday’s low is the next level everyone’s watching.
Macro Outlook
Markets are leaning defensive.
Yields up. Dollar steady. Stocks soft.
Bitcoin’s moving with that tone as flows cool off and liquidity thins out.
Until that changes, BTCUSD stays under pressure with weak momentum and cautious buyers.
Market Structure Mapping (MSM — The Framework)
Structure still leans bearish, but there’s no confirmed break yet.
Price is trading away from the last discount pullback, holding below the Euro session high.
Downside focus sits near 104,240, then 101,500, where equal lows and liquidity line up.
If yesterday’s low breaks clean, the bearish leg extends.
For now, price is drifting lower — not broken, just soft.
CORE5 Rule — “Trade what’s confirmed, not what you think.”
— CORE5DAN
Institutional Logic. Modern Technology. Real Freedom.

BTCUSD — All Targets HitCORE5 Market Note
- Market Structure Mapping (MSM)
Bitcoin (BTCUSD) hit our weekend targets early and bounced from the volume fractal at 106.463.
Price still trades inside the bearish range from 116.432 (high) to 98.952 (low) — the same structure carried over from last week.
BTC is now testing the midrange zone, trading lower within the daily structure.
MSM shows a sell reaction from the fractal, but we still need a proper shift in structure before bias confirms.
For now, it’s a waiting game — the London session already delivered strong moves, so patience remains the higher-probability play.
- Volume Flow Analytics (VFA)
The weekly fractal near 100.996 has absorbed nearly five days of price action — a clear zone where buyers stepped in with size.
Above, the 106.463 fractal marks where sellers defended, creating two strong reference points that now frame the market.
These levels must break before any clear directional bias forms.
Until then, it’s still a waiting game.
- Macro Context
The U.S. dollar softened as traders expect more Fed rate cuts ahead, while Washington moves closer to reopening the government.
That calmer tone helped risk markets rebound — Bitcoin included.
If yields stay near 4.1% and confidence keeps building, crypto has room to recover.
But a sudden dollar rebound could flip sentiment fast.
🧠 CORE5 RULE: The next move doesn’t need you — it needs confirmation.
— CORE5DAN
Institutional Logic. Modern Technology. Real Freedom.

DXY — Range Structure HoldsThe US Dollar Index (DXY) started the week trading just below a bearish distribution fractal low at 99.321. Price holds inside a short-term bearish range between 99.000 (low) and 99.500 (high) while still operating within the broader daily bullish structure. DXY is currently moving through the daily imbalance cap near 99.035, sitting in the premium zone — compression remains active as larger participants stay patient. Market Structure Mapping (MSM) shows price tightening in that upper zone — the calm before the bigger players step in.
Market Structure Mapping (MSM) shows price pressing into the daily imbalance high near 99.035, lining up with the range-low fractal around 99.032. That’s the lower edge of Monday’s structure — tight, clean, and holding steady. Volume Flow Analytics (VFA) points to order-flow absorption — buyers keep hitting the tape, but liquidity keeps taking the other side.
It’s that slow-burn type of session where participation fades and bigger players quietly build positions under the surface. If that pattern holds, price could drift back toward the discount area once participation increases.
No rush — London already had its short trade this morning.
Now it’s just about waiting for confirmed order flow before taking the next setup.
The dollar’s steady as Washington works on a funding deal to end the government shutdown, calming market nerves.
Ten-year Treasury yields hover just above 4.1 %, keeping a floor under USD as investors still get paid to hold dollars.
Inflation’s sitting near 3 %, growth data is mixed, and delayed reports mean traders are reacting more to headlines than numbers.
For now, yields and improving political tone offer support — but it’s not bulletproof.
If debt or growth headlines turn sour again, that support can fade fast.
🦅 CORE5 RULE:
Slow days build strong traders. Wait for the flow, not the noise.
— CORE5DAN
Institutional Logic. Modern Technology. Real Freedom.

XAU/USD Update 1Next move on the way, focus on proper risk management & stay discipline. Wishing you successful trades..!
Key Reason:
1. 1H OB key point.
2. Fresh and unmitigated Supply order flow still in pending.
3. SIBI still in pending.
4. Possible downside move expected from this zone.
Confirmation is most important part of this analysis. Let's see how it will work.

MSM - Move Up To Top of Expanding StructureA large expanding wedge structure on the Weekly timeframe.
A channel can be drawn using a higher low which reveals a path towards the top of this structure.
Lets see what happens.

crude oil wti working out head and shouldersThe mainstreams media hype with Russia cuttoff oil will be over soon...
as crude oil is properly working out head and shoulders pattern

$MSM with upside potential of 70% ??
Technical Wise:
After breaking out of the downtrend, it has been consolidating with healthy volume. Price also moving in higher low while the share price holding above 200-EMA. With this formation, I am expecting to see the price to challange recent high again and has upside potential of 70% which can meet RM 2.7, in mid-to-long term.
Like my post on Malaysian Stock? Come and join stockbit, I usually share my ideas there: stockbit.com/post/7577753
and follow me on the platform or whichever places you like.
Follow me: my.stockbit.com/#/gibsontan
----------------------------------------------------------------------------------------------------------------------------------------------------------------------------
I believe Malaysian sure has clues of brand of Gula Prai, and the company behind that is MSM, which they produce produces, markets and sells refined sugar products. After years down-trending, finally the share price finally break made a comeback in after FEB2021 , followed by good financial turnaround for 4Q2020 after 2 years of loss-making.
I remain bullish with the counter as the trading setup has sparks my interest. On its prospects wise:
🍬 The positive earnings can be sustained as the recovery of domestic sales as economy reopens and more socioeconomic activities leading to more product consumption including sugar.
🍬 Room to grow for the current utilisation rate of 47%, which the company aimed to grow the rate above 50% as mentioned in AR2020. This shall better improve efficiency and result in lower refining and production cost.
🍬 Increasing exposure potential in exports would benefit MSM, as the global sugar retail price has gone up. This put their exports segment to better margin given that they are able to sell at higher price. As in Malaysia, sugar price has capped at ceiling price of RM 2.85 per kg, if any news to revise the capped price would be good for MSM in general.
🍬 Good hedging position in raw sugar price. As the global raw sugar price has gone up to 19usd, it would not reduce MSM margin because the group has fully hedged its raw sugar for 2021 at 0.13-0.14 usd/lbs while 85% of for 2022 at 0.16-0.17 usd/lbs. It can secure better margin for MSM.

MSM - Downtrend Line BreakoutMSM - Changes direction from breaking the downtrend line. Pending Resistance to break at 1.41.

MSM Major Support & ResistancePersonally, what I learnt is there must be a Technical Analysis Strategic Plan in order to increase the risk-to-ratios favourable risks.
1. Draw Support & Resistance
2. Identify the stages (Accumulation, Advancing, Distribution, Declining)
3. Entry Triggers
4. Stop Loss
5. Exits
I have learnt during my past mistakes that we should let the stock price comes to us, rather than us chasing the stock prices!

JSE:MSM Massmart The CO is BuyingHigh volumes in Massmart is pushing the price higher and buying is becoming ever increasingly desperate. A bigger bar than has been seen with some volume but not that high is showing that the has been bought up by the "Composite Operators"/"Strong Hands" and there is not enough stock to satisfy the demand. This should push the price higher.

MSM - Bearish candle (Shooting Star)A move below Friday's lows of R34.60 will trigger the short idea with a stop loss above R36.30. Target will be R30.

MASSMART HOLDING - MSMThis is not a financial advice - Open to criticism and feedback
MSM -MASSMART HOLDING LTD
Current Price R24.68
I'll be honest I looked at all timeframe to try and find something bullish about this chart but all I can see is the price going to R20 at the very least. If you want to play this I suggest placing orders at R19.45 - R18.85 or there about to try and catch the wick (Weekly Block).
Only one thing that you can keep an eye is the RSI which oversold on the Monthly and weekly
Follow me on Twitter (mainly shit posting and few trading tips but mainly meme)
@muazcoin

JSE:MSM Massmart AccumulationMassmart has seen high volume from buyers pushing price up. After a short accumulation range price is now being marked up. Price has broken the 200 day sma. The relative strength has turned up and there is negative divergence on the volume RSI indicating effort without response.

9 Similarities Between Poker Vs TradingMassmart is looking like it's going down big time thanks to a weekly Double Top formation...
In today's article we'll discuss the 9 Similarities Between Poker Vs Trading...
Enjoy...
Is trading a form of gambling?
With hesitance, I would say yes.
However, I would rather call trading a form of strategic gambling as both require elements of risk, reward, strategy and decision making.
In the next two weeks or so, I'm planning to publish a new online FREE book called “Poker Vs Trading”.
Who knows, by the end of it all you may take up professional poker playing as well as trading…
Let’s start with the similarities.
SIMILARITY #1:
We can choose when to play (Strategy)
Traders and poker players don’t play every hand that is dealt to them.
With poker, when a hand is dealt, we can choose to either play the hand, based on how strong it is, or we can choose to fold and wait for the next hand...
With trading, we wait for a trading setup based on the criteria of our strategy i.e. MATI Trader System.
You’ll then have the exact criteria and money management rules to follow in order to take a trade or wait for the next trade.
SIMILARITY #2:
Amateur poker players and traders tend to go the ‘tilt’ (Emotional roller-coaster)
Emotions are a main driver which leads to traders losing their cash in their account or poker players losing their chips very quickly.
With poker, you get players who let their emotions take over where they start betting high with an irrational frame of mind. These emotions lead them to losing their chips very quickly. This is when they enter the state of what is called ‘going the tilt’.
With trading, amateur traders also tend to act on impulse and play on gut, instinct, fear and greed after they’ve undergone a losing streak or a winning streak. This often leads them to:
· Taking a series of losses.
· Losing huge portions of their portfolio.
· Holding onto losing trades longer than they should.
· Entering a mindset of revenge trading.
SIMILARITY #3:
We know when to hold ‘em and when to fold ‘em (Cut losses quick)
We have the choice to reduce our losses when it comes to betting a hand or taking a trade.
With poker, if the players start upping the stakes and you believe you have a weaker hand in the round, you can choose to ‘fold’ and lose only the cost of playing the ‘ante’.
With trading, if you’ve taken a trade and it turns against you, you have a stop loss which will get you out at the amount of money you were willing to risk of your portfolio…
SIMILARITY #4:
We know the rake (Costs involved)
There are always costs associated with each trade we take or each hand we play, which eats into our winnings.
With poker, it’s the portion of the pot that is taken by the house i.e. the blinds and the antes.
With trading, it’s the fees charged by your broker or market maker, in order to take your trade. These fees can be either the tax, spread and/or the brokerage.
SIMILARITY #5:
Aggressive trading and betting before the flop (High volatility)
There will always be a time of strong market moves and high betting.
With poker, you get times where players like to bet aggressively and blindly before the flop is revealed. It’s these times that lead to the amateur poker players losing their chips very quickly.
With trading, you get economic data i.e. Non-Farm-Payrolls, black swan events and Interest Rate decisions when big investors and traders like to drive the market up or down before the news even comes out.
NOTE: I ignore both forms of hype as it is can lead to a catastrophic situation.
SIMILARITY #6:
We bet and trade based on the unknown
Every bet and trade we take and play is based on incomplete information of the future.
With poker, we are dealt hands then bet on decisions based on not knowing what cards our opponents have and/or what is shown on the river. We then have the options to call, bet, raise or fold during the process.
With trading, we take trades based on probability predictions without knowing where the price will end up at.
This is due to new information which comes into the market including (demand, supply, news, economic indicators, micro and macro aspects).
SIMILARITY #7:
We lose A LOT! (Losses are inevitable)
Taking small losses are part of the game with both poker and trading.
With poker, it is important to wait patiently until you have a hand with a high probability of success.
Some of the best poker players in the world, fold 90% of the starting hands, they receive. Some professional poker players can go through weeks and months without a win.
With trading, we can lose over 40% to 50% of the time.
In general, I expect around two losing quarters a year. I know that when there are better market conditions, it will make up for the small losses.
SIMILARITY #8:
You must learn to earn (Education is vital)
You need to understand and gain as much knowledge as you can about poker and trading before you commit any money.
With poker, you need to understand:
• The rules of the game.
• The risk per move.
• The amount of money you should play per hand.
Once you know these points, you’ll be able to develop some kind of game plan with each hand you play.
With trading, you need to understand:
• The MARKET (What, why, where are how?)NB*
• The METHOD (What system to follow before taking a trade).
• The MONEY (Risk management rules to follow with each trade)
• The MIND (The frame of mind you must develop to succeed)
SIMILARITY #9:
Perseverance is the key ingredient to success
You need to take the time and have the determination to become a successful trader and poker player.
With poker, you’ll need to keep at it and apply strict money management rules with each hand played.
With trading, you’ll need to know your trading personality, know which trading method best works you and understand your risk profile…
I’ll leave you with a quote from Vince Lombardi (American football player, coach, and executive):
“Practice does not make perfect. Only perfect practice makes perfect”
Do you have any similarities between trading and poker?
Let me know and I’ll add it to my new book “Trading Vs Poker”, and I’ll send it straight to your email address…
You can email me at www.timon@timonandmati.com.


Massmart setting up for a move higher? $JSEMSMMassmart has been a serious under-performer in the retail sector this year, shedding some 37% off its levels seen at the end of last year. With the SARB likely to cut interest rates at their meeting next week, perhaps this will be a little kicker for consumers which should benefit most of our local retailers. The share may be just a little too oversold for the time being, and should we manage to break out this box between R61.50 to R67.60, we could see the counter make a counter trend rally up into the R77 - R80 range. This level of R80.00 was previously significant horizontal support which could now turn into resistance if we get there. What makes this R80 level more significant is the fact that this also coincides with a major downtrend which has been in place since the highs in March 18, which the stock has battled to overcome on 4 prior tests. The RSI indicator on the daily is also making higher lows, notwithstanding price which has gone sideways which further adds conviction to my bullish call in the short term. I would take my bets on a rally from current levels up to R77-R80, and perhaps if we do see that level it could be a great area to reverse the position short.
