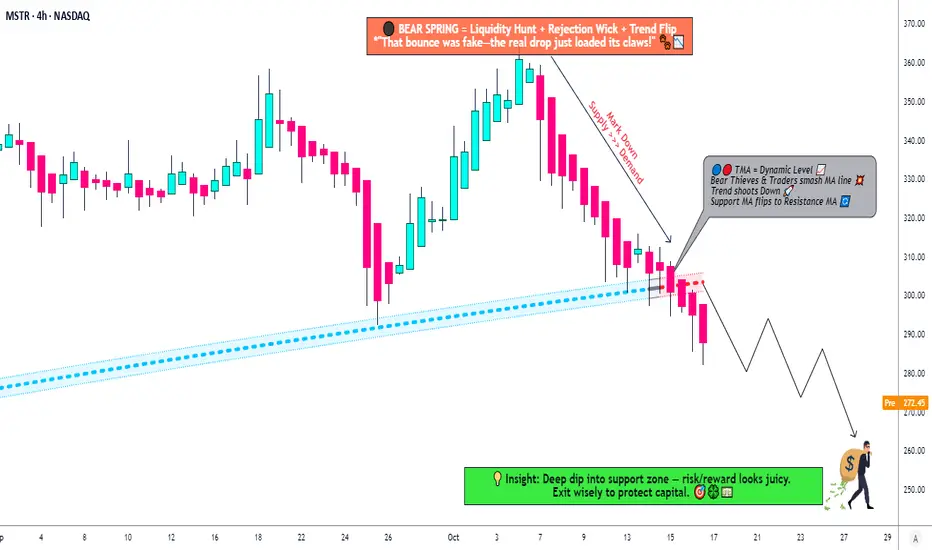
MSTR EXITING DEC 29 2025I am exiting Mstr almost cost to cost as i feel there are way better stocks to trade than this.
Yes, it can definitely go up but I would like to put my in way better opportunities out there
If you are going long make sure to always consider STOPS
I am exiting
Mstranalysis

MSTR BULLISH DEC 25 2025MSTR is looking bullish and I have discussed the price action deeply. If you have any questions feel free to DM me.
NOTE: DO NOT BUY CALLS & YES YOU CAN SELL PUTS

WATCH FOR MSTR HIGH PROBABILITY LONG SETUP SOON!!!🚨 MSTR HIGH PROBABILITY BUY SETUP 🚨
* Here We Can See Clearly The Next Potential Moves For MSTR Coming Hours/Days.
* Keep Your Eyes Close On Your Trading Positions.
* Happy PIP Hunting Traders.
FXKILLA.

MSTR: Time to Short? Death Cross + Triangle Break Analysis🐻 MSTR "STRATEGY INC." - The Bear's Playground | Thief's Multi-Layer Setup 💰
📊 MARKET SNAPSHOT
Asset: NASDAQ:MSTR (Strategy Inc. - formerly MicroStrategy)
Current Price: ~$291.23 (Oct 17, 2025)
Setup Type: Swing/Day Trade - Bearish Confirmation
Strategy Style: "Thief Method" - Layered Limit Orders 🎯
🔍 THE SETUP - Why This Bearish Play Makes Sense
Ladies and Gentlemen, welcome to the Thief's playbook! 👋 MSTR just gave us a beautiful bearish signal with a triangular moving average breakdown. Here's what the charts are screaming:
🎯 The "Thief" Entry Strategy - Layered Limit Orders
This isn't your typical "buy now" play. We're sneaking in like a thief in the night with MULTIPLE SELL LIMIT LAYERS:
Entry Zones (Layer Your Shorts):
Layer 1: $310 (First resistance retest)
Layer 2: $300 (Psychological level)
Layer 3: $290 (Current consolidation zone)
💡 Pro Tip: Scale into your position! You can add MORE layers based on your risk tolerance (e.g., $305, $295, $285). The "Thief Method" is all about spreading your entries to catch the perfect price zones.
🛑 RISK MANAGEMENT - The Thief's Insurance Policy
Stop Loss: $320 🚨
(This is the Thief's emergency exit - if price breaks above this, the bears lost control)
⚠️ IMPORTANT NOTE:
Dear Thief OG's (Original Gangsters), this is MY stop loss level based on MY analysis. You should set YOUR OWN stop loss based on YOUR risk tolerance. Don't copy blindly - manage YOUR money, take YOUR profits (or losses) at YOUR own risk! This is YOUR trade, not mine. 💯
🎯 PROFIT TARGET - Where the Money's Hiding
Primary Target: $250 🎉
Why $250?
Strong historical support level
Oversold bounce zone (RSI typically rebounds here)
TRAP ALERT: Institutional buyers often accumulate at this level - be ready to ESCAPE with your profits before the bulls wake up! 🐂💤
⚠️ TAKE PROFIT NOTE:
Dear Thief OG's, $250 is MY target based on MY analysis. You can (and should) set YOUR own targets. If you're in profit at $270, $260, or even $280 - TAKE THE MONEY AND RUN! 💰 No shame in banking profits early. Remember: pigs get fat, hogs get slaughtered. This is YOUR trade, YOUR risk, YOUR decision!
🔗 RELATED ASSETS TO WATCH - The Correlation Game
MSTR doesn't trade in a vacuum! Keep your eyes on these correlated assets:
📈 Primary Correlation:
CRYPTOCAP:BTC (Bitcoin): ~$108,625 (Oct 17, 2025) - MSTR holds 640,000+ BTC (3%+ of total supply!)
Correlation Strength: 🔥🔥🔥🔥🔥 ULTRA HIGH
Why It Matters: MSTR is essentially a leveraged Bitcoin play. When BTC sneezes, MSTR catches a cold. Bitcoin's current bearish pressure directly impacts MSTR's valuation.
🔄 Secondary Watchlist:
NASDAQ:COIN (Coinbase): Crypto exchange - sentiment indicator
NASDAQ:RIOT (Riot Platforms): Bitcoin mining stock
NASDAQ:MARA (Marathon Digital): Another BTC-related equity
NASDAQ:CLSK (CleanSpark): Bitcoin mining operations
Key Point: If Bitcoin breaks below $105K support, expect MSTR to accelerate downward. Conversely, if BTC rallies back above $115K, this bearish setup could invalidate. Watch Bitcoin like a hawk! 🦅
📊 THE BIGGER PICTURE - Why MSTR Is Vulnerable Right Now
Bitcoin Pressure: BTC down -2.19% today, testing critical support levels
Institutional Caution: Recent S&P 500 rejection (not included in index) = credibility questions
Valuation Concerns: Trading at significant premium to NAV (Net Asset Value)
Technical Breakdown: Multiple MA crosses + trend reversal signals
Macro Headwinds: Risk-off sentiment in crypto markets (3-day consecutive decline)
🎓 THE THIEF'S WISDOM - Final Thoughts
This setup combines:
✅ Technical confirmation (MA breakout)
✅ Layered entry strategy (better average price)
✅ Clear risk management (defined stop loss)
✅ Realistic profit targets (strong support zone)
✅ Correlated asset monitoring (BTC relationship)
Remember: The market doesn't care about your opinion. Respect the charts, manage your risk, and don't get greedy. The "Thief Method" is about stealing profits intelligently, not gambling recklessly! 🎰❌
💬 TRADE SMART, NOT HARD!
This is a BEARISH SETUP with defined entries, exits, and risk parameters. Whether you're swing trading or day trading, the key is DISCIPLINE. Stick to your plan, don't chase, and protect your capital.
Questions? Thoughts? Drop them below! 👇
Let's build a community of smart traders who help each other win! 🤝
✨ If you find value in my analysis, a 👍 and 🚀 boost is much appreciated — it helps me share more setups with the community!
#MSTR #Bitcoin #BTC #TradingView #SwingTrading #DayTrading #BearishSetup #ShortSetup #CryptoStocks #TechnicalAnalysis #MovingAverages #LayeredEntry #RiskManagement #ProfitTarget #StrategyInc #MicroStrategy #ThiefMethod #TradingStrategy #StockMarket #NASDAQ
MSTR HIGH PROBABILITY LONG SETUP SOON!!!🚨 MSTR HIGH PROBABILITY BUY SETUP 🚨
* Here We Can See Clearly The Next Potential Moves For MSTR Coming Hours/Days.
* Keep Your Eyes Close On Your Trading Positions.
* Happy PIP Hunting Traders.
FXKILLA.

MicroStrategy Under Pressure: Bearish Playbook in Action🎯 MSTR: The "Thief's Playbook" - Strategic Bear Trap Setup! 💰🔥
📊 Asset Overview
MicroStrategy Inc. (MSTR) - Bitcoin's Proxy Play in the Stock Market
🎭 The Setup: When Bears Come to Party
Alright folks, gather 'round! We've got ourselves a textbook triangular moving average breakdown on MSTR that's screaming "short opportunity" louder than my portfolio after a bad trade week! 😅
Current Market Sentiment: 🐻 BEARISH CONFIRMED
The technicals are aligning like planets before a lunar eclipse - and trust me, this eclipse might cast some shadows on those long positions!
🎯 The "Thief Strategy" Game Plan
🚪 Entry Zones - The Layering Approach
Here's where it gets spicy! 🌶️ Instead of going all-in like a degen at a casino, we're using the "Thief Layering Method" - multiple limit sell orders to scale into this position:
Suggested Entry Layers:
🥇 Layer 1: $300
🥈 Layer 2: $290
🥉 Layer 3: $280
💎 Layer 4: $270
🔥 Layer 5: $260
Pro Tip: You can add MORE layers based on your risk appetite and account size. More layers = Better average entry = Smoother sleep at night! 😴
🛡️ Risk Management - The "Oh Sh*t" Line
Stop Loss: 🚨 $320
⚠️ IMPORTANT NOTICE: Dear Thief OGs, Ladies & Gentlemen! This SL is MY line in the sand. YOU need to decide YOUR own risk tolerance. Trade at your own risk, manage your own money, and don't blame me if things go sideways! This ain't financial advice - it's entertainment with charts! 🎪
🎁 Target Zone - Where We Cash Out
Take Profit Target: 🎯 $210
Why $210?
💪 Strong historical support level
📉 Oversold territory expected
Classic bull trap zone where longs get liquidated
⚠️ ANOTHER IMPORTANT NOTICE: Thief OGs! This is MY target. You do YOU! If you see profits earlier and want to secure the bag - DO IT! Don't be greedy. Take profits when YOU feel comfortable. Your account, your rules, your responsibility! 💼
🔗 Related Assets to Watch - The Correlation Game
Keep your eyes on these bad boys for confirmation:
📈 Direct Correlations:
NASDAQ:MARA (Marathon Digital) - Bitcoin miner, moves with crypto sentiment
NASDAQ:RIOT (Riot Platforms) - Another BTC miner, similar volatility pattern
NASDAQ:COIN (Coinbase) - Crypto exchange, sentiment indicator
CRYPTOCAP:BTC (Bitcoin spot) - The godfather! MSTR holds massive BTC, direct correlation
🧠 Key Points:
MSTR trades with ~1.5x-2x Bitcoin beta (more volatile than BTC itself)
When Bitcoin dumps, MSTR often dumps HARDER 📉
Watch BTC support at $60K - if it breaks, MSTR likely follows to our target zone
Tech sector weakness ( NASDAQ:QQQ , AMEX:SPY ) adds bearish pressure
⚡ Trading Psychology - The "Thief Mindset"
Look, this setup requires PATIENCE! 🧘♂️ Don't FOMO in at market price. Layer in like a professional thief planning a heist - calculated, methodical, strategic! This isn't gambling; it's probability management with a side of humor! 😎
🎪 Final Word from Your Friendly Neighborhood Chart Thief
Remember: Markets are wild, unpredictable, and don't care about your feelings OR your bills! This analysis is for educational and entertainment purposes ONLY. The "Thief Strategy" is MY trading style - it's risky, it's aggressive, and it's definitely NOT for everyone!
Do your own research. Manage your own risk. Trade what you can afford to lose. And for the love of all that's holy, don't mortgage your house based on some random internet chart analysis! 🏠❌
✨ If you find value in my analysis, a 👍 and 🚀 boost is much appreciated — it helps me share more setups with the community!
🏷️ #MSTR #MicroStrategy #ShortSetup #BearishBreakdown #SwingTrade #DayTrade #ThiefStrategy #BitcoinStocks #TechnicalAnalysis #MovingAverageCrossover #LayeringStrategy #RiskManagement #StockMarket #TradingIdeas #BTC #CryptoStocks #BearTrap #SupportAndResistance #ChartAnalysis #TradeSmart
🎯 Trade smart, layer in, manage risk, and may the profits be ever in your favor! 💰🚀
$MSTR: Rough sailing for Saylor. Trading strategy for Strategy.Since the largest crypto liquidation event on 10th of Oct which yipped out 19 B $ of leveraged positions the Crypto market finds itself in turmoil. One of the major causalities of all this FUD has been MicroStrategy. The stock NASDAQ:MSTR is now trading 2.3% below the NAV. That means the cos. NASDAQ:MSTR is 2.3% less valuable than the amount of CRYPTOCAP:BTC it holds on to its balance sheet. This signifies the market is pricing a lot of short to medium term downturn in the fundamentals of the stock and a credit event in the worst-case scenario leading to a liquidity and a solvency crisis.
From its ATH in Nov 2024 the stock has already lost 68% of the value. On 17th Sept I wrote in this blog that there is more downside expected in $MSTR/ CRYPTOCAP:BTC with support @ 0.002 CRYPTOCAP:BTC which indicates a price of 160 $ - 170 $ for $MSTR.
Is NASDAQ:MSTR only game in town? Charts seem to disagree. for NASDAQ:MSTR by RabishankarBiswal — TradingView
Currently the stock is @ 170 $. If we plot the Fib levels on the weekly from the bottoms of the FTX blowout in 2023 we clearly see the support and resistance levels for the stock. If NASDAQ:MSTR has 2 weekly close below 170 $ then we might easily visit the 140 $ range which seems to be a previous support level. If it breaks below 140 $ then we can easily see a 100 $ on $MSTR. Another key metrics is the short interest in the stock which is @ 10% of the current float.
Trade Set Up: NASDAQ:MSTR to see more downside before any turnaround. Below 170 $ the stock can go down to 140 $ and eventually finding support @ 100. NASDAQ:MSTR / CRYPTOCAP:BTC may visit 0.0015.

Strategy: Downward Pressure Intensifies Strategy has continued to develop downward pressure as anticipated since our last update, bringing it closer to the targeted low of the turquoise wave 2. Our alternative—and now grayed-out—Target Zone has been breached to the downside, allowing us to remove the alternative scenario of a premature breakout to the upside. Investors who speculated on this alternative and entered within the alternative Target Zone with a stop 1% below the lower edge have likely been stopped out by now. For now, we are still allowing some room for turquoise wave 2 to move lower; however, it should find its bottom above the support at $102.40 to set the stage for wave 3 to advance further above the resistance at $674.18.

MSTR HIGH PROBABILITY BIG BULL MOVE SOON!!!🚨 MSTR HIGH PROBABILITY BUY SETUP 🚨
* Here We Can See Clearly The Next Potential Moves For MSTR Coming Hours/Days.
* Keep Your Eyes Close On Your Trading Positions.
* Happy PIP Hunting Traders.
FXKILLA.

MSTR: Trend ContinuesSince our last update, MSTR extended its sell-off. We still expect the low of this wave to form above the support level at $153.49. Once wave 2 is complete, we anticipate a strong wave 3 rally pushing above resistance at $674.18. Our alternative scenario assumes a different wave count: in this case, price may currently be developing the magenta wave alt. to the upside (probability: 30%). This count would be confirmed by a direct move above resistance at $430.50.

$MSTR Swing Trade Setup: Layered Short Entries on Breakout📉 MSTR "STRATEGY INC" STOCK – Bearish Thief Plan (Swing/Scalp Setup)
⚡ Trade Setup (Bearish Pending Order Plan)
Asset: NASDAQ:MSTR (MicroStrategy Inc.)
Plan: Bearish (waiting for support breakout confirmation).
Entry Zone:
Pending breakout entry @ 320.00 ⚡
Layered “Thief” Strategy (scaling entries):
Sell Limit Layers: 340.00 / 330.00 / 320.00
You may add or adjust layers based on your own risk tolerance.
🔔 Set TradingView alerts at breakout levels to track price action.
Stop Loss (Thief Style):
Protective SL @ 360.00 (after breakout confirmation).
Adjust per your strategy & risk management.
Target Zone (Exit):
Police barricade support @ 290.00
Note: Take profit is discretionary — escape with profits at your own chosen level 🚪💰.
🔑 Why This Plan? (Thief Strategy Context)
The Thief Plan = using multiple layered limit entries after a breakout for better risk/reward.
Scaling entries gives flexibility while reducing FOMO and chasing.
Exit early at support barricades or oversold traps.
📊 MicroStrategy (MSTR) Market Data Report
As of September 7, 2025
1. Retail & Institutional Sentiment 🤝
Retail: Mixed / cautious (crypto exposure volatility).
Institutional: Neutral → slightly bearish (Bitcoin correlation + regulatory risk).
Estimated Sentiment: 55% Neutral / 30% Bearish / 15% Bullish.
2. Fear & Greed Index 😨😋
Current level: Neutral ~50/100
Suggests balanced emotions → no extreme greed or fear.
3. Fundamental & Macro Scores 📈📉
Fundamental ~60/100: MSTR tied to Bitcoin trends, highly volatile.
Macro ~55/100: Pressures include crypto regulation, tech volatility, interest rates.
Bitcoin remains the key driver.
4. Market Outlook 🐂🐻
Bull Case: BTC rally → MSTR boost, institutional adoption helps.
Bear Case: Regulatory clampdowns, BTC volatility → downside pressure.
Overall: Neutral → Slightly Bearish (short-term caution).
🚀 Key Takeaways
NASDAQ:MSTR moves in sync with Bitcoin → monitor BTC charts closely.
Sentiment is not strongly bullish → short setups have edge here.
Thief layering strategy aligns with volatility.
Always respect SL & manage risk 🔐.
🔗 Related Pairs to Watch
BITSTAMP:BTCUSD
NASDAQ:COIN (Coinbase)
NASDAQ:RIOT (Riot Platforms)
NASDAQ:MARA (Marathon Digital)
SP:SPX / NASDAQ:NDX (macro impact on tech/crypto plays)
✨ “If you find value in my analysis, a 👍 and 🚀 boost is much appreciated — it helps me share more setups with the community!”
#MSTR #MicroStrategy #Stocks #SwingTrade #Scalping #BearishSetup #CryptoStocks #LayeredStrategy #ThiefPlan #BitcoinCorrelation #TradingViewIdea

MSTR HIGH PROBABILITY SETUP SOON!!!🚨 MSTR HIGH PROBABILITY BUY SETUP 🚨
* Here We Can See Clearly The Next Potential Move For MSTR Coming Hours/Days.
* Keep Your Eyes Close On Your Trading Positions.
* Happy PIP Hunting Traders.
FXKILLA.
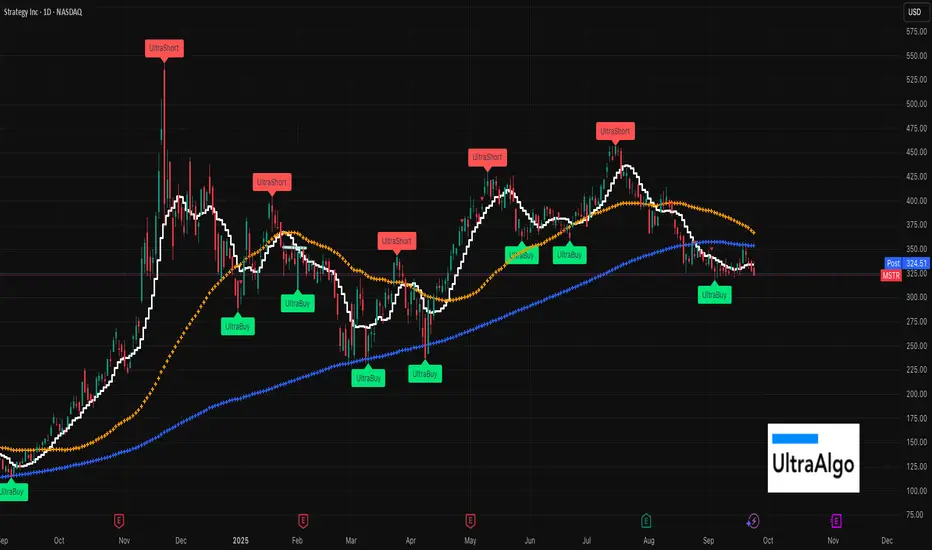
MSTR is still in a downward channelWhile it looks promising that MSTR is making some small gains, it's still in a very real downward channel. These type of gains are typically very short lived as many in this space are short term / profit takers. Technicals and soon UltraShort signals are confirm this, but would not bet the fam on any of this f&ckery!
MSTR....set-up not looking goodNASDAQ:MSTR is below 9, 50, 200SMA! That's about the clearest red flag you can see. There could be some volatility, but would be very careful as it crosses down 330, 300 and then possibly the next support line is further down as people dump hard. CBOE:MSTZ is a nice inverse play here! Best of luck
$MSTR Micro Strategy 🎯 Technical Setup:
Daily demand zone at ~$302-320 providing STRONG support
Break of structure (BOS) confirmed with rejection from demand
Perfect 1-2 Elliott Wave setup developing after correction
Target: 50% retracement minimum = $365+ (15%+ gain from current levels)
🚀 MicroStrategy BITCOIN BEAST:
Bitcoin Treasury King: 444,262 BTC worth $49+ billion in reserves
Saylor's Vision: World's largest corporate Bitcoin holder
Infinite Money Glitch: Issue convertible debt → Buy Bitcoin → Stock rises → Repeat
2.5x Bitcoin Leverage: MSTR moves 2.5x whatever Bitcoin does
💰 The Ultimate Bitcoin Play:
Pure Bitcoin Exposure: No mining costs, just pure BTC appreciation
Corporate Treasury Revolution: Leading the Bitcoin-as-reserve-asset movement
Institutional Gateway: Wall Street's favorite way to get Bitcoin exposure
Convertible Debt Machine: $42 billion raised to buy more Bitcoin
🎪 Why This Could Be EXPLOSIVE:
Demand Zone Bounce: $302-320 institutional accumulation zone holding
Bitcoin Catalyst: Any BTC move above $115K triggers MSTR mania
Wave 3 Setup: Most powerful Elliott Wave about to begin
Saylor Effect: Michael Saylor's Bitcoin evangelism driving adoption
Entry Strategy:
Current: $326 (bouncing perfectly off daily demand)
Confirmation: Above $340 with volume surge
Stop: Below $300 (demand zone violation)
Target 1: $365 (50% Fibonacci level)
Target 2: $450+ (if Bitcoin breaks $120K)
MSTR = Bitcoin on steroids at perfect technical entry! 🚀
BTCUSDT.P 1D Time frameMarket Overview
Current Price: ~$112,380
Daily Change: Slight dip (around –0.3%)
Volatility: At multi-month lows, meaning the market is consolidating before a possible breakout.
📈 Key Levels
Immediate Resistance: $112,800 → price needs to clear this for upside continuation.
Next Resistance Zones: $114,000 → $116,000, and further up around $128,000.
Immediate Support: $111,000 → first cushion below current price.
Deeper Support: $110,000, then $107,800–108,000.
🔎 Technical Indicators
RSI (14-day): ~43 → Neutral, showing neither overbought nor oversold conditions.
MACD: Bullish crossover → suggests upward momentum is building.
Stochastic Oscillator: Near oversold → possible short-term bounce.
🧭 Outlook
Bullish Case: A sustained breakout above $114,000 could open a rally toward $128,000.
Sideways Case: Holding between $111,000 and $113,000 keeps Bitcoin in consolidation.
Bearish Case: A break below $110,000 could trigger a move toward $108,000 or even $102,000.
Overall Bias: Moderately bullish, but the market is in a tight range and waiting for a breakout.

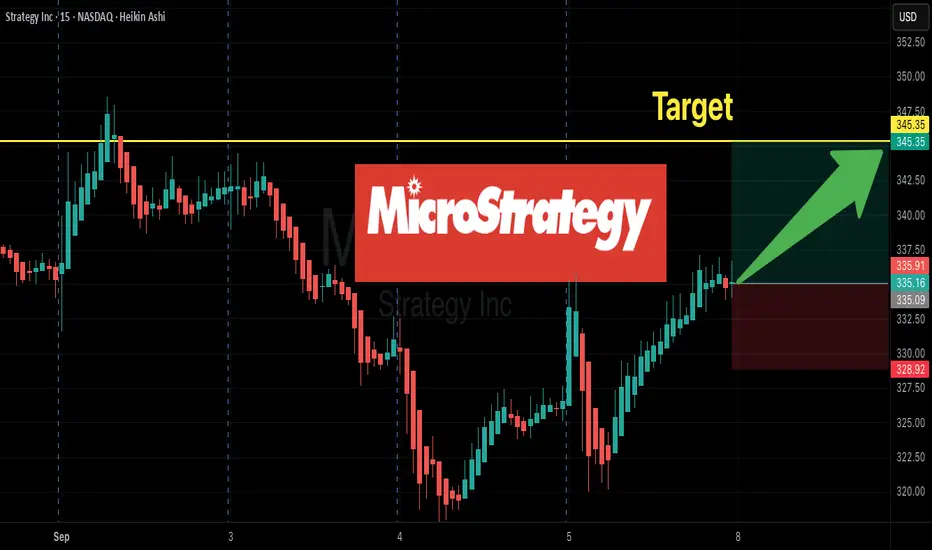
MSTR Options Flow Screams Bullish — Can $345C Print This Week?
# ⚡ MSTR Weekly Trade Setup (2025-09-07)
**Bias:** 🎯 Mixed → speculative bullish bounce
**Conviction:** ⭐⭐⭐ (60%)
---
### 📊 Key Takeaways
* ✅ **Options flow:** Strongly bullish (C/P = 2.21)
* ❌ **Trend:** Still bearish (-16.45% monthly, RSI weak)
* ⚠️ **Volume:** Flat (1.0x avg) → no institutional conviction
* 🌐 **Volatility:** Low (VIX \~15) → cheap calls
* 🧱 **OI Walls:** \$340C & \$345C = resistance / gamma levels
---
### 🎯 Trade Plan (Speculative Play)
* **Instrument:** \ NASDAQ:MSTR
* **Direction:** CALL (naked)
* **Strike:** \$345.00
* **Expiry:** 2025-09-12 (weekly)
* **Entry Price:** \$8.60 (ask)
* **Profit Target:** \$12.90 (≈1.5×)
* **Stop Loss:** \$5.59 (\~35% risk)
* **Size:** 1 contract (small, punt-sized)
* **Entry Timing:** Open (prefer limit near ask)
---
### 🧠 Rationale
* Flow is unambiguously bullish, but **price trend & RSI weak** → treat as a bounce, not reversal.
* \$345C offers liquidity (OI 14,439) + better risk balance than \$340C.
* 5 DTE = **theta risk**, so trade is **binary/speculative**.
---
### ⚠️ Key Risks
* 📉 Trend is down → bounce may fail quickly.
* ⏳ Time decay fast with only 5 DTE.
* 🧱 Gamma/OI walls may cap upside near \$345.
* 📰 Macro/news can swamp bullish flow.
---
## 📌 TRADE DETAILS (JSON)
```json
{
"instrument": "MSTR",
"direction": "call",
"strike": 345.0,
"expiry": "2025-09-12",
"confidence": 0.60,
"profit_target": 12.90,
"stop_loss": 5.59,
"size": 1,
"entry_price": 8.60,
"entry_timing": "open",
"signal_publish_time": "2025-09-07 07:45:34 EDT"
}
```
---
🔥 **Summary:**
This is a **flow-driven speculative call punt** — risk small, size small, exit fast.
If flow + price action confirm, \ NASDAQ:MSTR \$345C has upside.
If not → cut quick.
Microstrategy: Further DeclineAfter a brief consolidation, MSTR continued its decline since our last update, further developing turquoise wave 2, where we still see price positioned. We continue to anticipate the low of this wave above the support at $153.49. In the meantime, we have revised the magenta substructure of wave 2 to a - - formation, with the final (wave- ) leg currently unfolding. Once turquoise wave 2 completes, we expect a strong rally above resistance at $674.18, which should significantly advance the broader upward impulse. However, under our new alternative scenario, a different wave count could prevail: price may currently be forming magenta wave alt. to the upside, developing a blue three-part substructure in the process. In this 25% likely scenario, the next move would be for blue wave alt. (b) to finish within the nearby blue alternative Target Zone between $306.60 and $252.67, before wave alt. (c) pushes up toward the top of magenta wave alt. near $674.18. Within this alternative, the blue zone could offer long entry opportunities, though heightened caution is warranted: since this remains only an alternative scenario, risk is elevated, and we consider strict risk management—such as setting a stop 1% below the lower edge of the zone—absolutely essential.

MSTR Short Alert | Lean Short Bias at $335
# ⚡ MSTR Short Alert | Lean Short Bias (Sep 2, 2025) 🪙📉
📊 **Market Summary:**
* Daily/Intraday: Bearish (Price < daily EMAs, RSI \~35, MACD negative) 🔻
* Weekly: Weakening but not decisively broken (near/above 50-week EMA) 📈
* Volume: Light — low participation on recent declines ⚖️
* Headlines: Neutral; watch BTC correlation & macro events 📰
**Net Bias:** Lean short on daily timeframe; small position recommended 🐻
---
## ✅ Trade Plan
* 🎯 **Instrument:** MSTR
* 🔀 **Direction:** SHORT
* 💵 **Entry Price:** \~335.0 (acceptable 333–336)
* 🛑 **Stop Loss:** 341.13 (daily resistance / pivot)
* 🎯 **Take Profit:** 320.00 (scale 60%), trail remaining 40% to 310.00
* 📊 **Position Size:** 1.5% of portfolio
* 📈 **Confidence:** 60%
* ⏰ **Entry Timing:** Market Open
---
## ⚠️ Key Risks
* Low volume → false break / short-squeeze risk ⚡
* MSTR-BTC correlation or S\&P rumors could gap price higher 🪙
* Weekly support \~322–325 may limit downside 🛑
---
## 💡 Trade Rationale
* Daily + 30m confluence: short-term bounce attempts stalling under intraday resistances (336–339)
* Weekly momentum weakening → controlled small-size short
* Stop above 341.13 → disciplined risk management
---
\#️⃣ **Tags / Hashtags:**
\#MSTR #ShortTrade #StockTrading #SwingTrade #CryptoCorrelation #DailyRSI #TradingSignal #RiskManagement 🐻🔥

Bearish MSTR is temporary; Rise to more than 412$ in the future.As it's obvious, MSTR has broken it's bullish trendline and a great pullback has happened. I believe after breaking a support at 293$, It will head toward 239$ then will rise and break the bearish trendline. After surpassing the 293$ resistance, It will catch 412$. Also it's evident that buying crypto by Michael Saylor can improve the stock price.
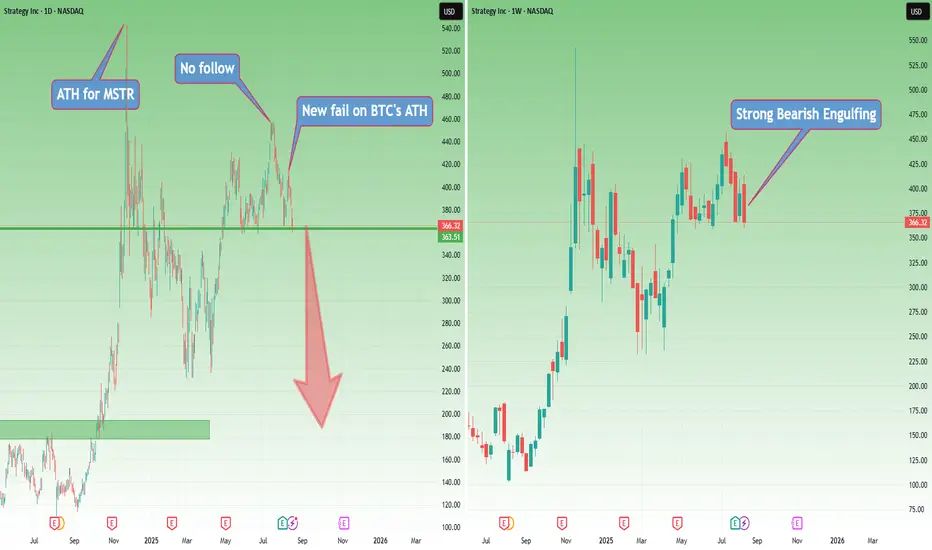
MSTR: A Giant with Feet of ClayExactly two weeks ago, I wrote an article with a rhetorical question: “Why should you buy Strategy if you want exposure to BTC?” and argued that MSTR could fall—and fall hard.
Two days ago, BTC printed a new ATH. That move was visible in MSTR as well; however, we’ve got a lower high and a new fail for the stock.
Even more, this fail has formed the right shoulder of an H&S pattern.
On the weekly chart, there’s a strong bearish engulfing that ended exactly at the neckline of the pattern.
This type of price action is far from bullish, regardless of what one may want to dream of.
BTC is above confluence support. If it breaks this level, Strategy will fall even harder.
In my last post, out of 12 comments, 5 were hate comments—because “how can I say such enormities, that Strategy could fall.”
The answer is simple: the chart doesn’t look good at all.
Even if BTC reverses from this support, in my opinion the reflection in MSTR will be minimal.
And anyway, I trade what I see, not what Saylor sells me.
That being said, a drop of BTC under confluence support will most probably lead to a break below the neckline for Strategy. And if BTC delivers a meaningful correction, Strategy will fall like a giant with feet of clay that it is.
Why Pay $250K for a $115K Bitcoin? Welcome to Strategy (MSTR)This is already the third article I’ve written about Strategy (formerly MicroStrategy), and for good reason.
You don’t need to be a financial expert to ask: why buy a stock that simply mirrors Bitcoin’s price — but at a massive premium?
No matter how sophisticated the explanations may sound, or how many times you’re told that “if you don’t understand it, it must be brilliant,” the reality is much simpler — and much more absurd.
Buying Strategy today is like paying $250,000 for Bitcoin while the actual market price is $115,000.
It’s not about complexity. It’s about common sense.
I won’t dive too deep into it — no need to fight “financial sophistication” with even more sophisticated words.
The point is simple: buying Strategy is like paying me $10,000 just so I can hold your $10,000 and call it an “innovative capital deployment strategy.”
Sounds smart, right? Until you think about it for more than five seconds.
Now let’s look at the posted charts — simple and visual.
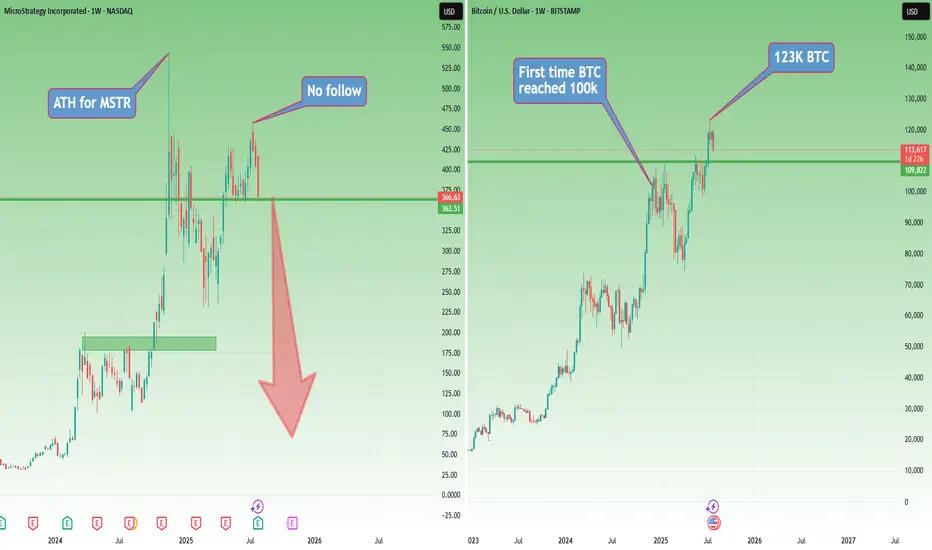
Strategy (MSTR) hit its all-time high in November 2024, right when Bitcoin first reached $100,000.
Then came a sharp correction of more than 50% for the stock.
Fast forward: even though Bitcoin went on to make new all-time highs, Strategy didn’t follow, it seems like people were finally starting to wake up.
When BTC peaked again in mid-July 2025, Strategy only managed to reach $455 — well below its November ATH.
Since then, BTC has pulled back about 10%, while Strategy dropped around 20%.
So much for the “outperformance” argument.
And here’s where things get even harder to justify:
In the past, some institutions bought MicroStrategy because they couldn’t hold Bitcoin directly. Fair enough.
But now? Spot Bitcoin ETFs are live, regulated, widely available, and charge tiny fees — without the leverage, dilution risk, or premium baked into Strategy.
So what’s the excuse now?
Where are we now?
At this moment, even though I’m not too happy about this week’s Bitcoin weakness, I remain cautiously bullish — emphasis on cautiously.
But let’s entertain a scenario.
If Bitcoin continues to correct, Strategy is sitting right on support. And if BTC breaks lower, Strategy will almost certainly follow — breaking support and heading toward the next level.
That next support? Somewhere around $240–250, depending on how deep the Bitcoin pullback goes.
But here’s the real question:
What happens if Bitcoin enters a true bear market?
Will Strategy — which just recently rebranded from MicroStrategy — be forced to rebrand again as…
NanoStrategy?
Just a Saturday thought.
MSTR WEEKLY OPTIONS SETUP (2025-07-28)
### 🔻 MSTR WEEKLY OPTIONS SETUP (2025-07-28)
**Bearish Divergence with High Confidence — Time to Strike with a PUT?**
---
📊 **Momentum Recap:**
* **RSI:** Bearish 📉
* **Volume:** Weak (institutional exit risk)
* **Options Flow:** Mixed (calls > puts, but no alignment with price)
* **Sentiment Models:** Split 4:1 → **Only Claude/Anthropic** goes bearish with conviction
🧠 **Model Consensus:**
> “Momentum is weak, volume fading, and no upside confirmation = bearish edge.”
---
### ✅ SETUP OVERVIEW
* 🔍 **Trend:** Bearish (declining RSI)
* 📉 **Volume:** Weak = reduced institutional conviction
* 💬 **Options Flow:** Bullish bias, but **contradicts price trend**
* ⚙️ **Volatility:** Elevated, potential reward for directional plays
**Overall Bias:** 🔴 *Moderately Bearish*
---
### 💥 TRADE IDEA: MSTR \$400P
* 🎯 **Strategy:** Long Weekly Put
* 🔻 **Strike:** 400.00
* 📆 **Expiry:** Aug 1, 2025
* 💸 **Entry Price:** \$8.65
* ✅ **Profit Target:** \$12.50
* 🛑 **Stop Loss:** \$4.00
* 📈 **Confidence Level:** 72% (backed by Claude model)
* 📉 **Breakdown Trigger:** Below \$405 confirms bearish flow
* ⚠️ **Invalidation:** Break above \$415 → exit early
---
### 📦 TRADE\_DETAILS (Backtest/Algo Ready JSON)
```json
{
"instrument": "MSTR",
"direction": "put",
"strike": 400.0,
"expiry": "2025-08-01",
"confidence": 0.72,
"profit_target": 12.50,
"stop_loss": 4.00,
"size": 1,
"entry_price": 8.65,
"entry_timing": "open",
"signal_publish_time": "2025-07-31 09:30:00 UTC-04:00"
}
```
---
### 🧠 TRADE INSIGHTS
* 🟥 4/5 models say **no trade** due to signal divergence
* 🧠 **Claude’s bearish thesis = cleanest directional setup**
* 🚨 Volume + RSI combo = downside confirmation
* 🧭 Watch key price reaction zones: **\$400–\$405 (support)** / **\$415 (resistance cap)**
---
**#MSTR #PutOptions #WeeklyTrade #BearishSetup #OptionsFlow #QuantTrading #ClaudeModel #MarketMomentum**
