MSTR - Wave 4? - Next stop 197-202 then reload for 220-235!THESIS
The recent price action confirms a bullish Elliott Wave impulse move from the $155.61 low. The market has validated an Extended Wave 3 by successfully holding the maximum 61.8% retracement level during the deep Wave 4 pullback (low of $177.82).
We are now in the final thrust of Minor Wave 5, we should then see a 3 wave pullback which sets up the full corrective rally to our higher-degree target of $220-$235!
Analysis & Targets (Aligned to the Chart)
1. 🎯 Wave (A) Completion: The Final Minor Impulse
The current action is the final push of Minor Wave 5 (the fifth wave of the initial impulse from the $177.82 low).
• Entry Signal: The bounce from the $177.82 low confirmed the Wave 4 bottom.
• Target Zone (A): The technical projection for Wave 5 (using W5 = W1 or 0.618 \times W1-3) places the peak between $196 - $202
• Action: This is the initial profit-taking zone. Look to sell calls here, as this completes the first major structural move.
2. 🌊 Wave (B) Correction: The High-Grade Reload
Once the Wave (A) target is hit, a larger corrective pullback (Wave (2) in the larger context) is mandatory before the final surge. Since the preceding Wave 4 was sharp/deep, this Wave (B) correction is likely to be shallow/sideways (a Flat or Triangle) to adhere to the Principle of Alternation.
• Target Zone (B): We project a 38.2-50-61.8% retracement of the entire impulse. This places the reloading zone between $182 - $172 (The green box on the chart).
• Action: This is the Optimal Reloading Zone for long positions before the final rally.
3. 🚀 Wave (C) Final Target: The Greater Rally Peak
The final Wave (C) completes the overarching corrective rally. This leg is targeting a significant Fibonacci retracement of the prior, large bear wave.
• Target Zone (C): The $220 - $235 box is perfectly aligned with the high-probability 38.2% of the massive Wave 3 down that preceded this entire rally.
• Action: This is the final take-profit target for the entire trade structure.
Key Levels to Watch
• Buy Target (Sell Limit): $197 (Exit Minor W5).
• Reload Zone: $182- $172 - (Buy the Wave B dip).
• Invalidation Price: $170 (A close below this invalidates the entire impulse).
Good luck with the final wave! Remember to manage risk and set a stop loss! I am a guy on the internet and not a financial advisor!
#ElliottWave #MSTR #Bitcoin #Bullish #TechnicalAnalysis
MSTX

Full Reset before Full SendWhy March 2025 Could See New Highs
What's Happening Right Now?
Everyone is freaking out right now, but this is actually creating one of the best buying opportunities we've seen. Bitcoin is trading around $95,600 after dropping about 24% from its peak of $126,000 in October.
The Fear & Greed Index is at 10 (Extreme Fear) – and you know what they say? Be greedy when others are fearful. But, also, be patient and set limits.
The thing is, most people don't understand the economics behind Bitcoin or how liquidity actually works in crypto markets. We're playing a completely different game than stocks here.
The Real Cost to Mine Bitcoin (And Why It Matters)
Here's where it gets interesting. The big mining operations are producing Bitcoin for around $26,000-$28,000 per coin, while less efficient miners saw costs spike to $114,842 in October 2025... That's a massive range, and it tells you everything about where the floor is.
After the April 2024 halving, it now takes 854,400 kilowatt-hours to mine just one Bitcoin – that's about 81 years of electricity for an average home, just for one coin. That's a fun fact.
No smart miner is going to sell at a loss when they're paying that much for electricity and equipment (GPUs, etc). They'll just hold and wait. This creates natural supply constraints.
The Liquidity Trap
Right now, the market is in what I call a liquidity trap. As Bitcoin crashed from $126K down to where we are now, all the leveraged traders got wiped out. We saw $870 million in Bitcoin ETF outflows in a single day – that's both panic selling and intelligent, planned shorting, not fundamental weakness.
Here's what most people are missing: if Bitcoin drops to around $75K, it's going to unlock massive amounts of liquidity – I'm talking hundreds of millions, possibly billions of dollars that's currently locked up in long positions (Futures).
When those long get liquidated, the shorts will likely reverse their positions, that money floods back into the market and creates a supply shock. Basic economics: limited supply + sudden demand increase = price explosion.
Price Targets & When to Buy
I think we'll see $89K very soon – possibly this week between Monday and Wednesday (November 17-19, 2025). But here's my recommended strategy instead of trying to catch the exact bottom:
First Buy: $89K
Put in about 30% of what you're planning to invest. This is still a good entry even though it's not the absolute bottom.
Second Buy: $80K
Another 35% here. This is where things get really interesting from a risk/reward perspective.
Third Buy: $75K
The final 35%. This is the sweet spot where all that trapped liquidity gets released. Remember, demand increases as the price drops, and miners won't sell below cost. That's your supply shock waiting to happen.
What About MicroStrategy?
MSTR has crashed about 40% and is now trading at only 1.06 times its Bitcoin holdings, down from 2.7 times. The stock is around $200-$237 now, way down from its November 2024 high of $543.
My prediction: MSTR will probably hit the $140-$150 range, maybe even drop to $100-$120 (which is where it found strong support from March to September 2024). If we do see those lower prices, I'm going all-in on
MSTX
shares, not
MSTR
– the 2x leverage structure is better.
The Macro Picture
Fed rate cut expectations dropped from 90% to about 40%, which is why everything's selling off. But this is temporary sentiment, not permanent damage. The infrastructure is still being built, institutions are still coming in, and the fundamentals haven't changed.
Bottom Line
Be patient. Wait for the dips. Bitcoin will likely hit $89K this week, and from there we could see further drops to $80K and $75K. Each level is a buying opportunity. By March 2025, I expect we'll be making new all-time highs.
The key is understanding that crypto operates on different rules than stocks. Liquidity and supply dynamics matter more than anything else right now.
Good luck,
Terrapins

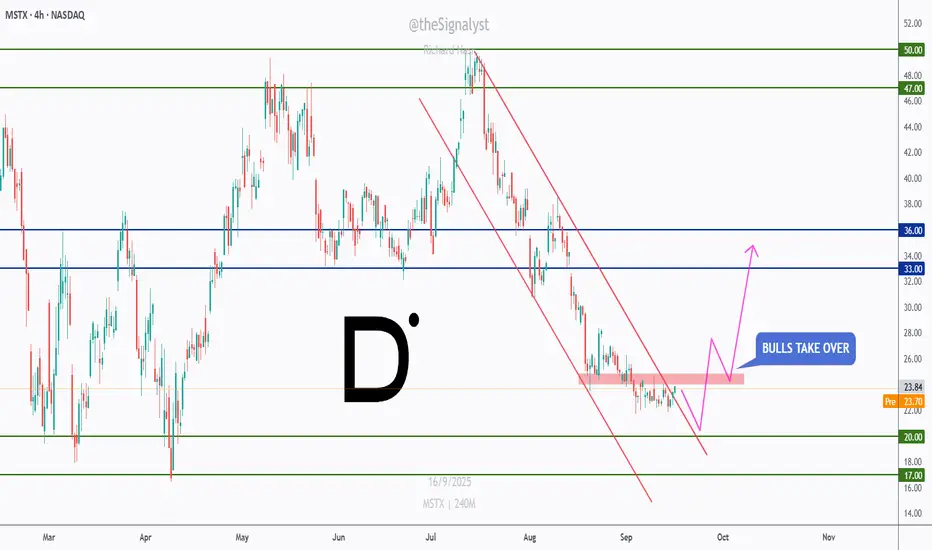
MSTX – Bulls Preparing a Reversal Move!MSTX has been overall bearish 📉, trading inside a well-defined descending channel.
Recently, price approached the $23 – $24 support area, where buyers started showing signs of activity. This zone could act as a potential turning point if momentum continues.
🟢 Support at $23 – $24: A critical level where bulls may step in.
📈 Upside targets: If buyers take over, the first resistance sits around $33, followed by $36 and higher toward $47 – $50.
As long as $23 support holds, bulls 🐂 could drive a short-term reversal that turns into a bigger recovery move.
Patience ⏳ is key — waiting for confirmation before entering can provide a higher-probability setup.
⚠️ Disclaimer: This is not financial advice. Always do your own research and manage risk properly.
📚 Stick to your trading plan regarding entries, risk, and management.
Good luck!
All Strategies Are Good; If Managed Properly!
~Richard Nasr
a megaphone over 500A good signal right on time was Powell saying he would change his monetary policy (he said he would adjust it). Then Bitcoin and all the equities hurt by the recent drops resumed the solid uptrend we’ve been seeing. They came back to consolidate technical levels and give us new highs. In the case of MSTR, we can see the formation of a megaphone pattern that could take us above 500 USD.

MSTX: The Coiled SpringFollowing MSTX's descent to $60, technical indicators are painting a picture that screams opportunity.
Daily Chart:
Weekly Chart:
The CM_Ult_MaCD has bottomed out completely, and if you've traded long enough, you know what that means - upward momentum is coming, and it's coming fast.
The setup is textbook perfect. We're seeing the Stochastic oscillator flirting with oversold territory, and anyone who's been in this game knows that's when you want to position yourself. It's not just about timing - it's about recognizing the patterns that repeat themselves.
What's really getting my attention is the SQZMOM_LB indicator. Those VIX spikes we're seeing aren't random noise - they're telling us a squeeze is brewing. When this pressure cooker blows, we could see rapid upside movement that'll catch the shorts off guard.
Speaking of shorts, they've shown their hand at the $60 VWAP level. Both daily and weekly charts confirm this sweet spot, and I'm seeing all the signs of a short sweep setting up. This is exactly the kind of technical confluence that precedes significant moves.
I'm anticipating MSTX to first reclaim the $100 level, with potential to test previous highs around $175-200. The short squeeze, when it triggers, could accelerate this movement significantly. Smart money will be watching these levels closely.
The key here is patience.
Let the technicals confirm what we're seeing. When that squeeze triggers - and it will - you'll want to be positioned ahead of the crowd.
Stay tuned for updates as this play develops.

MSTX on the eve of a pivotal Merger CC: CHART ANALYSYSMSTX (Mast therapeutics) shareholders have been overdue for some good news after the SEP data disaster wiped out nearly 80% of stock value dropping it from the .60s to a range of .10-15.
VAPOLAXOMER* was a novel technology designed by MSTX to help ease sufferers of sickle cell anemia that ultimately was proven ineffective and was abandoned.
Left with only AIR001, an inhaled sodium nitrite solution to treat heart failure with preserved ejection fraction (HFpEF) currently in Phase 2 development, MSTX had essentially become a shell with no substantial news until Q1'18.
Now MAST and SAVARA (a private company) have signed a DEFINITIVE MERGER AGREEMENT in effort to form a company focused on the development of novel inhalation therapies.
This reverse merger is essentially serving as an IPO for SAVARA and is likely to cause a nice pop in MSTX pps and a small P&D type move that could easily see pps of .33-57ish, potential gain % in the 200 which makes me a short term LONG but ultimately neutral.
Mast and Savara will hold the conference call TODAY Monday, January 9, 2017, at 8:30 a.m. EST / 5:30 a.m. PST to discuss the transaction. To access the conference call dial (855) 239-3120 from the U.S, (855) 669-9657 from Canada, and (412) 542-4127 from outside the U.S. and request the "Mast-Savara Conference Call". A live webcast of the conference call will be available from the Investors section of Mast's website at www.masttherapeutics.com
SIMPLE CHART ANALYSIS
SUP: backsliding is not likely to happen but if so look for a entry op @.0925-975
REALISTICALLY .095 should be the bounce point
RES: look for selling in the following zones WEAK @.107-12, MID @.13-15, STRONG @.17-26
REALISTICALLY .24 is the RES to look for
Notable RES:
W MBB @.1836/EMA50 @.2634
D EMAs .1175/17/25
-woof

MSTX: A Case in Psycological and Financial Pain ToleranceTechnicals imply a sweetheart deal for MSTX bulls to GET OUT @ 10.3-10.4. This chartist implies to just GET OUT. If only I would take my own advice. Literally, I don't even care about a profit anymore as long as my losses are minimized. Anybody else trapped in the 1408-style MASTX? My opinion based on previous trading sessions is B-b-b-bearish, while a hope and a prayer could lead it to formulate this harmonic pattern.

Why MSTX may not rise until at least 10/3With Section 8 Rules, I don't expect the shares to fall much lower than they already have. But, with Fib Time Trend, it looks like shares may not rise until at least Oct 3, maybe early next week? But with the possibility of being removed if shares fall to 6, I can't imagine them falling much more than another penny or so to around 9 before taking off. What say ye?

MSTX GOING FOR ONE MORE WAVE UP?MSTX has broken the daily downtrend with a strong impulse. If it consolidates above the trendline i'm expecting one more wave up. A strong breakdown on this trendline can invalidate the setup.

