Identifying High-Probability Support: The Power of ConvergenceHello Friends,
Welcome to RK_Chaarts
Today we're going to learn Comprehensive Guide to Identifying Convergent Support Zones
Which are High Probability Support areas. This post is for Educational purpose only.
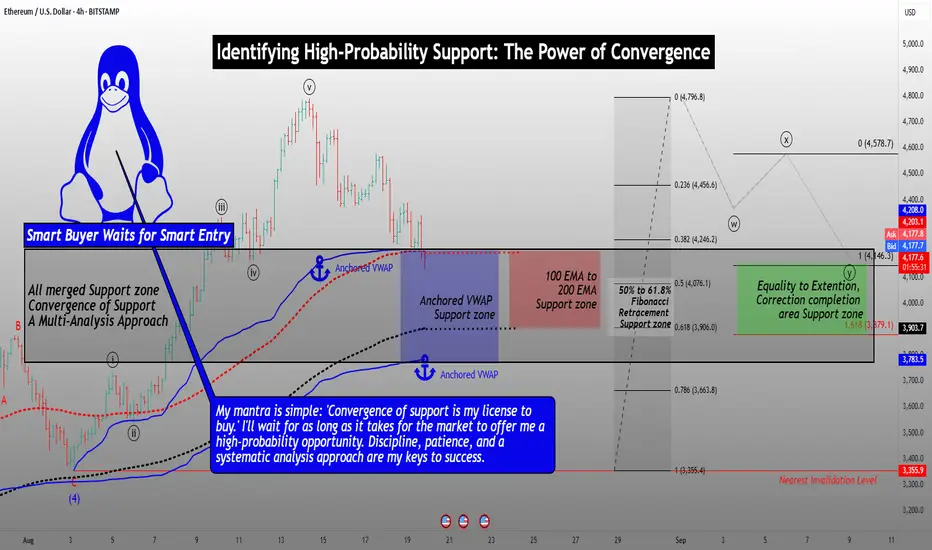
This detailed analysis will walk you through a step-by-step process of combining multiple technical analysis methods to identify a robust support zone. We'll explore how Elliott Wave theory, Anchored VWAP, EMA200, Fibonacci Retracements, and equality to extensions can coincidentally converge on the same support zone.
Step 1: Elliott Wave Analysis
Begin by identifying the Elliott Wave structure. Look for impulse waves, corrective waves, and the relationships between them. In this example:
- Wave Y is potentially completing near the equality zone (100% to 161.8% extension).
- This level marks a potential reversal point.
Support zone as per Elliott Wave theory Analysis
Step 2: Anchored VWAP Analysis
Apply Anchored VWAP to identify key support levels:
- Plot the VWAP from the last swing low and the second-last swing low.
- Note the convergence of these VWAP levels, which can indicate strong support.
Support zone as per Anchored VWAP Analysis
Step 3: EMA200 Analysis
Add the 200-period Exponential Moving Average (EMA) to your chart:
- The EMA200 has consistently provided support during previous corrections.
- Note the price approaching this level, increasing the likelihood of a bounce.
Support zone as per 200 Exponantial Moving Average
Step 4: Fibonacci Retracement Analysis
Apply Fibonacci retracements to the previous rally:
- Identify the 50%, 61.8%, and 78.6% retracement levels.
- Note the current fall has already exceeded the 38% retracement.
Support zone as per Fibonacci Retracement Analysis
Step 5: Convergence of Support Zones
Combine the analysis from each step:
- Note the striking convergence of support zones:
- Elliott Wave equality zone (100% to 161.8% extension)
- Anchored VWAP support zone
- EMA200 support level
- Fibonacci retracement zone (50%-61.8%)
Coincidentally all these are providing nearly same Support area (Price zone)
Trading Implications
With the convergence of these multiple analysis methods, you can:
- Identify a high-probability support zone.
- Look for buying opportunities near this zone.
- Monitor price action and market sentiment for confirmation of a reversal.
- Consider scaling into positions or setting limit orders within the support zone.
Important Note: Failure to Hold Support
If the price fails to hold support at this converged zone, it may indicate a stronger bearish trend. In this scenario:
- Be prepared for a potential significant downfall.
- Consider adjusting your trading plan to account for the increased bearish momentum.
- Keep a close eye on price action and market sentiment for further guidance.
By understanding the convergence of these multiple analysis methods and being aware of the potential risks, you'll be better equipped to make informed trading decisions and navigate the markets with confidence.
I am not Sebi registered analyst.
My studies are for educational purpose only.
Please Consult your financial advisor before trading or investing.
I am not responsible for any kinds of your profits and your losses.
Most investors treat trading as a hobby because they have a full-time job doing something else.
However, If you treat trading like a business, it will pay you like a business.
If you treat like a hobby, hobbies don't pay, they cost you...!
Hope this post is helpful to community
Thanks
RK💕
Disclaimer and Risk Warning.
The analysis and discussion provided on in.tradingview.com is intended for educational purposes only and should not be relied upon for trading decisions. RK_Chaarts is not an investment adviser and the information provided here should not be taken as professional investment advice. Before buying or selling any investments, securities, or precious metals, it is recommended that you conduct your own due diligence. RK_Chaarts does not share in your profits and will not take responsibility for any losses you may incur. So Please Consult your financial advisor before trading or investing.
Multianalysis
Analyzed BTC, ETH, BCH, HBAR, EOS, LTC, XRP and DOGE | Enjoy ;)NSENG:ACADEMY
Hello everyone 😃
We tried to analyze some of the trending coins for you dears to use it on your trading plans !
Hope you all enjoy it 😉
I will start with BTC -> ETH -> BCH -> HBAR -> EOS -> LTC -> XRP -> DOGE.
BTC/USDT :
BTC is currently at no trade zone, There are many pressure zones and we can't select a correct direction for it.
But based on our data; BTC is generally bullish on 12H timeframe, So the most possible direction will be another reach on 59K after a retest on lower trendline.
🔴 Any engulf below 52K will makes BTC more bearish !
ETH/USDT :
ETH is at resistance zone which is located at FIBBO level. Any close above this level will confirm $4700.
But on low TF, ETH remains bearish until it breaks $4255 level !
So Be careful of your funds on ETH, Also there was a formed H&S which is invalidated now.
BCH/USDT :
BCH is at the verge of bullish cross, But there is a stiff resistance above which can rejects BCH if others ( other major coins ) don't go up in next hours...
Also there is a chance for fake-out on it ! So better to watch ETH's current resistance and BTC's closes above current order block.
I really like to have a retest on lower levels for BCH; $1800 is confirmed already for BCH...
📌 You can set your bids at green mentioned zones !
HBAR/USDT :
Personally, I'm seeing HBAR as a greater technology for crypto; So that's why it's in my watchlist !
Anyway, HBAR retests demand zone and now it's trying to climb for bearish order block.
Also It remains bearish on technical indicators for short-term, So another retest on bullish trendline is very expected.
EOS/USDT :
I'm not very sure about EOS, It's remains bullish without any excuse !
Current level is suggested as a stiff resistance zone; Sadly I expected that EOS will show more low wicks...
But it didn't went on my plan. Now I'm waiting for a rejection from this level or a breakout above this level !
Both of them are considered as a great opportunity for scalpers and swing traders...
LTC/USDT :
LTC is lovely here, I'm just searching for any retest on lower levels; Which is really expected for next days...
I'm still believe in my final target around $700 in next 4 weeks ! So I will set my beads at lower demand levels.
XRP/USDT :
There are two possible directions for XRP, It's seems that XRP is moving into a falling wedge, So it's generally very bullish...
Any close above wedge's higher will confirm XRP's $2 in mid-term and higher levels for long-term.
Otherwise we'll see a lower retest to $1 bullish order block zone. After that I will aiming $2 again !
DOGE/USDT :
DOGE is no more staying in a bullish scenario for now. It rejects 50% and 68% retracement on FIBBO's bullish wave, And now it's moving around 70% on FIBBO's bullish wave.
But on bearish wave, It seems that DOGE has retested FIBBO's 50% level and now it's standing below 38.2%.
So any rejection below $0.4 stiff support zone can make this opportunity for bears to push it around $0.3 level !
Bulls can take the lead one more time for DOGE if they manage to break current bearish trendline...
Hope you enjoyed our multiple analysis about 7 crypto currencies in my watchlist🙌
You can support us with your likes.
Also you can share your opinion with us in comments 😉🙋🏼♂️
Attention: this isn't financial advice we are just trying to help people on their own vision.
Have a good day!
@Helical_Trades
