GBPCAD Triple Top Points To Potential Triple EventOANDA:GBPCAD on a multi-timeframe analysis allows us to breakdown this False Breakout of the Rising Wedge on the Weekly chart, lets check it out!
Price on the Weekly had made a Bearish Breakout of the Rising Wedge but price has had a great Bullish rally all week and undid all the Price Action following the Breakout of the Rising Support.
On the Daily since the Low of the Breakout @ 1.83238, OANDA:GBPCAD has begun to form an Expanding Range with Higher Highs laying out a Rising Resistance.
- MACD is signaling Bullish with lines just crossing 0 and Histogram forming green bars
Everything is saying Bullish but,
On the 4Hr we can see that Price has formed a Triple Top at the Resistance Level formed from the Highs of Dec. 4th around 1.86328 - 1.86675.
- RSI is showing a Divergence of Highs in Price
- Volume is waning as the Highs form
- MACD is signaling Bearish with a Crossover event and Histogram forming red bars
Now if Price falls below 1.85997, this will confirm the Triple Top and will mean we will be looking for Price to fall down to the AOV around 1.8546 - 1.8528.
If Price is able to find support around this level, this would Confirm the Bullish Bias on OANDA:GBPCAD on the Daily and Weekly.
Multitimeframeanalysis

Zooming Out and In: AI-Powered Multi-Timeframe Mastery
You're Bullish on the 5-Minute Chart. You're Bearish on the Daily. Who's Right?
This conflict destroys more traders than bad entries ever will.
Multi-timeframe analysis isn't optional - it's the difference between trading with the current and swimming against it.
AI doesn't have the human limitation of only seeing one chart at a time. Here's how to think like the machine.
The Timeframe Hierarchy
The Principle:
Higher timeframes carry more weight than lower timeframes.
Why:
More data points = more statistical significance
Larger players operate on higher timeframes
Trends on higher timeframes persist longer
Lower timeframe noise gets filtered out
The Hierarchy:
Monthly → Macro Trend
Weekly → Swing Trend
Daily → Position Trend
4H → Swing Trade
1H → Day Trade
15M → Scalp
5M/1M → Noise
The Three-Timeframe Framework
Timeframe 1: Trend (Higher)
Purpose: Determine overall direction
What is the dominant trend?
Where are major support/resistance levels?
What's the big picture context?
Timeframe 2: Signal (Trading)
Purpose: Find entry opportunities
Where are setups forming?
What patterns are developing?
Where should entries be placed?
Timeframe 3: Execution (Lower)
Purpose: Optimize entry timing
Where is the precise entry?
What's the immediate momentum?
Where should the stop go?
Example Combinations:
Position Trading: Monthly → Weekly → Daily
Swing Trading: Weekly → Daily → 4H
Day Trading: Daily → 1H → 15M
Scalping: 4H → 15M → 5M
How AI Processes Multiple Timeframes
Human Limitation:
You can only look at one chart at a time. Switching between timeframes takes time and mental energy.
AI Advantage:
Processes all timeframes simultaneously, identifying:
Alignment (all timeframes agree)
Conflict (timeframes disagree)
Confluence (multiple signals at same price)
AI Multi-Timeframe Logic:
Calculate trend on TF1 (higher)
Calculate trend on TF2 (trading)
Calculate trend on TF3 (lower)
If all aligned: Signal strength = HIGH
If 2 of 3 aligned: Signal strength = MEDIUM
If conflicting: Signal strength = LOW or NO TRADE
Timeframe Alignment Signals
Full Alignment (Strongest)
Higher TF: Uptrend
Trading TF: Uptrend
Lower TF: Uptrend
Action: High-confidence long entries
Partial Alignment (Moderate)
Higher TF: Uptrend
Trading TF: Pullback in uptrend
Lower TF: Downtrend (temporary)
Action: Wait for lower TF to turn, then enter
Conflict (Weakest/No Trade)
Higher TF: Uptrend
Trading TF: Downtrend
Lower TF: Uptrend
Action: Wait for clarity or reduce size
Practical Multi-Timeframe Workflow
Step 1: Start High
Open your highest timeframe first.
What's the trend?
Where are key levels?
What's the context?
Step 2: Move to Trading Timeframe
Look for setups that align with higher TF.
Is there a pattern forming?
Does it align with higher TF direction?
Where would entry make sense?
Step 3: Drop to Execution Timeframe
Fine-tune your entry.
What's the immediate momentum?
Where's the optimal entry point?
Where should the stop go?
Step 4: Execute and Manage
Enter on lower TF, manage on trading TF.
Don't let lower TF noise shake you out
Use trading TF for trade management
Reference higher TF for overall thesis
Common Multi-Timeframe Mistakes
Fighting the Higher Timeframe — Taking shorts in a strong weekly uptrend because the 15M looks bearish. Higher timeframe wins. Trade with it, not against it.
Analysis Paralysis — Looking at so many timeframes that you never take a trade. Stick to three timeframes maximum.
Timeframe Hopping — Switching timeframes to justify a trade you want to take. Define your timeframes BEFORE looking at charts.
Managing on Wrong Timeframe — Entering on 1H, then panicking at every 5M candle. Manage trades on the timeframe you entered on.
Ignoring Timeframe Transitions — Not recognizing when higher TF trend is changing. Regularly check higher TF for trend health.
AI-Enhanced Multi-Timeframe Indicators
Concept 1: Trend Alignment Score
Single number showing alignment across timeframes.
Score = (TF1_trend × 3) + (TF2_trend × 2) + (TF3_trend × 1)
Where trend = +1 (up), 0 (neutral), -1 (down)
Max bullish = +6
Max bearish = -6
Concept 2: Multi-Timeframe Moving Average
Shows MA from higher timeframe on lower timeframe chart.
Application:
Daily 200 MA plotted on 1H chart
Provides context without switching charts
Concept 3: Timeframe Confluence Zones
Identifies price levels significant on multiple timeframes.
Application:
Support on daily AND weekly = stronger level
Resistance on 4H AND daily = more significant
Building Your Multi-Timeframe System
Define Your Timeframes:
Based on your trading style, select:
Trend timeframe (context)
Signal timeframe (setups)
Execution timeframe (entries)
Create Alignment Rules:
What constitutes "aligned"?
What do you do when conflicted?
How do you handle transitions?
Build Checklists:
Before Any Trade:
What's the higher TF trend?
Does trading TF setup align?
Is lower TF confirming entry?
During Trade:
Is higher TF thesis still valid?
Is trading TF structure intact?
Am I managing on correct TF?
Timeframe-Specific Characteristics
Monthly/Weekly:
Institutional positioning
Macro trends
Major support/resistance
Slow to change
Daily:
Swing trade setups
Clear trend structure
Key for most traders
Balances noise and signal
4H/1H:
Day trade setups
Intraday trends
More noise than daily
Faster signals
15M/5M:
Scalp entries
Execution timing
High noise
Requires quick decisions
1M:
Mostly noise
Only for precise execution
Not for analysis
Easy to overtrade
Key Takeaways
Higher timeframes carry more weight than lower timeframes
Use three timeframes: Trend (context), Signal (setups), Execution (entries)
Full alignment = strongest signals; conflict = wait or skip
AI can process all timeframes simultaneously — humans must be systematic
Manage trades on the timeframe you entered, not lower
Your Turn
What timeframes do you currently use in your trading?
Have you experienced the conflict of different timeframes showing opposite signals?
Share your multi-timeframe strategy below 👇

USDJPY: I want to see a light correction!Hello Traders,
This is 5Years chart!
We are around a zone! We might soon see a reaction!
and this is our daily chart!
the middle of bullish channel is well broken.
this was an obvious triangle around too!
if you didn't catch the break, you can get profit from pullbacks. specially if it is not and IMPULSE move!
"I want to see a light correction!" and then buy!

XAUUSD: We see a sell opportunity! Hello Traders,
This is the 1Y chart
We are defiantly bullish
The shorter-term chart is also bullish! However, we see some corrections and ranges lately.
For now!
I think we might have a chance to short the Gold around the zone we previously sellers were so strong.

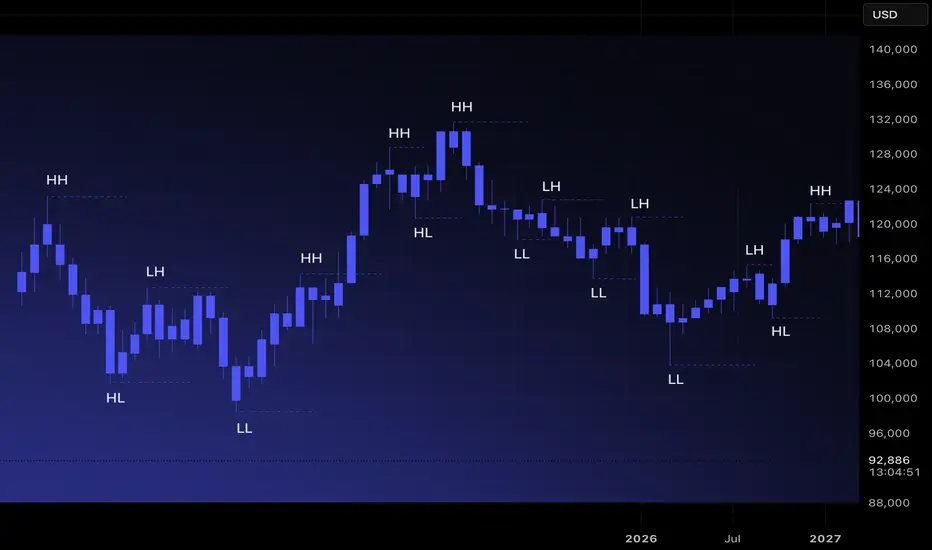
Market Structure 101: Navigating Price ActionMost traders jump directly into indicators, oscillators, or patterns. Yet every chart has a deeper foundation that determines direction long before any tool is applied. Market structure is that foundation. When you understand how price forms highs, lows, and transitions between them, you stop reacting to noise and start reading the market’s intent. It is the base layer that allows you to build a clear, consistent bias.
Price moves because buyers and sellers interact around key levels. Structure highlights where momentum strengthens, weakens, or reverses. By tracking how highs and lows evolve, you can identify trend, consolidation, and shifts in direction with far more clarity than any indicator can offer. Market structure is objective. It gives you a rule-based lens to interpret movement across all timeframes.
Understanding Highs and Lows
There are four structural components every trader must recognize.
Higher High (HH): Price breaks above a previous high, showing buyers in control.
Higher Low (HL): Price pulls back but stays above the prior low, confirming trend continuation.
Lower High (LH): Price rallies but fails to reach previous highs, indicating weakening demand.
Lower Low (LL): Price breaks below the previous low, signaling sellers taking control.
These sequences are the building blocks of trend identification. When mapped correctly, they remove guesswork and reveal underlying momentum.
Identifying Uptrends and Downtrends
Uptrend: A sequence of HHs and HLs. Buyers consistently push price higher and defend higher floors.
Downtrend: A sequence of LHs and LLs. Sellers control direction, rejecting higher prices and driving the market downward.
A trend remains intact until structure breaks. This is why experienced traders avoid predicting reversals and instead follow structural evidence. When the market prints new HHs and HLs, the bias remains long. When LLs and LHs appear, the bias rotates short.
Ranges and Consolidation
Markets do not trend all day. Much of the time, they move sideways. A range occurs when highs and lows stay relatively equal, creating a horizontal zone with equal highs and equal lows. This is where compression happens. Liquidity builds above the range highs and below the range lows, and trend often resumes only after one side of the range is taken.
In ranges, structure becomes neutral. Bias is formed only when price breaks out and retests with confirmation.
Break of Structure(BOS) and Trend Shift
A break of structure occurs when the market violates the pattern of the existing trend. In an uptrend, a break occurs when price prints an LL. In a downtrend, a break occurs when price forms an HH. This signals a potential shift in momentum.
Breaks of structure matter because they identify turning points without relying on subjective signals. They show where one side loses control and the other gains traction. They also create clear invalidation points for risk management.
How to Read Structure Across Timeframes
Market structure becomes even stronger when used across multiple timeframes. The higher timeframe sets the primary bias. The lower timeframe provides entry precision.
Weekly or Daily: Structural trend and major zones.
4H or 1H: Execution windows and key shifts.
15m and 5m: Entry confirmation.
When all levels of structure align, the probability of a clean move increases significantly.
Avoiding Common Mistakes
Many traders misread structure by focusing on every small fluctuation. Structure is defined by meaningful swings, not micro noise. Another common error is assuming a single HH or LL immediately reverses a trend. Context matters. Breaks followed by continuation and retests confirm the shift. A disciplined trader waits for structure to become clear instead of acting on isolated candles.
Turning Structure Into a Bias
Structure simplifies decision-making.
If the market is printing HH and HL formations, you prioritize longs.
If it is printing LH and LL formations, you seek shorts.
If highs and lows are equal, you wait for a breakout.
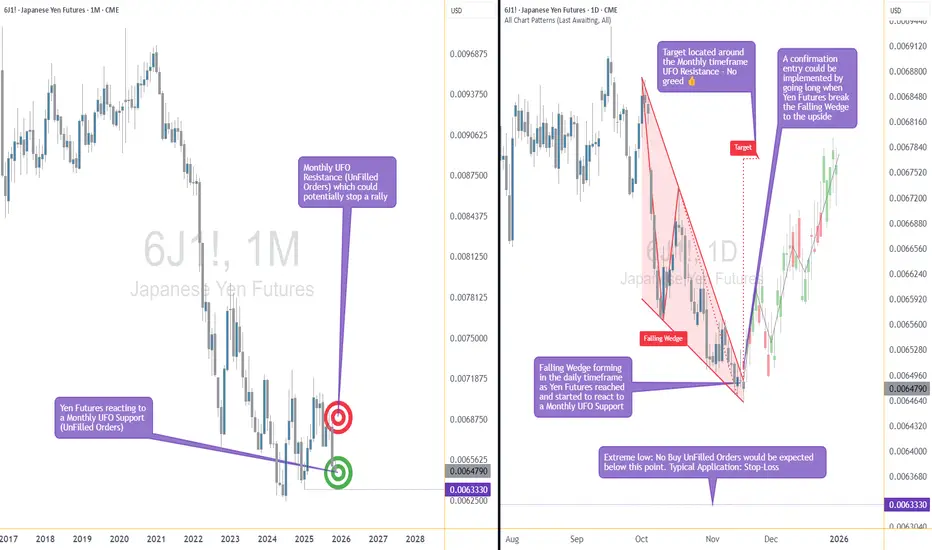
The Support Zone That Refused To Be IgnoredSome chart zones whisper. This one practically waved its arms.
Price slid right into a hefty support area on the higher timeframe… and suddenly started behaving like it had forgotten how to move lower. Classic clue.
Zoom in, and the daily chart shows price squeezing itself into a falling wedge — the market’s equivalent of someone pacing in a hallway, unsure whether to sit down or sprint. Sellers kept trying to push prices lower, but each attempt had less conviction than the last.
When you stack those two pieces together — a big support zone from the monthly chart and a daily pattern running out of room — things start to get interesting. Not predictive, just… interesting.
A breakout above the wedge (around 0.0065030) would basically say, “Alright, I’m done compressing.”
A stop tucked below the lower support range (roughly 0.0063330) keeps the scenario clean.
And a structural projection toward 0.0067695 gives the idea a tidy endpoint if momentum decides to stretch its legs.
Of course, leverage cuts both ways, and traders working with the standard or micro contracts often choose size based on how much room they want between entry and invalidation. When traders choose between the standard and micro versions of this market, it usually comes down to scale. The bigger contract represents 12,500,000 units of the underlying with a $6.25 tick, while the micro mirrors the behavior at 1,250,000 units with a $1.25 tick. Estimated margins also differ — roughly $2,800 for the larger contract and about $280 for the micro. Same chart logic, just two very different footprints on the account.
The real takeaway? When a major zone teams up with a compression pattern, it’s usually worth paying attention. Maybe it leads to a beautiful breakout. Maybe it fizzles. But structurally, this is one of those “save the screenshot” moments.
And whatever the outcome, risk management keeps the whole thing sensible — size smartly, define failure points, and let the chart prove itself instead of assuming it will.
Want More Depth?
If you’d like to go deeper into the building blocks of trading, check out our From Mystery to Mastery trilogy, three cornerstone articles that complement this one:
🔗 From Mystery to Mastery: Trading Essentials
🔗 From Mystery to Mastery: Futures Explained
🔗 From Mystery to Mastery: Options Explained
When charting futures, the data provided could be delayed. Traders working with the ticker symbols discussed in this idea may prefer to use CME Group real-time data plan on TradingView: www.tradingview.com - This consideration is particularly important for shorter-term traders, whereas it may be less critical for those focused on longer-term trading strategies.
General Disclaimer:
The trade ideas presented herein are solely for illustrative purposes forming a part of a case study intended to demonstrate key principles in risk management within the context of the specific market scenarios discussed. These ideas are not to be interpreted as investment recommendations or financial advice. They do not endorse or promote any specific trading strategies, financial products, or services. The information provided is based on data believed to be reliable; however, its accuracy or completeness cannot be guaranteed. Trading in financial markets involves risks, including the potential loss of principal. Each individual should conduct their own research and consult with professional financial advisors before making any investment decisions. The author or publisher of this content bears no responsibility for any actions taken based on the information provided or for any resultant financial or other losses.

A High-Impact Support Zone Meets a Breakout StructureIntroduction
Markets occasionally compress into areas where structure, momentum, and historical buying pressure align with surprising precision. When that compression occurs at a major higher-timeframe floor, traders often pay closer attention—not because the future is predictable, but because the chart reveals a location where price behavior typically becomes informative.
The current case study centers on a market pressing into a high-impact support zone visible on the monthly chart, while the daily chart displays a falling wedge pattern that has gradually narrowed the range of movement. This combination often highlights moments where the auction process is nearing a decision point. The purpose here is to dissect that confluence using multi-timeframe structure, pattern logic, and broad order-flow principles—strictly for educational exploration.
Higher-Timeframe Structure (Monthly)
The monthly chart shows price approaching a well-defined support area between 0.0065425 and 0.0063330, a region that has acted in the past as a base for significant reactions. These areas often develop because markets rarely absorb all buy interest in a single pass; pockets of unfilled orders may remain, leading to renewed reactions when price returns.
This type of zone does not guarantee a reversal. However, historically, when price reaches such levels, traders tend to monitor whether selling pressure slows or becomes less efficient. In this case, the structure suggests a recurring willingness from buyers to engage at these prices, forming a foundation that has held multiple swings.
The presence of a clear, higher-frame resistance at 0.0067530 anchors the broader range. When price rotates between such boundaries, the monthly context often acts as a roadmap: major support below, major resistance above, and room in between for tactical case-study exploration.
Lower-Timeframe Structure (Daily)
Shifting to the daily chart, price action has carved a falling wedge, a pattern often associated with decelerating downside movement. In wedges, sellers continue to push price lower, but with diminishing strength, as each successive low becomes less effective.
This type of compression structure can provide early evidence that the auction is maturing. Traders studying such patterns often watch for:
tightening of the range,
shorter waves into new lows,
initial signs that buyers are defending intraday attempts to drive price lower.
The daily wedge in this case sits directly on top of the monthly support zone—an alignment that strengthens its analytical relevance. The upper boundary of the wedge sits near 0.0065030, and a break above that line is often interpreted as price escaping the compression phase.
Multi-Timeframe Confluence
Multi-timeframe confluence arises when higher-frame structure provides the background bias and lower-frame patterns offer the tactical trigger. In this case:
The monthly chart signals a historically responsive support zone.
The daily chart shows structural compression and slowing downside momentum.
The interaction between them creates a scenario where educational case studies tend to focus on breakout behavior, as the daily timeframe may provide the first evidence that higher-frame buyers are engaging.
This confluence does not imply certainty. It simply highlights a location where structure tends to become more informative, and where traders often study the transition from absorption to response.
Order-Flow Logic (Non-Tool-Specific)
From an order-flow perspective, strong support zones typically develop where prior buying activity left behind unfilled interest. When price returns to that region, two things often happen:
Sellers begin to encounter difficulty driving price lower, as remaining buy orders absorb their activity.
Compression patterns form, as the market oscillates in a tightening range while participants test whether enough liquidity remains to cause a directional shift.
A breakout of the daily wedge represents a potential change in the auction dynamic. While sellers are still active inside the wedge, a breakout suggests their pressure may have become insufficient to continue the sequence of lower highs and lower lows. Traders studying market transitions often use such moments as part of hypothetical scenarios to understand how imbalances evolve.
Forward-Looking Trade Idea (Illustrative Only)
For educational purposes, here is how a structured case study could frame a potential opportunity using the discussed charts:
Entry: A hypothetical entry could be placed above the falling wedge, around 0.0065030, once buyers demonstrate the ability to break outside the compression structure.
Stop-Loss: A logical invalidation area in this case study would be at or below the monthly support, around 0.0063330, where failure would indicate the higher-timeframe zone did not hold.
Target: A purely structural wedge projection would suggest a target near 0.0067695, aligning closely with the broader resistance region on the monthly chart.
These price points yield a reward-to-risk profile that is measurable and logically linked to structure, though not guaranteed. This case study exists solely to illustrate how support-resistance relationships and pattern logic can be combined into a coherent, rules-based plan, not as an actionable idea for trading.
Yen Futures Contract Context
The larger (6J) and micro-sized (MJY) versions of this futures market follow the same underlying price but differ in exposure and margin scale. The standard contract generally carries a greater notional value and therefore translates each price movement into a larger monetary change. The micro contract mirrors the same structure at a reduced size, allowing traders to adjust position scaling more precisely when navigating major zones or breakout structures such as the one discussed in this case study:
6J equals 12,500,000 Japanese Yen per contract, making it suitable for larger, institutional players. (1 Tick = 0.0000005 per JPY increment = $6.25. Required Margin = $2,800)
MJY equals 1,250,000 Japanese Yen per contract, making it suitable for larger, institutional players. (1 Tick = 0.000001 per JPY increment = $1.25. Required Margin = $280)
Understanding margin requirements is essential—these products are leveraged instruments, and small price changes can result in large percentage gains or losses.
Risk Management Considerations
Strong support zones can attract interest, but risk management remains the foundation of any structured approach. Traders studying these transitions typically:
size positions relative to the distance between entry and invalidation,
maintain clear exit criteria when structure fails,
avoid adjusting stops unless the market has invalidated the original reasons for the plan,
adapt to new information without anchoring to prior expectations.
These principles emphasize the importance of accepting uncertainty. Even at major support zones, markets can remain volatile, and scenarios may unfold differently than anticipated.
When charting futures, the data provided could be delayed. Traders working with the ticker symbols discussed in this idea may prefer to use CME Group real-time data plan on TradingView: www.tradingview.com - This consideration is particularly important for shorter-term traders, whereas it may be less critical for those focused on longer-term trading strategies.
General Disclaimer:
The trade ideas presented herein are solely for illustrative purposes forming a part of a case study intended to demonstrate key principles in risk management within the context of the specific market scenarios discussed. These ideas are not to be interpreted as investment recommendations or financial advice. They do not endorse or promote any specific trading strategies, financial products, or services. The information provided is based on data believed to be reliable; however, its accuracy or completeness cannot be guaranteed. Trading in financial markets involves risks, including the potential loss of principal. Each individual should conduct their own research and consult with professional financial advisors before making any investment decisions. The author or publisher of this content bears no responsibility for any actions taken based on the information provided or for any resultant financial or other losses.
Ethereum is deciding where it wants to live.This is not a trade idea, this is a long term concept, most of my portfolio is swing when bull market comes (monthly/yearly) not trade (daily/weekly).
This is a solid question that will have to be played out in the upcoming years, Ethereum keeps changing its monetary policy and right now has less supply increase than BTC (due to burning mechanisms), will that stay forever? What will happen in the future to the policy? What it will mean for price?
Right now we can clearly see this is a bull case for future months.

EURGBP: Possible reaction to the PMI for the next week.Hello Traders,
Reactions to the HTF-Strong resistance is a sign of more bearish moves.
Any touches with the De-valuations line means cancelation of the analysis.
Breaking below the 0.86660 will activate the setup.
Any activation before the red vertical line is invalid.

GBPUSD: Waiting for bullish pullback signalsIn my previous analyses, GBPUSD has been in a corrective downtrend on the daily timeframe. On the lower timeframes, the pair continues to test support and resistance levels to confirm the overall trend.
Daily timeframe outlook:
4h timeframe outlook:
* Trend: assessed using at least three trend indicators, with market structure as the primary guide.
** Weak or Reversal Signals: Assessed based on one of our criteria for trend reversal signals.
*** Support/Resistance: Selected from multiple factors – static (Swing High, Swing Low, etc.), dynamic (EMA, MA, etc.), psychological (Fibonacci, RSI, etc.) – and determined based on the trader’s discretion.
**** Our advice takes into account all factors, including both fundamental and technical analysis. It is not intended as a profit target. We hope it can serve as a reference to help you trade more effectively. This advice is for informational purposes only and we assume no responsibility for any trading results based on it.
George Vann @ ZuperView

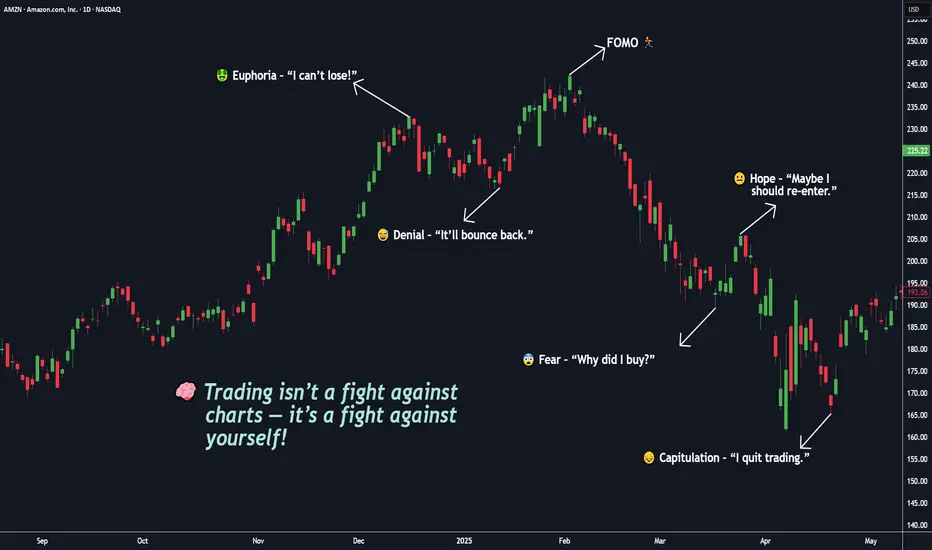
You’re Not Competing With the Market, You’re Competing With Self🧠 Trading isn’t a fight against charts — it’s a fight against yourself.
If you’ve ever told yourself “I’ll just take one more trade”, you already know this battle.
But in truth — the real battle happens inside your mind.
You start your day with discipline: BITSTAMP:BTCUSD , NASDAQ:AMZN , OANDA:XAUUSD , NASDAQ:META
📋 “ Two setups max. 1% risk. No emotions. ”
But then the market shows you something that looks perfect.
Price moves fast. Your pulse jumps. You click “BUY BUY BUY.”
Seconds later , the candle reverses — and suddenly, you chase a candle, break a rule, or move your stop just to “ give it a little more space ,” you’re not losing to the market my friend, You’re losing to your own impulses. ⚔️
You’re not trading the chart anymore — you’re trading your hope. And that’s what makes trading beautiful — it’s not a test of intelligence, it’s a mirror of your self-awareness.
That’s when the market does what it always does: it punishes emotional decisions and rewards patient ones.
💭 Emotionally! You start bargaining with yourself:
“It’ll come back.” ( When you’re greedy → it exposes it. )
“I’ll just move my stop a little.” ( When you’re fearful → it magnifies it. )
“Let me add to average out.” ( When you’re calm → it rewards it. )
The market doesn’t care if you win or lose. It simply amplifies your inner state.
You Digest it or not!, the truth most don’t want to accept:
You can’t control the market.
You can’t control news, indicators, or price spikes.
But you can control your reactions.
The moment you stop reacting and start observing — your trading transforms.
Clarity comes only when emotion leaves. 💎
⚡ Trading isn’t about predicting moves — it’s about managing yourself during those moves.
🎯 Real-Life Example:
Think back to the last time you made money on a random FOMO entry. It felt good, right?
That “instant win” wired your brain to believe impulsiveness works.
But the next time, that same instinct cost you twice as much.
That’s recency bias — one of trading’s silent killers.
Your brain craves the last emotion it felt, not the right decision.
💎 True mastery begins when you stop asking:
“Why did the market do that?”
and start asking:
“Why did I react like that?” ( 👉 “ Am I reacting, or am I responding ?” )
The market has no emotions . It’s just reflecting yours back at you — amplified, delayed, and multiplied by leverage. ⚔️
🧩 Here’s the mindset shift, that changes everything:
You don’t need to win every trade. You need to trade as if you already know yourself.
You don’t need a better indicator. You need a clearer mirror.
The edge isn’t on the screen — it’s inside your head.
When you realize that, trading becomes peaceful and You stop chasing, You start choosing.
Master that single question, and you’ll outperform 90% of traders who never will.
💬 What’s one emotion you think costs you the most trades —
👉 Fear 😨
👉 Greed 🤑
👉 Impatience ⚡
🧩 Drop it below 👇 and let’s talk about how to overcome it — build awareness together as traders, not competitors.
If this Idea gave you a value information then please, Boost it, share your thoughts in comments, and follow for more practical trading!
Happy Trading & Investing!
Team @TradeWithKeshhav
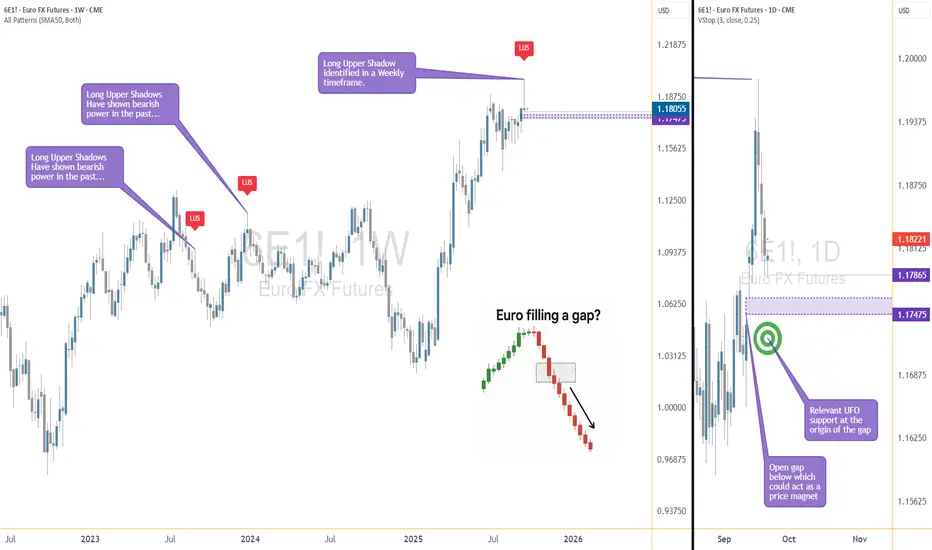
Mind the Gap! The Euro's Waiting GameShadows and Gaps: The Market’s Inside Joke
Euro FX Futures (6E, M6E) are doing that thing again… you know, when the chart leaves a Long Upper Shadow (LUS) on the weekly candle and basically whispers, “Don’t get too comfortable up here, bulls.”
Shadows this long usually mean buyers tried to party at higher levels, but sellers crashed the event and sent everyone home early. And just to make life interesting, the daily chart left an open gap below — like an unfinished side quest in a video game. Gaps are notorious for pulling price back, sooner or later, because the market hates leaving things undone.
The Setup: Simple but Sweet
Here’s how the trade idea shapes up:
Trigger: Wait for a break below 1.17865 (prior low).
Target: 1.17475 — the “gap magnet” zone.
Stop: 1.18090, based on volatility so it isn’t just a random guess.
Reward-to-Risk: Around 2:1. Clean, balanced, and not too shabby.
⚠️ Quick heads-up: right under that gap sits a support zone. Translation? Don’t overstay your welcome. Get in, fill the gap, and don’t go fishing for extra ticks where a bounce might kick you out.
Why This Combo Works
This setup is a little like peanut butter and jelly — two different flavors that just click.
Weekly chart = a big ol’ rejection shadow.
Daily chart = a gap that’s basically screaming, “Fill me!”
Put them together, and you’ve got multi-timeframe confluence — a fancy way of saying “both charts agree.” And when charts agree, traders pay attention.
Big vs. Mini: Futures Contract Fun
6E (Euro FX Futures): Big contract, €125,000. Each tick = $6.25. Great for heavy hitters.
M6E (Micro Euro FX Futures): Mini-me version, 1/10th the size. Each tick = $0.625. Perfect if you’d rather test the waters than dive headfirst.
Micros make scaling in and out a breeze, and honestly, they’re underrated for learning without risking the farm.
The Takeaway
The Euro is caught between rejection above and a magnet below. No downside break yet, but once 1.17865 goes, the path to 1.17475 could be quick.
Moral of the story? Candlestick shadows troll the highs, gaps tempt the lows, and patience is the secret sauce.
Want More Depth?
If you’d like to go deeper into the building blocks of trading, check out our From Mystery to Mastery trilogy, three cornerstone articles that complement this one:
🔗
🔗
🔗
When charting futures, the data provided could be delayed. Traders working with the ticker symbols discussed in this idea may prefer to use CME Group real-time data plan on TradingView: www.tradingview.com - This consideration is particularly important for shorter-term traders, whereas it may be less critical for those focused on longer-term trading strategies.
General Disclaimer:
The trade ideas presented herein are solely for illustrative purposes forming a part of a case study intended to demonstrate key principles in risk management within the context of the specific market scenarios discussed. These ideas are not to be interpreted as investment recommendations or financial advice. They do not endorse or promote any specific trading strategies, financial products, or services. The information provided is based on data believed to be reliable; however, its accuracy or completeness cannot be guaranteed. Trading in financial markets involves risks, including the potential loss of principal. Each individual should conduct their own research and consult with professional financial advisors before making any investment decisions. The author or publisher of this content bears no responsibility for any actions taken based on the information provided or for any resultant financial or other losses.

Gap-Fill Watch: Euro FX Futures React to Weekly RejectionIntroduction
When analyzing futures markets, one of the most compelling signals arises when higher timeframe candlestick rejection aligns with lower timeframe price imbalances. That is exactly what we see in Euro FX Futures (6E, M6E). On the weekly chart, long upper shadows (LUS) have historically marked turning points, reflecting exhaustion of bullish pressure. On the daily chart, an open gap below current price offers a potential magnetic pull. Together, these elements provide a textbook technical case study of how price can align across timeframes.
This article explores the educational insights behind candlestick rejection and gap mechanics, then applies them to a concrete trading scenario in 6E and its micro equivalent, M6E.
Weekly Chart: The Long Upper Shadow (LUS)
Long Upper Shadows appear when a market tests higher levels but fails to sustain them, leaving sellers in control by the close. They are one of the clearest visual expressions of rejection.
In Euro FX Futures, past long upper shadows have preceded significant bearish moves. Each instance reflects an imbalance where buyers were unable to absorb selling pressure at higher prices. The most recent weekly candlestick shows another long upper shadow forming near resistance. For technically minded traders, this is an early warning sign of potential downside ahead.
Daily Chart: The Open Gap Below Price
Price gaps occur when markets open significantly away from the prior session’s close. In futures, gaps often act like magnets—price tends to revisit them over time as liquidity seeks balance.
Currently, Euro FX Futures show an unfilled gap just below the market. Historically, such gaps in 6E have attracted price action, especially when combined with bearish rejection signals from higher timeframes. The combination of a weekly LUS above and a daily gap below paints a picture of imbalance: rejection at the highs, unfinished business at the lows.
Trade Setup
A structured trade idea emerges from this technical alignment:
Entry condition: Short position if 6E breaks below the prior day’s low at 1.17865. This ensures price is moving in line with bearish continuation before entry.
Target: 1.17475, the origin of the open gap. This is where the “magnet effect” is expected to complete.
Stop-loss: 1.18090, derived from a 2-day ATR calculation and adjusted to 25%. This keeps risk tight but accounts for minor noise.
Reward-to-Risk Ratio: With entry near 1.17865, risk is around 22 ticks while potential reward is about 39 ticks, yielding a favorable R:R of almost 2:1.
Risk caveat: Right below the gap origin lies a UFO support area. This means price may stall or reverse after the gap is filled. Being conservative with the target is wise—seeking deeper downside could run into structural support.
Contract Specs and Margin Notes
Understanding the contract structure is vital when applying risk management.
o Euro FX Futures (6E):
Contract size = €125,000
Tick size = 0.00005 USD per euro = $6.25 per tick
Initial margin (approximate, varies daily): ~$2,500–$3,000
o Micro EUR/USD Futures (M6E):
Contract size = €12,500 (1/10th of 6E)
Tick size = 0.0001 USD per euro = $1.25 per tick
Initial margin (approximate, varies daily): ~$300–$400
Application: Traders with smaller accounts can use M6E to size positions more precisely, while larger participants may choose 6E for liquidity. Micros provide flexibility to scale in/out of trades while maintaining strict risk per trade.
Risk Management Essentials
Risk management is not about avoiding losses—it is about ensuring that any loss remains controlled relative to potential reward. This trade idea highlights three core principles:
Stop placement by ATR: Volatility-based stops adjust naturally to current market conditions. Using 25% of a 2-day ATR prevents overexposure while respecting noise.
Position sizing: Traders should calculate how many contracts (6E or M6E) align with their personal risk tolerance.
Target discipline: While tempting to aim lower than the gap origin, technical evidence suggests price may encounter support there. Conservative targeting avoids overstaying a move.
Educational Takeaway
This setup demonstrates the power of multi-timeframe confluence. A weekly rejection signal provides context, while a daily gap gives tactical direction. Traders often gain an edge when higher timeframe sentiment (bearish rejection) aligns with lower timeframe imbalances (gap fill).
For students of price action, this is a reminder that candlestick patterns should never be taken in isolation. Instead, they should be validated by market structure, liquidity imbalances, or other confirming signals.
Conclusion
Euro FX Futures present a case study in how weekly rejection and daily gaps can combine to create a structured opportunity. While no outcome is certain, the confluence of signals here underscores the educational value of analyzing shadows and gaps together.
Traders can study this setup not only as a potential trade but also as a lesson in disciplined multi-timeframe analysis.
When charting futures, the data provided could be delayed. Traders working with the ticker symbols discussed in this idea may prefer to use CME Group real-time data plan on TradingView: www.tradingview.com - This consideration is particularly important for shorter-term traders, whereas it may be less critical for those focused on longer-term trading strategies.
General Disclaimer:
The trade ideas presented herein are solely for illustrative purposes forming a part of a case study intended to demonstrate key principles in risk management within the context of the specific market scenarios discussed. These ideas are not to be interpreted as investment recommendations or financial advice. They do not endorse or promote any specific trading strategies, financial products, or services. The information provided is based on data believed to be reliable; however, its accuracy or completeness cannot be guaranteed. Trading in financial markets involves risks, including the potential loss of principal. Each individual should conduct their own research and consult with professional financial advisors before making any investment decisions. The author or publisher of this content bears no responsibility for any actions taken based on the information provided or for any resultant financial or other losses.
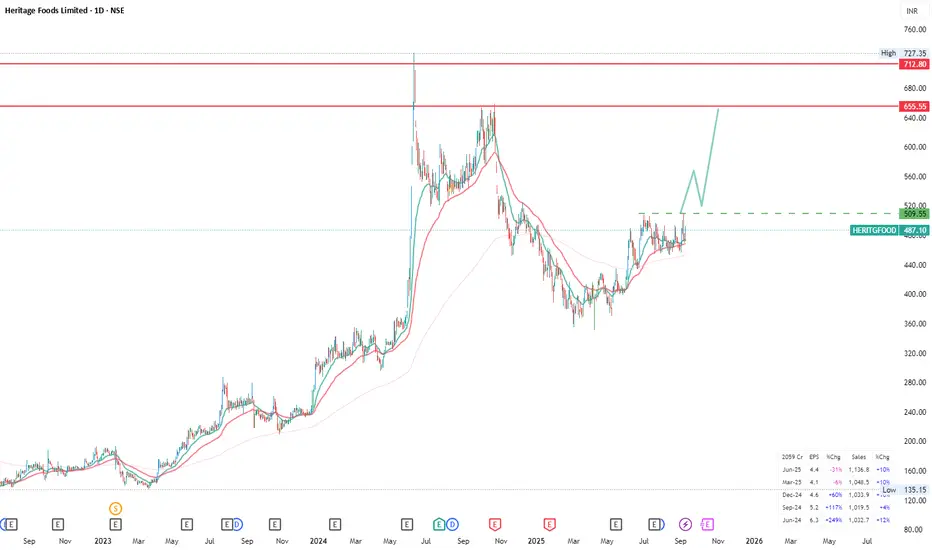
Heritage Food - Dairy Product going to become a Brand - Go LongGST relief for dairy products
The revised GST rates, effective September 22, are set to benefit the organized dairy sector significantly. Key changes include:
UHT milk: reduced from 5% to 0%
Butter, ghee, cheese: cut from 12% to 5%
Paneer: brought down from 5% to 0%
This move is expected to make packaged dairy products more affordable, boosting demand across India and giving a direct push to branded players.
Heritage Foods among key beneficiaries
As one of India’s prominent dairy firms, Heritage Foods is poised to benefit from lower tax incidence, potentially improving sales volumes and consumer reach. The announcement also sparked optimism across other dairy counters such as Hatsun Agro, Parag Milk, Dodla Dairy, Umang Dairies, and Nestle India (value-added dairy portfolio). FMCG majors like Britannia and ITC are also seen as indirect beneficiaries.
Market outlook
Brokerage houses believe the GST cuts are a strong positive catalyst for the dairy industry, aiding profitability and consumption growth. Investors now await Q2 results to see the real impact of the new tax regime on revenue momentum.
Record Revenue: Q1 FY26 delivered the highest ever quarterly revenue at INR 11,368 million, marking the third consecutive quarter of double-digit revenue growth. Management attributes this to “strength of the core business and agility of our supply chain networks”.
Profitability:
EBITDA: INR 739 million, margin at 6.5%.
PAT: INR 405 million, margin at 3.6%.
Margins were “softer due to seasonality, input cost inflation and a temporary product mix shift”, but are expected to “normalize in coming quarters as volume-led operating leverage kicks in.”
Brand & Product Initiatives
360-degree Brand Campaigns: Rolled out across Andhra Pradesh, Telangana, Tamil Nadu, and Karnataka. Notable campaigns for curd (season three) and first-ever milk brand campaign focused on “purity.”
Heritage Livo Platform: Launched fortified flavored milk (vitamins A & D) and high-protein yogurts. Targeting “growing health-conscious consumer segment.”
Margin & Cost Dynamics
Input Costs:
Raw milk procurement price up 4.74% YoY, “a tad higher than what we would have liked, but nothing extraordinary.”
Sequential increases in procurement prices due to lean seasonality (May–June).
Management chose to “hold price increases to ensure volumes stay strong” in April–May, especially for VAPs.
Gross Margin Analysis:
Margin knock (160–180 bps) attributed to VAP mix decline, not bulk fat losses.
Standalone VAP (ex-fats) share: 36.1% vs 37.5% YoY; management expected 39% if growth had continued.
Lower volumes in VAPs led to suboptimal cost absorption and plant utilization.
June saw normalization; July onwards expected to be “normalized.”
Inventory & Working Capital
SMP Inventory:
6,197 MT as of 30 June 2025 vs 4,586 MT YoY.
Higher stock due to lower consumption in Q1 (VAP demand hit); expected to be consumed in Q2–Q3.
Working Capital:
Cycle days at 19 (inventory: 35 days, receivables: 3 days, payables: 17 days).
Commitment to maintain <20 days, aided by B2C model and fresh nature of products.
Industry Headwinds:
Q1 impacted by “erratic monsoon and unseasonably cool summer,” leading to VAP demand shrinkage and margin softness.
Management expects “normalization” as volumes recover and operating leverage improves.
Milk supply expected to be stable; procurement prices may see minor increases but “nothing extraordinary.”
SMP inventory to be absorbed in Q2–Q3 as VAP demand recovers.
Growth Guidance:
No formal guidance, but management aspires to return to 15–16% revenue growth and ~20% VAP growth for FY26, assuming normalization of demand.
EBITDA margin expected to recover by “at least a percentage correction.”
Sep 5, 2025 - BTCUSDT Multi Time Frame Chart Analysis-04Intro
Today I want to approach the market from the top down — starting with the higher timeframes and gradually moving lower — to refresh my overall outlook. Ideally, I’d do this after each weekly candle close, but I’ve decided to try it today as part of my decision-making process.
I generally prefer to react to the market rather than predict it, but in order to prepare my reactions ahead of time, I want to see whether Bitcoin shows any signs of correction in the weekly timeframe. Of course, September’s fundamental events could heavily influence market direction, but for now, I’ll stick to the technical picture.
1️⃣ Weekly Timeframe
The weekly chart clearly shows Bitcoin in a strong uptrend . Price remains above the rising trendline, consistently printing higher highs and higher lows.
* One observation: the percentage growth after each rally is slowing, but the absolute growth remains relatively constant at around $45,000 per leg. This suggests that if price rejects from the trendline again, the next potential target could be around $150,000, which also aligns with Fibonacci extensions.
So far, there are no signs of a trend reversal .
⚠️ However, according to Dow Theory , volume should confirm the trend — yet Bitcoin’s weekly volume has been declining. This is an early signal of potential weakness.
➡️ For now, the weekly structure doesn’t indicate a correction, but if the weekly trendline breaks, we’ll reassess.
2️⃣ Daily Timeframe
Currently, Bitcoin is ranging between 101,000 and 123,600 . Despite the broader bullish bias, both lower highs and lower lows have appeared recently, signaling weaker bullish momentum.
* With the latest correction from 123,000 to 112,300 , the price is now closer to its long-term trendline than ever before.
* We don’t yet have confirmation that the correction is finished, but there are hints:
1- Momentum on the downside has slowed. We’re even seeing the first equal high formation — if a higher low + higher high follows, that would confirm a trend shift.
2- Inflows: During the last bullish leg in the 4H chart, Bitcoin dominance also made a bullish leg, suggesting fresh money entering Bitcoin. But since dominance is still in a larger downtrend, this could just be a corrective bounce.
📌 With today’s important news release, if data favors crypto, we could see a continuation to the upside. If not, I expect Bitcoin to revisit its long-term trendline first before deciding the next move.
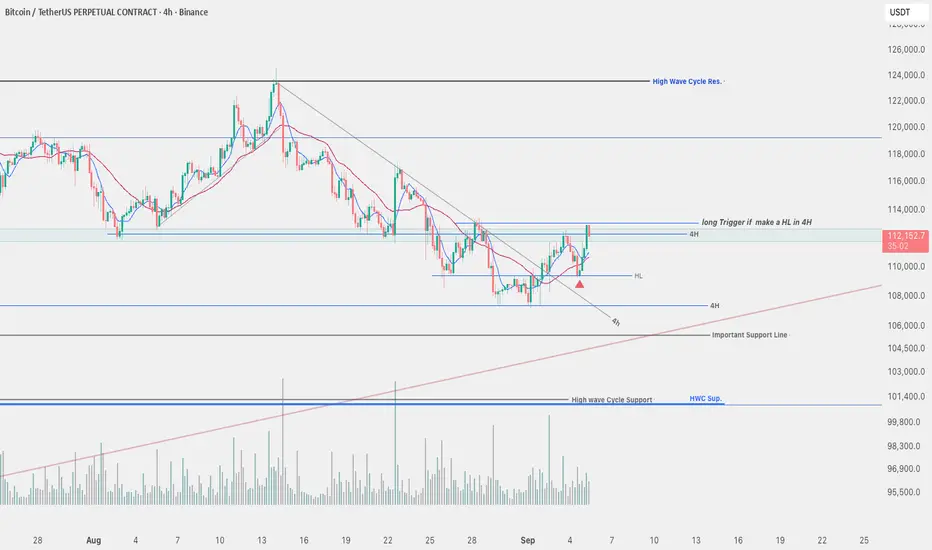
3️⃣ 4H Timeframe
The daily correction looks like a clean descending trend on the 4H chart, with clear lower highs and lower lows.
* This channel has now been broken.
* A higher low has already formed.
➡️ If today’s long trigger breaks, it could be a good long opportunity provided BTC dominance rises alongside Bitcoin.
Otherwise, it may be more reasonable to look for long setups in altcoins.
Sniper Entry on AUDCAD - SMC Concepts - Trade Code RevealedAlright snipers, here it is!
From today onwards, I will publish my live trades. My A+ setups.
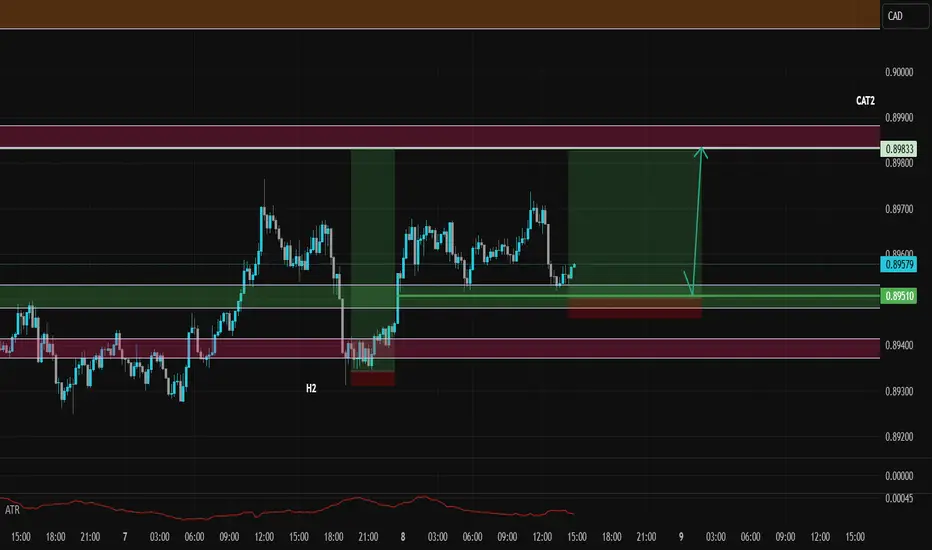
In this one, I follow the H2 game ( Bullish) as there is no other game played at the moment on this pair contradicting my story.
Story says, H8 bullish, H2 bullish, BOS confirmed. Now market is mitigating towards an imbalance left behind and visible on m15/m8.
I am expecting this last point of true mitigation to be reached, inducing the last swing buyers who believe the market has to go up.
Also a very important info: market will break through the low of Asia and low of Europe sessions before taking off (0.89519)
No sign of reversal move either, H8 candles are closing above the H8 S/R. No sign of H2 or m30 reversal candlestick pattern (Rejection + Acceleration or Supply Zone). So we're good to go.
Enjoy this trade! See you on the one...
EURGBP: Bearish Continuation from Reclaimed Order Block!Greetings Traders,
In today’s analysis of EURGBP, we observe that institutional order flow on the H4 timeframe has recently shifted bearish. This provides us with a clear directional bias to look for shorting opportunities in line with the prevailing higher timeframe trend.
Higher Timeframe Context:
On the weekly timeframe, price action is currently drawing towards a Weekly Fair Value Gap (FVG). This bearish draw on liquidity confirms the macro-level bearish sentiment. With the recent bearish market structure shift (MSS) on the H4, we now have strong confluence between the weekly and intraday order flow, favoring continued downside.
Key Observations on H4:
Reclaimed Bearish Order Block: After shifting structure to the downside, price has retraced into a bearish reclaimed order block—a region previously marked by institutional selling. This return to the origin of prior sell-side imbalance offers institutions the opportunity to mitigate earlier positions and reinitiate shorts. The failure of price to break higher confirms bearish intent.
Confluence with Weekly Draw: The reclaimed order block aligns with the broader draw towards the weekly FVG, providing an optimal zone for bearish confirmation entries.
Trading Plan:
Entry Strategy: Look for lower timeframe confirmation entries within the H4 reclaimed order block.
Target: The short-term target remains the Weekly Fair Value Gap, supporting a discount-side delivery.
As always, remain disciplined in execution. Let the market confirm your bias before entering, and manage risk according to your rules.
For a detailed market walkthrough and in-depth execution zones, be sure to watch this week’s Forex Market Breakdown:
Kind Regards,
The Architect 🏛️📉

AUDJPY: Bullish Structure Shift Signals Institutional Buy ZoneGreetings Traders,
In today’s analysis of AUDJPY, we observe a recent bullish market structure shift (MSS), signaling potential for continued upward movement. With this in mind, we aim to capitalize on buying opportunities at key institutional points of interest to target higher premium prices.
Higher Timeframe Context:
The weekly timeframe maintains a clear bullish narrative. This long-term bias is now supported by a bullish MSS on the H4 timeframe, offering strong confluence and alignment across both macro and intermediate structures. This increases our confidence in expecting further bullish continuation.
Key Observations on H4:
Weekly Fair Value Gap (FVG) Support: Price recently pulled back into a weekly FVG and has rebalanced that inefficiency. This reaction aligns with the H4 MSS, reinforcing the weekly FVG as a strong institutional support zone.
Reclaimed Bullish Order Block: After the MSS, price retraced into a bullish reclaimed order block—an area where previous institutional positioning occurred. Since price has now reclaimed this level, it becomes a high-probability zone for renewed buying interest in the direction of the dominant trend.
Lower Timeframe Confirmation: This reclaimed order block will serve as our primary zone of interest to seek confirmations on the lower timeframes for precise entries.
Trading Plan:
Entry Strategy: Wait for bullish confirmation within the reclaimed H4 order block zone before entering long positions.
Target: The primary objective is the H4 liquidity pool situated at premium prices, which the market is likely to be drawn toward.
For a detailed market walkthrough and in-depth execution zones, be sure to watch this week’s Forex Market Breakdown:
As always, execute with discipline and align your trade management with your overall plan.
Kind Regards,
The Architect 🏛️📈

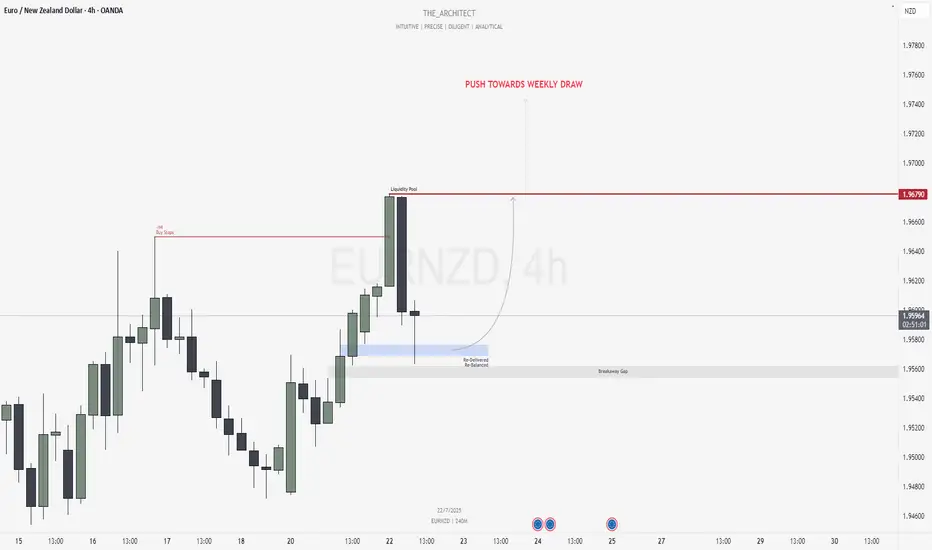
EURNZD: Bullish Confluence Aligns for Buy Setups at Key ArraysGreetings Traders,
In today’s analysis of EURNZD, we identify that the current institutional order flow is bullish. With this bias in mind, we aim to capitalize on high-probability buying opportunities from key points of interest aligned with institutional behavior.
Higher Timeframe Context:
The weekly timeframe is showing a clear bullish narrative. This bullish order flow is confirmed by the H4 timeframe, which is also delivering higher highs and higher lows—providing confluence between both the macro and intermediate timeframes. This alignment increases our confidence in seeking long setups.
Key Observations on H4:
Buy-Side Liquidity Sweep: Price recently took out H4 buy stops, which triggered a retracement into internal range price action.
Re-Delivered Re-Balanced Zone (RDRB): Price has now pulled back into a re-delivered, re-balanced array—a significant institutional level that typically offers low-risk buy setups. Given the nature of this zone, we do not anticipate a deeper pullback into the fair value gap (FVG), thereby treating it as a potential breakaway gap.
Draw on Liquidity: The next probable target is the external liquidity pool resting in premium prices. The market appears poised to gravitate towards that area.
Trading Plan:
Entry Strategy: Monitor the lower timeframes for bullish confirmations within the RDRB array.
Targets: The primary target is the engineered liquidity pool in premium prices.
For a detailed analysis, please watch this weeks Forex Outlook:https://www.tradingview.com/chart/EURNZD/BZC9xW1L-July-21-Forex-Outlook-Don-t-Miss-These-High-Reward-Setups/
Remain patient, trust the structure, and execute with precision as the bullish narrative unfolds.
Kind Regards,
The Architect 🏛️📈
EURJPY: MSS on H4 Signals Bearish Shift Toward Weekly FVGGreetings Traders,
In today’s analysis of EURJPY, we observe that a Market Structure Shift (MSS) has recently occurred on the H4 timeframe, indicating a potential change in directional bias. This suggests that price may begin to draw toward the Weekly Fair Value Gap (FVG), presenting a favorable opportunity to align with bearish order flow.
Higher Timeframe Context:
The weekly timeframe currently shows an unfilled Fair Value Gap (FVG) to the downside, acting as the primary draw on liquidity. This macro bearish draw adds weight to the idea of shorting the pair from premium levels. On the H4—our intermediate timeframe—we now have structural confirmation via a bearish MSS, aligning the two timeframes toward downside targets.
Key Observations on H4:
Bearish Order Block in Premium: Price has recently retraced into an H4 bearish order block situated within premium pricing. This zone acts as institutional resistance and is currently showing signs of rejection.
Confirmation Zone: This H4 bearish order block is being monitored for M15 confirmation entries, as we look for price to break lower from this key institutional level.
Engineered Support & Resting Liquidity: Just above the weekly FVG lies an engineered support zone—characterized by equal lows—suggesting that liquidity has been pooled there. This area serves as a high-probability draw for institutional price delivery.
Trading Plan:
Entry Strategy: Seek lower timeframe (M15) confirmation around the H4 bearish order block before initiating short positions.
Targets: The first target lies at the H4 internal liquidity pool within discounted pricing. The longer-term objective is the weekly FVG, where liquidity is likely to be delivered next.
For a detailed analysis, please watch this weeks Forex Outlook:https://www.tradingview.com/chart/EURNZD/BZC9xW1L-July-21-Forex-Outlook-Don-t-Miss-These-High-Reward-Setups/
Maintain patience, follow your confirmation rules, and always adhere to sound risk management principles.
Kind Regards,
The_Architect 🏛️📉

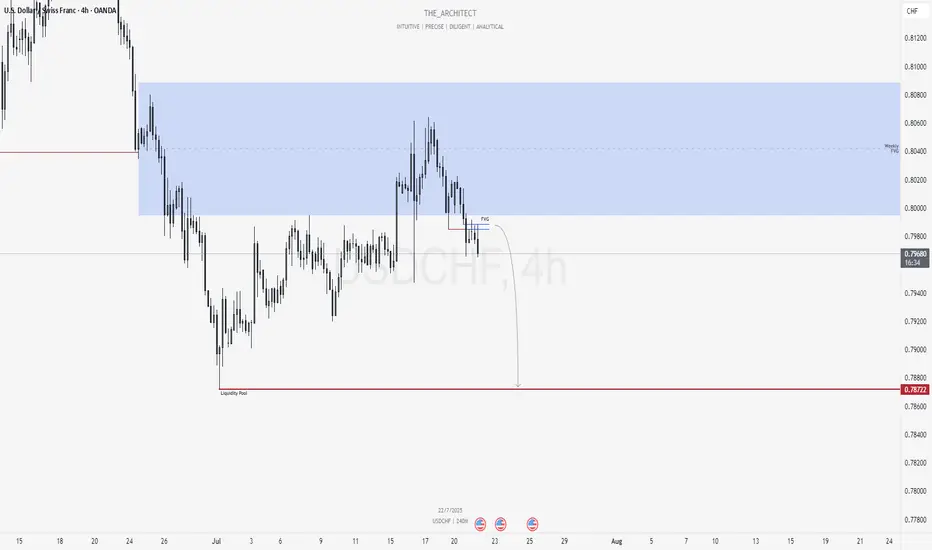
USDCHF: Bearish Shift Offers Premium Selling ZonesGreetings Traders,
At present, USDCHF is exhibiting a clear shift in institutional order flow toward the bearish side. In response, we aim to align with this directional bias by identifying high-probability selling opportunities within premium price zones.
Higher Timeframe Context:
The weekly timeframe remains bearish, offering a macro-level bias. Price recently pulled back into the weekly Fair Value Gap (FVG), a key internal range area. With this retracement complete, we now expect the market to begin its delivery toward external liquidity pools located in discounted price zones.
Key Observations on H4:
Market Structure Shift (MSS): USDCHF has recently presented a bearish MSS on the H4, confirming a change in the internal structure and further validating the bearish narrative.
H4 Fair Value Gap Rejection: Following the MSS, price retraced into a newly formed H4 FVG. This area now serves as a short-term institutional resistance zone.
Sell Opportunity Zone: This H4 FVG provides a valid zone to seek confirmation-based entries on the lower timeframes (e.g., M15), with the objective of targeting downside liquidity.
Trading Plan:
Entry Strategy: Look for short setups via confirmation on the M15 timeframe within the current H4 FVG zone.
Targets: Focus on internal liquidity pools within discounted price levels, with the broader objective being the external liquidity resting beneath recent swing lows.
For a detailed market walkthrough and in-depth execution zones, be sure to watch this week’s Forex Market Breakdown:
Kind Regards,
The Architect 🏛️📉
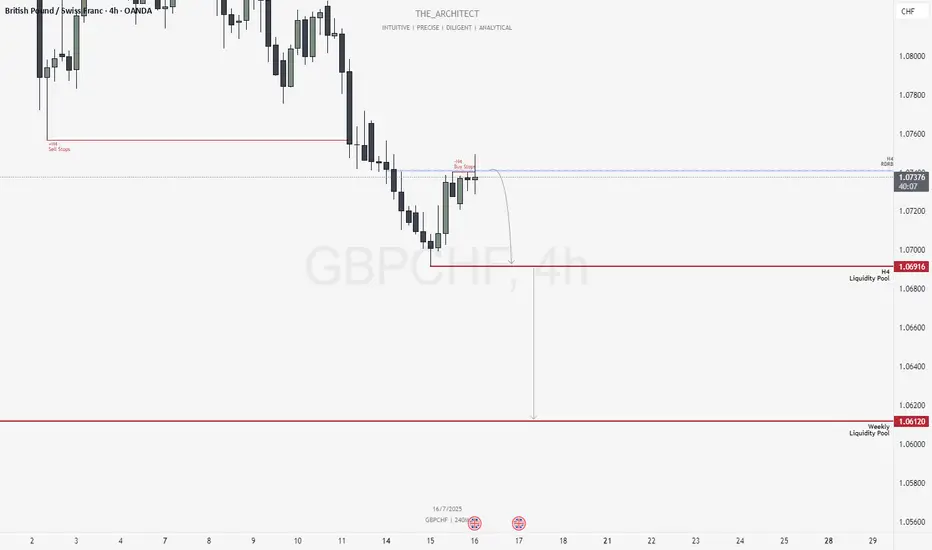
GBPCHF: Bearish Structure Aligns for Potential Sell Setups!Greetings Traders,
In today’s analysis of GBPCHF, we observe that the institutional order flow is currently bearish, and as such, we aim to align with this bias by identifying selling opportunities from key institutional resistance zones.
Higher Timeframe Context:
Weekly TF:
The weekly timeframe, which serves as our macro bias, is firmly bearish. This sentiment is reinforced on the H4 timeframe—our intermediate structure—which is also delivering consistent lower highs and lower lows. The alignment between these two timeframes strengthens our conviction to trade in the direction of institutional bearish order flow.
Key Observations on H4:
Re-delivered & Re-balanced Price Zone: Price has retraced into a previously balanced area that has now been re-delivered into, signaling institutional interest. Rejection from this zone adds to our bearish bias.
Buy Stop Raid: Price action has swept H4 buy stops in this area, providing confirmation that smart money may have used this liquidity for order pairing into short positions.
Entry Zone: The current rejection suggests a high-probability shorting opportunity from this region, provided confirmation on the lower timeframes.
Trading Plan:
Entry Strategy: Await confirmation at the current H4 resistance for short entries.
Targets: First target is the H4 liquidity pool located at discount prices. The longer-term objective is the weekly liquidity pool, which represents the primary draw on liquidity.
Continue to monitor price action closely, maintain patience for confirmation, and manage risk according to your trading plan.
Kind Regards,
The Architect 🏛️📉
July 6, 2025: Strategic Forex Weekly OutlookWelcome back, traders!
In today’s video, we’ll be conducting a Forex Weekly Outlook, analyzing multiple currency pairs from a top-down perspective—starting from the higher timeframes and working our way down to the lower timeframes.
Our focus will be on identifying high-probability price action scenarios using clear market structure, institutional order flow, and key confirmation levels. This detailed breakdown is designed to give you a strategic edge and help you navigate this week’s trading opportunities with confidence.
📊 What to Expect in This Video:
Higher timeframe trend analysis
Key zones of interest and potential setups
High-precision confirmations on lower timeframes
Institutional insight into where price is likely to go next
Stay tuned, take notes, and be sure to like, comment, and subscribe so you don’t miss future trading insights!
Have a great week ahead, God bless you!
The Architect 🏛️📉
