XRPUSD Daily Breakdown Sat.Mar.12.2022Please like and comment as it pushes me to keep creating content on pairs and my bias on it :) -This is merely MY outlook and not advice on what YOU should do just my opinion on what I see - yonsfx
Multitimeframeanalysis

XRPUSD Daily Breakdown Fri.Mar.11.2022Please like and comment as it pushes me to keep creating content on pairs and my bias on it :) -This is merely MY outlook and not advice on what YOU should do just my opinion on what I see - yonsfx

XRPUSD Daily Breakdown Thurs.Mar.10.2022Please like and comment as it pushes me to keep creating content on pairs and my bias on it :) -This is merely MY outlook and not advice on what YOU should do just my opinion on what I see - yonsfx

XRPUSD Daily Breakdown Wed.Mar.9.2022Please like and comment as it pushes me to keep creating content on pairs and my bias on it :) -This is merely MY outlook and not advice on what YOU should do just my opinion on what I see - yonsfx

Litecoin will copy 2018-2020's cycleHey guys.
As you can see on the Litecoin charts in the past, a noticeable ABC correction wave is visible. If we take the similarity ratios of 1.375:1 (490D & 357D) and apply it to the current cycle, we can determine the next local top. 70 Days * 1.37 = 96 Days from the C bottom correction wave. These numbers are from the May-July correction, based on the 2018-202 cycle, we can mirror that and possibly find a top. Expect in June for Litecoin to hit around $300-400.
Safe Trading,
-Pulkanator

XRPUSD Daily Breakdown Tues.Mar.8.2022Please like and comment as it pushes me to keep creating content on pairs and my bias on it :) -This is merely MY outlook and not advice on what YOU should do just my opinion on what I see - yonsfx

XRPUSD Daily Breakdown Mon.Mar.7.2022Please like and comment as it pushes me to keep creating content on pairs and my bias on it :) -This is merely MY outlook and not advice on what YOU should do just my opinion on what I see - yonsfx

WEEKLY FOREX OUTLOOK SUN.MAR.6.2022 - FRI.MAR.11.2022Please like and comment as it pushes me to keep creating content on pairs and my bias on it :) -This is merely MY outlook and not advice on what YOU should do just my opinion on what I see - yonsfx

XRPUSD Daily Breakdown Sun.Mar.6.2022Please like and comment as it pushes me to keep creating content on pairs and my bias on it :) -This is merely MY outlook and not advice on what YOU should do just my opinion on what I see - yonsfx

XRPUSD Daily Breakdown Sat.Mar.5.2022Please like and comment as it pushes me to keep creating content on pairs and my bias on it :) -This is merely MY outlook and not advice on what YOU should do just my opinion on what I see - yonsfx

XRPUSD Daily Breakdown Fri.Mar.4.2022Please like and comment as it pushes me to keep creating content on pairs and my bias on it :) -This is merely MY outlook and not advice on what YOU should do just my opinion on what I see - yonsfx

XRPUSD Daily Breakdown Thurs.Mar.3.2022Please like and comment as it pushes me to keep creating content on pairs and my bias on it :) -This is merely MY outlook and not advice on what YOU should do just my opinion on what I see - yonsfx

ETHUSD Pitchfork Projection and Prediction March - AprilAnchored at A: 24 Jan, B: 10 Feb and C: 24 Feb's pivots.
After forming a double bottom at point C, 28 Feb's bullish engulfing closed above the median line, so I marked the 50% level between point B + C to mark the validity level of my trading idea.
I am anticipating a push into the 3.4k area mid march before seeing a minor retracement back down to around 3k where the 23.6% Fibonacci level is sitting.
A bullish daily close above 3k, and a break of the lower pitchfork's upper median line would initiate a bull run into the next strong resistance which I have identified at around 4k.
The fixed market profile tool shows me that there is a lot of volume at this area and the cross between the projected pitchfork's median line and this level creates an interesting zone of price which I predict to be reached any time from late March to early April.
I have attached a link to today's intraday chart with a 60 period SMMA where an ascending triangle is forming.
If this chart pattern is confirmed and we stay above this average, it will initiate my trading idea until we close/crash below the 50% Fibonacci level I have marked.

XRPUSD Daily Breakdown Wed.Mar.2.2022Please like and comment as it pushes me to keep creating content on pairs and my bias on it :) -This is merely MY outlook and not advice on what YOU should do just my opinion on what I see - yonsfx

Market is offering a good RR Short // NY Reversal?Cycle analysis suggests good risk:reward shorts. So I'm going to be looking for an entry up here with 20m (14) Atr as the stop loss, just beyond it

XRPUSD Daily Breakdown Tues.Mar.1.2022Please like and comment as it pushes me to keep creating content on pairs and my bias on it :) -This is merely MY outlook and not advice on what YOU should do just my opinion on what I see - yonsfx

XRPUSD Daily Breakdown Mon.Feb.28.2022Please like and comment as it pushes me to keep creating content on pairs and my bias on it :) -This is merely MY outlook and not advice on what YOU should do just my opinion on what I see - yonsfx

WEEKLY FOREX OUTLOOK SUN.FEB.27.2022 - FRI.MAR.4.2022Please like and comment as it pushes me to keep creating content on pairs and my bias on it :) -This is merely MY outlook and not advice on what YOU should do just my opinion on what I see - yonsfx

XRPUSD Daily Breakdown Sun.Feb.27.2022Please like and comment as it pushes me to keep creating content on pairs and my bias on it :) -This is merely MY outlook and not advice on what YOU should do just my opinion on what I see - yonsfx

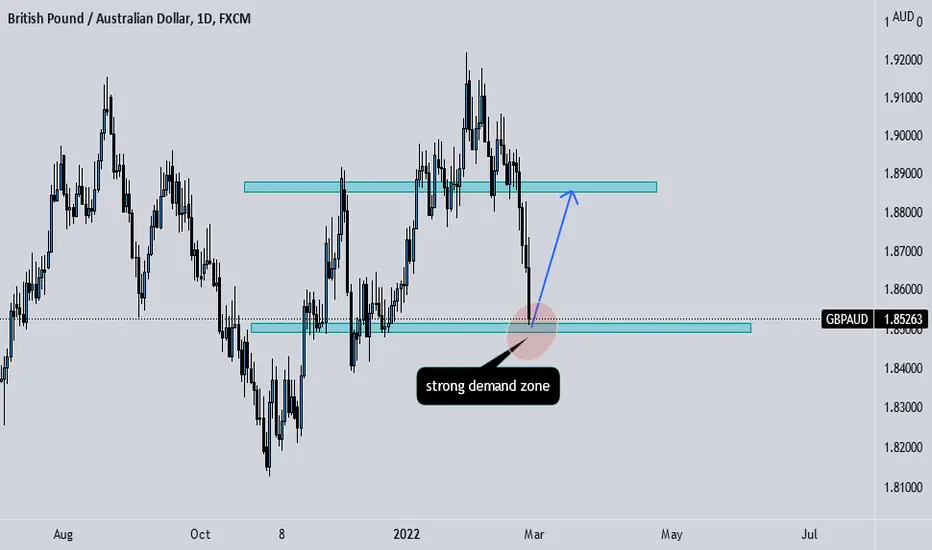
GA ready for going up?currently price is at very strong support zone and it could led to price going up
XRPUSD Daily Breakdown Sat.Feb.26.2022Please like and comment as it pushes me to keep creating content on pairs and my bias on it :) -This is merely MY outlook and not advice on what YOU should do just my opinion on what I see - yonsfx

USDJPY Analysis & Trade IdeaPrice is in an uptrend on the HTFs, but is bearish on the 15M. This bearishness may be short term, as price is potentially making a HL.
The possible pivot points are our marked POIs, where I will look to enter long.
No confirmation, no trade. I need to see price shift from bearish to bullish momentum before any long entry.

XRPUSD Daily Breakdown Fri.Feb.25.2022Please like and comment as it pushes me to keep creating content on pairs and my bias on it :) -This is merely MY outlook and not advice on what YOU should do just my opinion on what I see - yonsfx
