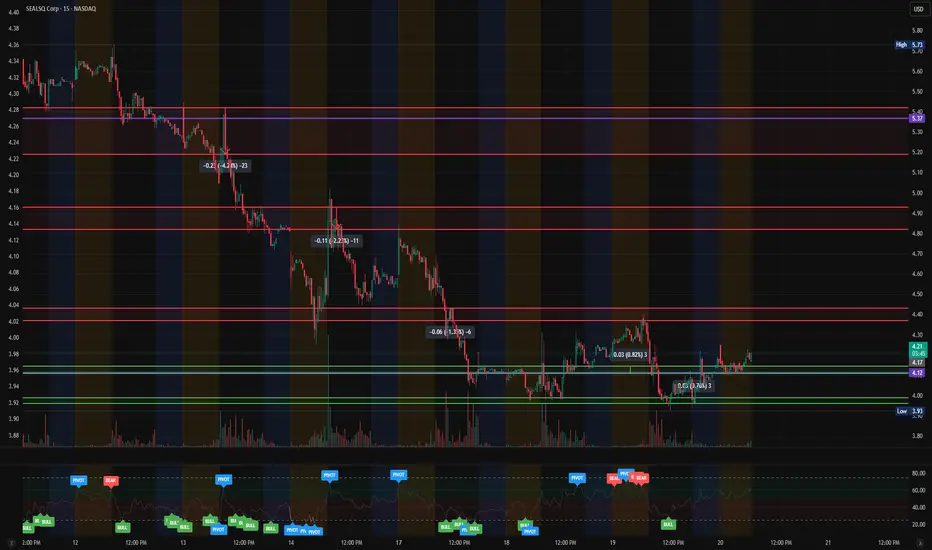
$LAES — Watching for a Reversal Attempt After Finding Bid SupporNASDAQ:LAES has been in a controlled downtrend over the past several sessions, but today’s early movement shows the first signs of stabilization. Price has now tested the $4.12 demand zone multiple times and continues to hold, creating a potential short-term base for a bounce attempt.
This level has acted as the intraday pivot between continuation and reversal — and the more it’s defended, the more likely we get a push back toward the overhead red resistance bands.
Today’s price action is showing small but consistent higher lows on the 15-minute chart, signaling early accumulation.
📊 Technical Overview
Support Levels: $4.12 → $3.93 → $3.88
Resistance Levels: $4.17 → $4.26 → $4.40 → $4.73
Structure: Micro downtrend → flattening momentum → possible short-term base
Momentum: Early intraday bullish signals printed on the RSI with small bullish divergence
Trend Bias: Neutral → modestly bullish above $4.12
Price has not yet broken the larger red zone overhead, meaning buyers still need confirmation before momentum fully shifts.
📈 What to Watch Next
1️⃣ Reclaim of $4.26
This is the first meaningful trigger that would flip intraday momentum bullish.
A break above $4.26 opens the door to a move into:
$4.40
$4.73
And potentially the $5.17–$5.40 zone (major prior liquidity pocket)
This entire area is stacked with prior sell orders — if volume comes in, it can accelerate quickly.
2️⃣ Holding $4.12 Support
This is the key to maintaining the current structure.
A close below $4.12 risks:
A drop into $3.93
And the final support at $3.88
Below $3.88, the chart re-enters the deeper breakdown zone.
For now, buyers are defending this level well.
💡 My Plan
Reversal Entry: $4.17 → $4.22 on higher-low confirmation
Breakout Entry: $4.27+ on volume
Targets: $4.40 → $4.73
Stretch Target: $5.17 / $5.40
Invalidation: Breakdown below $4.12 → back into bearish continuation
This chart is still early in the reversal formation — but if the $4.12 base holds, momentum traders will start stepping in.
🔥 Final Thoughts
NASDAQ:LAES is showing its first signs of stabilization after a multi-session sell cycle.
Now all eyes are on whether it can reclaim $4.26 to flip momentum.
Do you see NASDAQ:LAES attempting a reversal here — or does it need one more pullback before liftoff?
Drop your thoughts ⬇️ and I’ll post the updated chart with new levels.
NASDAQ:WKEY $LAESQ
Mymiwallet
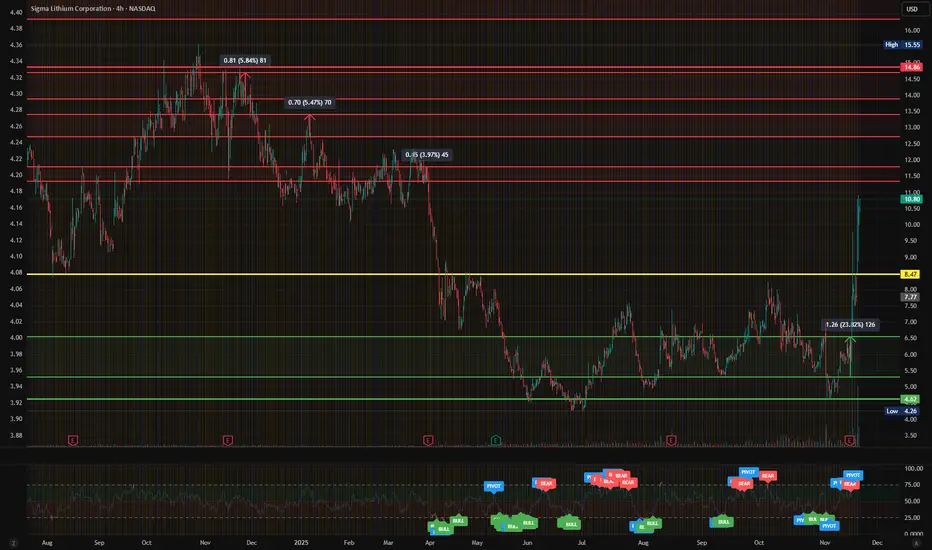
$SGML - Massive Lithium Surge! Momentum Targets $14.86 Next?NASDAQ:SGML has exploded through multiple resistance zones this week — breaking cleanly above $8.47 and extending into the $10.80 range with a massive +23% daily move.
This breakout comes after months of consolidation in the $5–$7 zone and now positions Sigma Lithium for potential continuation toward $14.86, a key structural resistance from late 2024.
The chart shows strong momentum and volume confirmation — a classic signal of accumulation turning into expansion.
Technical Overview
Support Levels: $8.47 → $7.50 → $6.20
-
Resistance Levels: $10.80 → $11.50 → $14.86
-
Structure: Long-term downtrend break confirmed; now trending inside a bullish expansion channel
Momentum: RSI at breakout threshold, rising fast; volume at multi-month highs
-
Trend Bias: Strongly bullish above $8.47
As long as NASDAQ:SGML holds above $8.47, this structure remains intact with upside potential toward the $14–$15 zone. A retest and continuation could confirm a full reversal pattern after a prolonged accumulation base.
Sector Context
Lithium names have surged across the board as investors re-enter the EV materials trade.
Sigma Lithium ( NASDAQ:SGML ) remains one of the key pure-play lithium producers with strategic exposure to Brazil’s Grota do Cirilo project — a critical supply source for sustainable battery-grade lithium.
This move aligns with broader sector recovery momentum seen in LSE:LTHM , NYSE:ALB , and $PLL.
💡 My Plan
Entry Zone: Retest near $9.00–$9.50
Targets: $11.50 → $14.86
Stretch Target: $15.55 (measured breakout projection)
Invalidation: Close below $8.47 = failed breakout / back to range
Momentum-based entries should focus on volume follow-through; early bulls are already sitting on triple-digit short-term gains.
NASDAQ:SGML just delivered a massive breakout from its long-term base 🚀
Do you think lithium stocks are back in play for 2026 — or is this a short squeeze before a fade?
Drop your thoughts ⬇️ and I’ll post a MyMI follow-up update with new price targets 📈
#SGML #Lithium #EV #GreenEnergy #Stocks #MyMIWallet #TradeAlerts NYSE:ALB LSE:LTHM GETTEX:PLL NASDAQ:TSLA
Follow for more real-time setups and weekly trade insights.
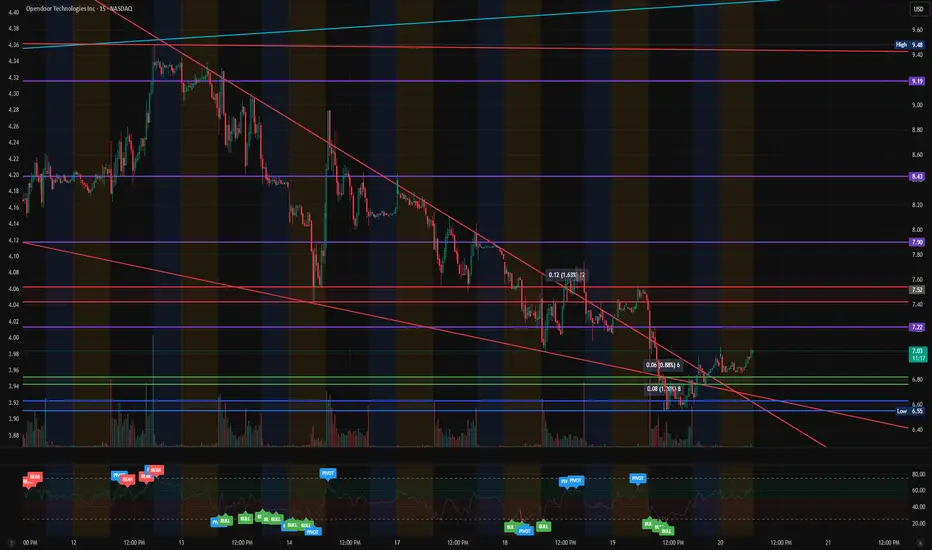
$OPEN – Breakdown + Reversal WatchNASDAQ:OPEN is showing the first meaningful signs of a potential trend reversal after weeks of controlled selling. Price has finally pushed back above the micro-range and is attempting to reclaim the $7.00 zone, which marks the beginning of a structural pivot on the 15-minute chart.
We’ve now seen a Break of Structure (BOS), early CHoCH signals, rising volume, and the EMAs beginning to curl upward — all classic signatures of a bearish cycle ending and a bullish cycle beginning.
If buyers continue stepping in, this move has room to expand.
Technical Overview
Support Levels:
$6.70
$6.55 (major demand + must hold)
$6.40
Resistance Levels:
$7.22 (first reaction level)
$7.52 (EMA cluster + supply zone)
$7.90 (strong high)
$8.43
$9.19
$9.48 (full structure flip level)
Structure:
Multi-day downtrend channel still intact, but breaking
Fresh BOS + multiple CHoCH signals
EMAs compressing and curling upwards
Micro higher-low formed at $6.55
Momentum:
RSI rising from oversold levels
Volume rotation from distribution → accumulation
Buyers stepping in aggressively at the lows
Trend Bias:
Bullish above $7.00
Strongly bullish above $7.22
As long as NASDAQ:OPEN holds above $6.55, this reversal structure remains valid.
A confirmed breakout above $7.22 opens the door to $7.52 → $7.90 → $8.43, with broader reversal potential toward $9.19–$9.48.
A breakdown below $6.55 invalidates the setup.
Sector Context
Opendoor continues to trade as a high-beta real estate tech play with strong correlation to mortgage rate volatility and risk-on sentiment. When risk rotates back into mid-cap growth, NASDAQ:OPEN historically shows outsized percentage moves — which aligns with the early reversal signals showing up on the chart now.
💡 My Plan
Entry Zone: $6.70–$7.05 (only on strength)
Targets: $7.52 → $7.90 → $8.43
Stretch Target: $9.19 → $9.48
Invalidation: Close below $6.55
NASDAQ:OPEN is showing early reversal behavior after a prolonged down move. If buyers maintain control above $7.00, this could be the beginning of a larger trend shift into December.
Drop your thoughts ⬇️ and I’ll post a MyMI follow-up with updated price targets. NASDAQ:PLTR NASDAQ:SOFI $Z NYSE:CVNA
$NUVB – Major Breakout! Watching for Continuation Toward $10.45NYSE:NUVB just delivered one of its biggest breakout moves of the year — ripping from the mid-$3 range into the $7s in a single vertical expansion candle.
This move cleared months of consolidation and broke straight through multiple resistance layers, signaling a major shift in momentum. With volume spiking to near multi-year highs, NYSE:NUVB is now setting up for potential continuation into the next structural targets above.
The chart now sits above all local supply zones — the first time since early 2022 — suggesting this breakout may have legs if bulls maintain control.
📊 Technical Overview
Support Levels: $5.35 → $4.75 → $4.05
Resistance Levels: $7.15 (current) → $8.50 → $10.45 (multi-year high)
Structure: Long-term base breakout after multi-year downtrend & accumulation
Momentum: RSI extended but trending strongly; breakout volume highest in years
Trend Bias: Ultra-bullish above $5.35
As long as NYSE:NUVB holds above $5.35, this breakout remains valid. A controlled pullback or sideways consolidation would be healthy after such an aggressive extension move.
A measured-move extension points toward $8.50, with potential continuation into the $10.45 zone — the major pivot high from the prior cycle.
🧬 Sector & Fundamental Context
Nuvation Bio operates in the oncology biotech space — a sector known for explosive multi-day moves following catalysts, early-stage trial updates, or institutional rotation.
While NYSE:NUVB has traded sideways for nearly two years, this breakout aligns with increasing volume patterns across small-cap biotech names such as NASDAQ:SLS , NASDAQ:TCRT , and OTC:VCNX — suggesting early-phase capital rotation is returning to the sector.
Biotech breakouts of this scale often move in multi-wave sequences when supported by volume.
💡 My Plan
Entry Zone: Ideally on a pullback toward $5.80–$6.25
Targets: $8.50 → $10.45
Stretch Target: $11.00+ if volume remains elevated
Invalidation: Close below $4.75 = failed breakout + reversion to range
Look for declining-volume pullbacks or flag formations to confirm continuation. Higher lows on the 4H/1D will signal readiness for a second expansion leg.
NYSE:NUVB just printed one of the cleanest biotech breakouts on the market 🚀
Do you think it continues toward $10 — or does it need a deeper pullback first?
Drop your thoughts ⬇️
I’ll post the next MyMI continuation update if the $8.50 level breaks 📈
AMEX:XBI NASDAQ:TCRT NASDAQ:SLS OTC:VCNX

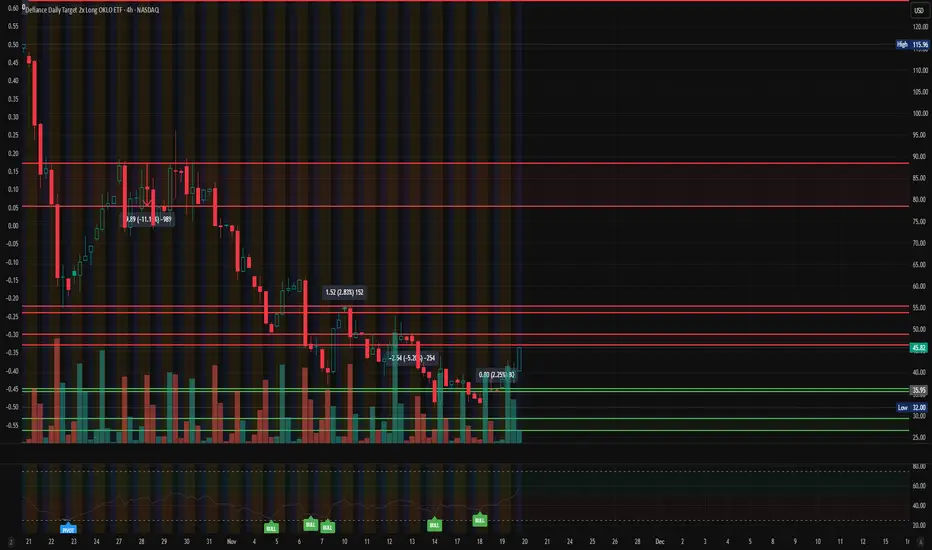
$OKLO – Watching for a Confirmed Breakout Back Toward $48NYSE:OKLO (Defiance Daily Target 2x Long OKLO ETF) just printed a strong +13.47% bounce off the lower accumulation zone near $35.95, making this the first real momentum shift after multiple weeks of controlled sell-off.
This ETF has been grinding in a tight compression range while forming a potential short-term base — and today’s volume spike signals early interest returning right at a key demand zone.
Price is now pushing back toward the major mid-range resistance near $48, which has acted as a heavy rejection area throughout November.
A breakout here decides everything.
📊 Technical Overview
Support Levels: $45.82 → $35.95 → $32.00
Resistance Levels: $48.00 → $52.50 → $56.00
Structure: Multi-week downtrend → transitioning into sideways accumulation
Momentum: A series of bullish signals on the lower timeframes; early reversal behavior forming
Trend Bias: Neutral → turning bullish on a break and hold above $48
Price is still beneath the major red resistance band on the chart — meaning any breakout should be accompanied by strong volume confirmation.
📈 What Matters Next
Two main things decide the next major move for NYSE:OKLO :
1️⃣ Break Above $48.00
This level is the make-or-break pivot for a reversal.
A close above $48 opens a fast move toward:
$52.50
$56.00
And potentially a larger push toward the $70–$88 zone if momentum continues
Leveraged ETFs tend to move dramatically once key levels break.
2️⃣ Failure at $48 → Back to Range
A rejection sends price back toward:
$45.82 support
$35.95 (mid-base)
$32.00 (full reset level)
Buyers absolutely need $35.95 to continue holding to maintain this reversal structure.
💡 My Plan
Breakout Entry: $48.10+ with rising volume
Retest Entry: $45.82 → $46.20 zone
Targets: $52.50 → $56.00
Stretch Target: $88.00
Invalidation: Close below $35.95
This ETF is nearing the exact level where previous downside momentum broke — meaning if bulls reclaim it, the entire short-term trend flips.
🔥 Final Thoughts
NYSE:OKLO just posted its strongest intraday momentum in weeks.
If it clears the $48 level, we enter a completely different phase of the chart.
Do you think NYSE:OKLO has enough strength to push through resistance — or do we get one more rejection?
Drop your thoughts ⬇️ and I’ll post the follow-up breakout chart.
AMEX:SPY NASDAQ:QQQ NYSE:OKLO
$NBIS – Massive Reversal Setup! Watching the $48.64 Zone for a CNASDAQ:NBIS has finally rebounded off its $28.68 low, delivering a sharp recovery move back toward the key mid-range zone near $47.39.
For weeks, this ETF has been trading under heavy pressure, but the recent surge in volume suggests early accumulation and a potential shift in trend momentum.
Price is now approaching a major confluence zone:
Long-term descending resistance (red trendline)
Long-term ascending support (green trendline)
Horizontal structural level (yellow) around $48.64
This intersection typically produces large direction-defining moves, making the next few sessions extremely important.
📊 Technical Overview
Support Levels: $47.39 → $36.72 → $28.68
Resistance Levels: $48.64 → $56.00 → $64.00
Structure: Squeezing between descending macro trendline & rising support
Momentum: First strong bullish pivot in weeks; volume spike confirms renewed interest
Trend Bias: Bullish above $47.39, neutral-to-bearish below that
A clean breakout above $48.64 would confirm a trend reversal and open the path toward the $56–$64 range.
This ETF has historically produced aggressive expansions after breaking key compression points like this one.
📈 Market Context
NASDAQ:NBIS tracks 2X leveraged exposure to NBIS — and leveraged ETFs often lead broader sector rotation signals.
When trendlines converge this tightly, algo-driven volatility frequently takes over, meaning:
Traders should watch for a surge in volume
A breakout candle often runs much farther than expected
Failed breakouts typically retrace to the lower trendline quickly
Macro conditions in related sectors (biotech, health innovation indices) have begun stabilizing, increasing the probability of bullish continuation.
💡 My Plan
Entry Zone: On breakout above $48.64 or retest of $47.39
Targets: $56.00 → $64.00
Stretch Target: $98.48 (long-term range expansion target)
Invalidation: Close below $36.72 = bearish continuation likely
Aggressive rotation plays like this often run fastest when the market least expects it — and NASDAQ:NBIS is approaching the most critical level of its entire 2024–2026 structure.
NASDAQ:NBIS is sitting right at a compression apex — breakouts from this pattern typically turn into massive moves 🚀
Do you think we blast through $48.64 or get rejected at the trendline?
Drop your thoughts ⬇️
I’ll post the breakout confirmation update once we get the move 📈
AMEX:XBI AMEX:LABU AMEX:SPY

$ANNX – Massive Breakout! Former Downtrend Broken With Eyes on $NASDAQ:ANNX just printed one of its strongest breakout candles of 2025 — surging from the $3s into the $4.00+ range on explosive volume.
This move breaks a multi-month descending structure that has held Annexon down since late 2023, officially flipping the market structure bullish.
After over a year of accumulation between $2.00–$3.25, NASDAQ:ANNX is now targeting higher levels as buyers step in aggressively across all timeframes.
📊 Technical Overview
Support Levels: $3.55 → $3.25 → $2.75
Resistance Levels: $4.12 → $5.00 → $5.50
Structure: Higher-high + breakout above Ichimoku cloud + full downtrend violation
Momentum: RSI ripping into bullish expansion; volume at multi-month highs
Trend Bias: Strongly bullish above $3.55
A clean continuation above $4.12 confirms the breakout and opens the path toward the $5.00–$5.50 prior supply zone.
If buyers maintain control, this could be the first leg of a larger biotech momentum sequence.
🧪 Sector Context
Annexon ( NASDAQ:ANNX ) operates in the neuro-immunology biotech space — a sector known for abrupt trend changes following clinical updates, FDA milestones, or institutional rotations.
Small-cap biotech names across the board ( NASDAQ:TCRT , NASDAQ:SANA , OTC:VCNX , NASDAQ:MRSN ) have shown renewed momentum this quarter, signaling a potential sector rotation into undervalued clinical-stage companies.
NASDAQ:ANNX spent over 12 months building a base — moves like today typically occur before catalysts become public.
💡 My Plan
Entry Zone: $3.60–$3.85 on pullbacks
Targets: $4.50 → $5.00 → $5.50
Stretch Target: $7.85 (measured move from macro range breakout)
Invalidation: Close below $3.25 = failed breakout → back to accumulation range
The ideal scenario is a small pullback into the 8EMA / 20EMA on the daily chart before the next leg up.
NASDAQ:ANNX just broke a year-long downtrend with huge volume — the big question now is:
Does it push into the $5.00–$5.50 zone next, or does it consolidate first?
Drop your thoughts ⬇️
I’ll post the continuation update if NASDAQ:ANNX clears $4.12 with strength 📈
AMEX:XBI NASDAQ:TCRT OTC:VCNX NASDAQ:MRSN

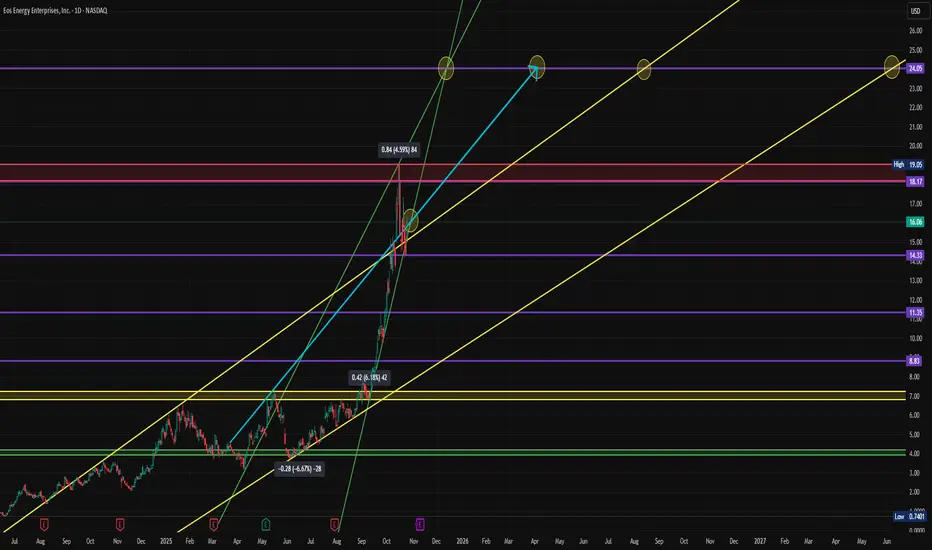
$EOSE - Next Move Above $18 or Pullback Reload to $14?NASDAQ:EOSE (Eos Energy Enterprises) has been a quiet outperformer this year — rising from $0.42 lows to a recent high near $18.17 (+4,000% YTD).
After a massive rally, price is now consolidating above $14.33 support while eyeing resistance near $19.05 and the next projection zone at $24.05 based on trend channel extensions (see chart).
🧩 Technical Breakdown
📈 Primary uptrend intact — higher highs / higher lows since May 2025.
🟡 Support: $14.33 (major structural level), $11.35 secondary, $8.83 extended.
🔵 Resistance: $18.17 then $19.05 (high confluence).
🎯 Upside targets: $24.05 and $26 via Fib 1:1 extension.
⚠️ Risk zone: Break below $14.00 could invite a pullback toward the 11–9 region before the next leg up.
📊 Fundamental Context
Recent catalysts keep bulls interested despite volatility:
Guggenheim raised its price target from $10 to $20 (maintaining a Buy rating).
$24 million economic development package awarded by Pennsylvania & Allegheny County for U.S. manufacturing expansion.
Multi-year partnership with Unico to launch ultra-compact power conversion products for domestic LDES systems.
📉 Counter-Sentiment Data (From Schwab QORE Analytics)
Schwab currently rates EOSE as F (Strongly Underperform) with High volatility — a classic contrarian setup that often precedes sharp re-ratings once earnings stabilize (next report expected week of Nov 4).
Momentum metrics show +41.4% over 4 weeks and +209.9% over 26 weeks — this is not a quiet chart.
💡 My Plan
Looking for entries around $14.33 support with a tight stop below $14.00. If stopped out, I’ll wait for accumulation in the $11–9 zone for a lower-risk swing position into Q4/Q1 ’26.
Above $19 opens the door to $24+ in the coming months if the manufacturing story keeps momentum.
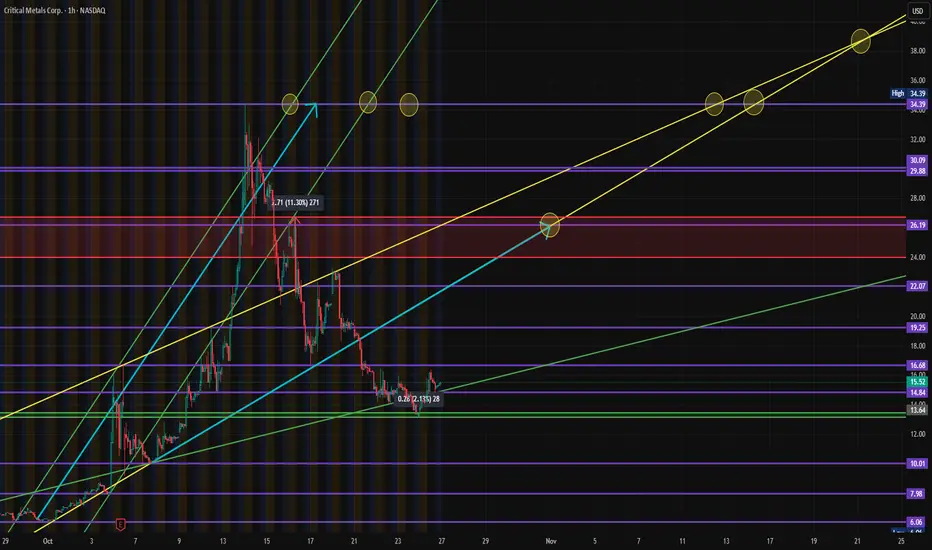
$CRML - Critical Metals - $16.08 Breakout | $26.19 RetestNASDAQ:CRML has been one of the most explosive rare-earth plays of 2025 — rallying from the single digits to a 52-week high of $34.39 before pulling back sharply to consolidate around the $13.64 support zone.
After cooling off from that massive run, price action has now begun compressing between $13.64 and $16.08, with early signs of base-building before another potential leg up.
🧩 Technical Outlook
Strong rally → deep correction → accumulation structure forming.
Support Levels: $13.64 (core zone), $10.01 (strong confluence), and $7.98 (long-term floor).
Resistance Zones: $19.25 → $22.07 → $26.19.
Channel projection shows potential for re-test of $26.19 by November if current momentum continues.
Higher timeframe targets extend to $30.09 and $34.39 in Q1 2026 if the bullish structure holds.
The setup favors accumulation entries below $16.08, with a short-term target to retest $22.07 and potentially $26.19 once momentum returns.
📰 Recent News & Fundamentals
Critical Metals shares have been volatile following major financing announcements:
📉 Announced offering of 18.03 million shares triggered a short-term selloff.
💰 Confirmed $50 million PIPE financing, strengthening capital for expansion.
🌍 Broader rare-earth momentum continues as China tightens export restrictions and JPMorgan initiates new investments into critical mineral supply chains.
Despite the correction, the sector tailwinds remain strong — and NASDAQ:CRML ’s European lithium and rare-earth projects (Tanbreez and Wolfsberg) position it strategically for the energy transition theme dominating the next decade.
📊 Sentiment Snapshot (from Schwab QORE Analytics)
Rating: F (Strongly Underperform) – percentile rank 100
26-week price change: +834%
Beta: 1.14
Sector: Materials / Diversified Metals & Mining
High volatility + weak sentiment ratings often precede large technical reversals — a setup that speculative traders should be watching closely.
💡 My Plan
I’m watching for clean accumulation below $16.08 for a potential re-entry swing trade.
Stop: under $13.50
Targets: $22.07 → $26.19 (swing)
Longer-term projections: $30 → $34 if the bullish trend resumes into 2026.
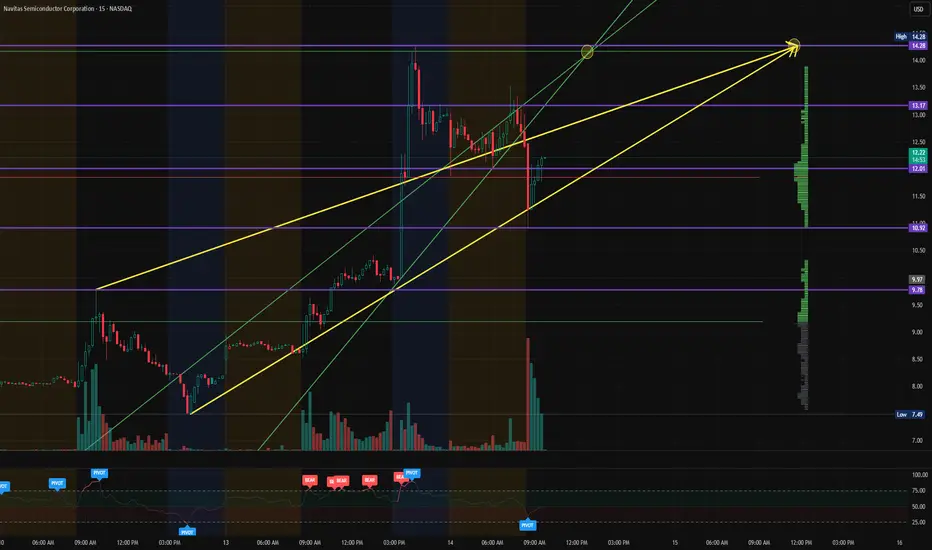
$NVTS - Navitas Semiconductor - $14.28 RetestNASDAQ:NVTS broke out on Friday to $5.78 before pushing up to $14.28 in yesterday's After-Hours. It consolidated to $10.92 before pushing back forward. We're looking for a Continuation to retest $14.28.
$DFLI - Dragonfly Energy - $2.26Entered NASDAQ:DFLI at $1.53 after seeing Volume Spikes and Push to break the $1.58 Price Levels. We are looking to the reaction at $1.64 with a $2.26 PT

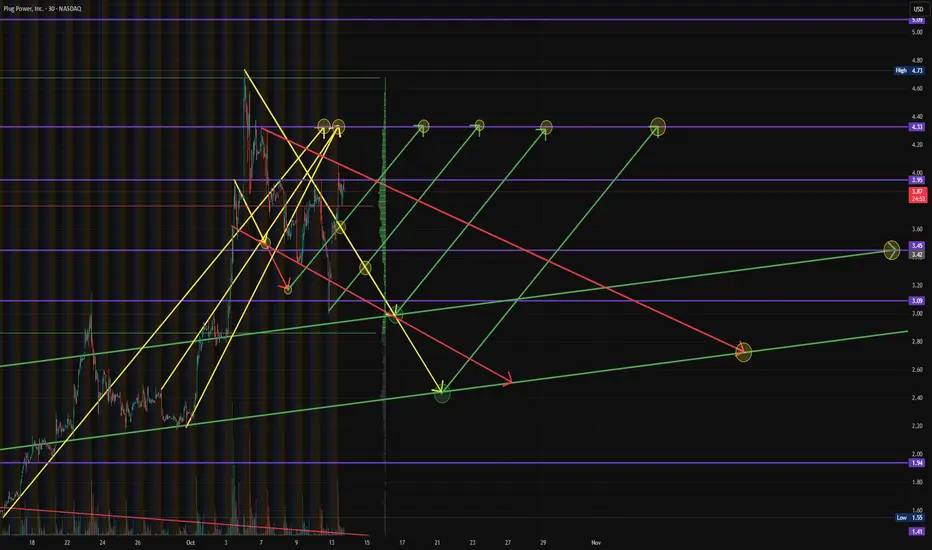
$PLUG - Plug Power - $4.33 PTNASDAQ:PLUG consolidated to chart the $3.09 and found support like we initially targeted and rebounded to $3.95 before showing potential consolidation for additional entries.
Still holding a $4.31 RT to breakout to that $5.09 PT will potentially providing re-entry at $3.45 if it does consolidate again first.
$ELBM - Electra Battery Materials - $10.16 RT?NASDAQ:ELBM broke out in this morning's Pre-Market after China's Commerce Ministry announced that all foreign countries are required to gain approval to export certain products, including rare-earth materials, as well as licensing to export specific lithium batteries.
We're watching as volume consolidates going into Mid-Market for the day, to find our next potential entry points, but depending on the length of these new Chinese Export Requirements, NASDAQ:ELBM and others in the sector could benefit.
NASDAQ:ELBM found support on the $5.82 while retesting this $6.08 previous level of resistance, which we expect another level to be around the $6.84 before a potential $10.16 Retest.
#MyMIWallet

After-Market Analysis: VITL Rebound to the Upside??VITL - Vital Farms is positioned in a very strong support level, looking for an entry between $31.40 and its current price ($35.40 as of this MyMI Trade Analysis). Looking for resistance around the $41.54 Price Level, so a potential exit there before seeing a continuation to that $44.54 Price Target over the next 2-3 months placing our Stop Loss around $32.04 if this trade fades out on us before we see that same move higher, just at a later date.
Stay connected for more by visiting our website in our signature for more Premium Tools & Investment Resources to master your trade and Financials at @MyMIWallet.

MyMI Apex Trader Funding - ES Short Trade on Market OpenWe're looking for a resistance pullback at the lower support level before we can break higher here. We're seeing the formation of an Ascending Triangle which also suggests a more bearish move lower even to retest $5,822 again before truly pushing higher.
Stay tuned for more!
Links in the signature!

TSLA - MyMI Option Plays - CALLsAfter finding support for the $242.76 Price Level which was support before TSLAs most recent run back to $299.
Looking for this to at least retest the 50% Retracement Level that was formed from the June 28 to July 1st original breakout.
The 50% played support for a majority of the end of July before TSLA broke Aug 1. I look to retest that 50% retracement and from there would expect continued downward pressure unless more financial/economic momentum can push it out of the Downward Channel that TSLA confirmed back on Aug 24th which also falls around the $265 Price Levels.
We purchased TSLA $265 09/15/2023 CALLS this morning for around $246. We purchased it prematurely as TSLA hit session lows of $242.76 missing the opportunity to purchase these options at a higher discount.

NVDA - MyMI Options - CallsAfter confirming NVDA did indeed not only hold above those $457-8s today for the 2nd time and then breaking back into that higher level channel, I have purchased some Calls for either a $480 retest at the top of it's upper channel again to ultimately settle in that channel moving forward.
Stay tuned for more!

ETH - MyMI Trade Analysis - NeutralAs ETH & BTC see a fresh retest of Key Resistance, I'm still watching to see how it reacts to $2031 before I go green.
Pending further reactions at these price levels.

NVDA - MyMI Option Plays - CallsNVDA has outperformed outperformance in it's definition. This Titan has broken into a higher price range channel (top level of the orange channels) and is showing the potential to be headed back to $500. The most recent breakout in this week's trading sessions shows that there is still money on the sideline waiting to be injected in the markets and that we have much higher to go.
This has taken us bullish in all of our current open trades. We are not currently in NVDA but we are patiently awaiting a re-entry that's a little more favorable for a longer-term call option and share hold.

TSLA - MyMI Option Plays - July CallsThis morning's CPI numbers sent most stocks up fairly nicely this morning. TSLA being one of those in which we were looking for a support breakdown potentially if those CPI numbers were at least more than expected.
I'm happy with the CPI Numbers, if the markets are, so we are following suit with Calls going into September Fed Decision.

TSLA - MyMI Option Plays - PUTsI purchased some PUTs this morning as I expect TSLA to rebound back to at least the $268s or $264s for an excellent $12-$16 Puts Catch on the Drop.
I am sharing this to track the trade!
Stay tuned for updates and for more trades, be sure to follow!
Thank you all for the support, our numbers have been pretty phenomenal and we want to show our appreciation by continuing to share our ideas with you all!
Check your bio for links to get even more connected! Use our Financial Budgeting and Investment Manager to improve your trades and follow ours even closer!
Thank you guys/gals!

DPZ - MyMI Option Plays - CallsAfter announcing their partnership with UberEats and others, we had an explosive breakout this morning to $409.47 this morning, breaking above the $394.99 Level of Resistance before pulling back below and hitting the 50% Retracement Level ($378.50) before starting to retest that $394 Level.
I'm looking for a potential $419 retest at least, if not higher those $443 Levels of Resistance that never became support.
While showing a longer timeframe to show all Fib Retracement Levels that we're watching.

NVDA - MyMI Option Plays - PUTsJust purchased some NVDA PUTs after it lose movement from this mornings push upward. I was seeing if it would cross that $430 Fib Retracement Level but it didn't even make it that far before showing signs of moment loss (for the moment).
So in that moment, I will be looking to snatch some profits going backward for a bit, potentially back to the $400s.
50% Retracement would show $390 but I'm being gracious with the $400 target for now.
