nasdaq falltoday as seen in the chart.
we tested the bottom of the range and wherent able to move with enough energy to the upside.
in the american sesion today we dditn ake a new high.
i see weeknes in the market.
entry in blue.
target in green.
to be able to take the win you also have to be able to the loss.\
have fun
Elektra
NAS

NAS100 Buy limit orders.Looking forward to place a limit order on NAS100.
Potential trade would be 3R plus, risking 0.5% of the equity.
Limit order will be placed according to the market condition at around ·3:30 -4:00 Pm (UTC +2, timezone)

Market Forecast for Gold into $3,000Gold's consolidation phase within a rising wedge pattern illustrated market uncertainty ahead of the U.S. presidential election and broader economic factors. The price action indicated a retracement towards key support levels at 2,470 and 2,367 USD, aligning with typical market cycles that precede significant rebounds.
This phase suggested a corrective pullback within the broader uptrend, a natural part of the market cycle where consolidation and profit-taking occurred before the next rally. The pullback towards the 2,367 USD level acted as a springboard for a renewed uptrend. Seasonal trends and unforeseen geopolitical events increased gold’s safe-haven appeal, contributing to price acceleration towards the long-term target to 3,000 USD.
With the U.S. presidential election on the horizon, unclear economic policies from potential candidates contributed to market hesitation. This uncertainty often drove investors toward safe-haven assets like gold. Central banks' responses, particularly from the Federal Reserve, Bank of Japan and the European Central Bank, were critical. Interest rate adjustments, inflation controls, and currency interventions all played a role in shaping gold's trajectory. When central banks signaled that inflation was persisting, it accelerated gold’s ascent. Conversely, when inflation moderated and interest rates rose significantly, it created temporary pressure on gold prices. The retracement towards 2,470 and 2,367 USD levels offered a strategic entry point for investors looking to position themselves.
Those who took that trade made money, and I thank you for believing in this chart.

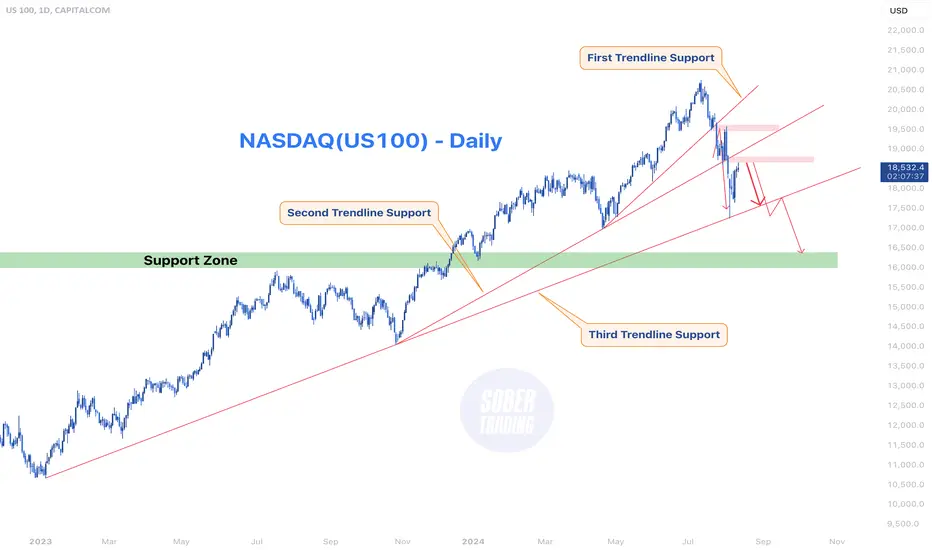
NASDAQ - US100 Facing Bearish PressureThe CAPITALCOM:US100 index is currently facing significant downward pressure, largely due to mounting concerns about the U.S. economy. The potential for a recession is growing as recent data points to an increase in unemployment claims, and the Federal Reserve has decided to delay interest rate cuts. This has created uncertainty in the markets, as higher unemployment could lead to reduced consumer spending, further exacerbating the economic slowdown. The anticipation of prolonged higher interest rates is also weighing on investor sentiment, making the stock market, particularly tech-heavy indexes like NASDAQ, more vulnerable to declines.
Technically, the BLACKBULL:NAS100 index has been following a clear pattern of reactions to its trendlines. The index recently fell and touched the third trendline support, which has historically been a critical level for determining market direction. After this touch, the index attempted a recovery, moving back towards the second trendline, which now acts as a breakeven point. However, the failure to break through this level and the subsequent rejection suggests that the bears are firmly in control. The pattern indicates that the index may face further declines, particularly if it breaches the third trendline support.
In conclusion, both fundamental and technical factors are pointing towards a bearish outlook for the NASDAQ index. The rising possibility of a recession, driven by increasing unemployment claims and the Fed’s cautious approach to rate cuts, has dampened investor sentiment. On the technical side, the index’s inability to reclaim key trendline supports indicates that more downside is likely. As a result, investors should be cautious and prepared for potential further declines in the NASDAQ index in the coming weeks.
NQ1! Critical levelsDetailed explanations are given in the chart.
Comment if you have any questions.
Thanks for reading and good trading!

US30 - 15m Scalp on DowJonesUS30 presents a sell opportunity. The price has just broken below the support zone at 39,300, indicating a potential for further downside. Keep an eye on this level for potential entries.

US30 - 15m Buy scalpThe Dow Jones Industrial Average (US30) is currently on an upward trajectory, showing strong bullish momentum on the 15-minute chart. As it continues to rise, it is approaching a key resistance zone that has previously served as a turning point. Traders should watch this level closely, as the price may test and react to this resistance, potentially leading to a breakout or a consolidation phase. This anticipated rise towards the resistance zone signals a pivotal moment for US30's short-term direction, providing opportunities for strategic entries and exits based on price action around this area.

MNQ Mid-Week Outlook 4/24Gone private but still here grinding everyday.
Im expecting a weak NQ NAS NASDAQ NAS100 whatever you want to call it.
Short story is buyside purged and HTF bearish delivery. Long story is yet to be told via lower time frame price discovery expression. My bias is to the downside.
Target is a standard deviation of the opening price projected below the open price. That's a low hanging objective if price follows this narrative, however a run lower would not surprise me.

NAS100 SellsNAS appears to have completed that indication and created new low (16980). The correction is now playing out and it came all the way back to that area of consolidation (17650 - 17850).
A drop and close below 17470 area, will give possible indication for sells, back down to 17030 area.

NAS100We were triggered and stopped out but we did fair.
DAILY
Kept falling and dragging down and tested around the support level, 17070 around here. We have a test candle which shows that our test level was correct.
4H
Price is testing again (in correction) so we stay waiting and watching for either the break (impulsively) or the reversal impulsively. This is where we will get more information to lay forward our case.
1H
Reject before 17500 is where we would believe that our correction has ended, break through here means we wait even more.

NAS SellsNAS - price broke through that last low that was created with momentum pushing past the lowest point (17790) before the highest point (18498) was reached.
That would signify a CHoCH and we are continuing a bearish outlook.
With ICC, after a new low is made in the market (Indication) we can expect a pullback/retracement (Correction), before the continuation.
We will be looking for sells under the 17880 area to the recent lows created (after the correction is completed)

NAS ShortBased off Sci's ICC trading concept. Indication - Correction - Continuation
NAS created a new low below 17900 (Indication), then corrected to 18360, which created lower low. With price failing to make a new high/ break the previous highs, sells were possible below 18175 (Continuation) to the low that was created.
Will monitor price in the new week and consider sells below 18020 to the last low, which should be about 130 points.

N1Good thing we were patient and stayed out.
Following the previous post, I had not set out an idea. This was just placed and not taken.
Now we have a better idea as to where and what to do:
We waiting for the retest on the rectangle and confirmation of bull movement before we set out our buy stops and market entries to go with the bull run.

NASDAQ Movie with bear marketNASDAQ Movie with bear market. Good movement for entering a trade with proper confirmation. Because this is 4H time frame.
Scenario 01
If nas rebound with psyological level The best way to use this opportunity is to place a Buy order at 17848
Scenario 02
If fell Bellow mentioned support nas will reach 17716. That level can get buy order.
4H Resistance level located 18053.44
4H Support level located at 17324.10

MY SECREET WEAPON STATEGY FOR SHORT TERM!Daily Markets: Investors Watching Fed Speakers Closely After Inflation Data
Following the Consumer Price Index (CPI) report that showed little progress on core inflation, the market will be dissecting comments from a pair of Fed speakers now that market expectations for rate cuts softened considerably after yesterday’s inflation data.
WARNING!
I AM NOT FOLLOW THE TREND STYLE TRADER, IM WITH MY INDICATOR TO CATCHING THE SIGNAL AND DECIDE PRICE ACTION. SO BE THE FIRST AT THE TOP OR BOTTOM.

NAS sitting on the fenceWith NVIDIA earnings due, NAS seems to be sitting on the fence in terms of direction, so I am considering all options
Feel free to comment what your thinking or what i've missed

NASDAQ DOUBLE VISIONHere is my view on the Nasdaq100.
Many possible scenarios for American technology stocks, but here are my most likely scenarios for success!
I have put my long stitch and my short bias on the market.
Happy trading everyone!

NAS100 sell order entry price 16928NAS100 Currency running with nearest the 4H pressure level 16922 - 16974
This is the best opportunity for selling the market.
According to the analyze open sell order entry price 16928 and target 16748 and 16575
SL ( Set a uniform set of 15$ ) only for your reference and you can set it according to your free margin.

NAS100 3/12/23Nas100 sitting within a bearish range following from last week or of a indices have shifted bullish I believe that NAS100 may follow. as it stands we are still within a bearish range so we are looking to trade within this range with caution but still following our swing bias as always.

$AAPL timber*This is not financial advice, so trade at your own risks*
*My team digs deep and finds stocks that are expected to perform well based off multiple confluences*
*Experienced traders understand the uphill battle in timing the market, so instead my team focuses mainly on risk management
!! This chart analysis is for reference purposes only !!
If you want to see more, please like and follow us @SimplyShowMeTheMoney

NAS100 5/11/23That's 100 looking almost exactly the same as euro and British pound the only difference is we had a much larger expansion on this pair after the red folded news on Friday. Following this price action we're looking for exactly the same thing as Gu and eu which is for us to run the internal liquid load that we have placed during the New York session of the last week and we also have a much lower unmitigated area of price which holds our poi for entry within our swing as it stands we're not going to hold our breath for a huge pullback but we are going to be looking for longs heading into this session.
Remember to always read order flow and follow what price is showing you instead of trading based on your desired direction. And, as always, stick to your risk and your plan.
We'll be closely monitoring market openings and price action throughout the week. If you find this analysis useful, let us know in the comments below and hit the boost button to show your support. Here's to a successful week of trading!

Q3 Sell Off Bias Breakdown Part 3 Simple Explanation +ScreenshotFor how most people I know trade, we have a few simple steps to follow in order to identify a good trade setup. We need to:
1. Determine current price location on our chosen higher timeframe - are we in Premium or Discount.
2. Check whether we've taken any liquidity on our selected higher timeframe.
3. If liquidity has been taken immediately, switch to your preferred lower timeframe and look for the same setup aka liquidity being taken.
4. if you've Confirmed liquidity has been taken, now you need price to follow up by a break of market structure on a short-term low or high.
5. If step 4 is completed successfully, we can now look for entry on our trade ONLY IF PRICE HAS LEFT THE FOLLOWING BEHIND!!!!
gap, order block, or breaker block.

Q3 Sell Off Bias Breakdown Part 2 Hello, in this analysis, I saw the potential for this sell-off around August 8th. I just never posted it, but I was chatting with AI to see how many months, days, weeks, or years equaled how many candles. So, I picked the 91-day timeframe because I will normally be on the right side of the trend most of the time, as that is higher than the monthly, weekly, daily, etc. in terms of higher timeframe bias. More advanced break down
PART 1 LINK:
