Nasdaq 100 Advances Ahead of Tech Giants’ EarningsNasdaq 100 Advances Ahead of Tech Giants’ Earnings
As early as tomorrow, after the close of the main trading session, quarterly results will be released by Microsoft (MSFT), Meta Platforms (META) and Tesla (TSLA), with Apple (AAPL) scheduled to report on Thursday.
As the chart shows, the Nasdaq 100 index (US Tech 100 mini on FXOpen) climbed today to its highest level since early November, rising above 25,900. Since the start of the week, the index has gained around 1.8%. This appears to reflect a shift in market sentiment:
→ Geopolitical risks are fading. Market participants seem to have adapted to the news flow surrounding tariffs and Greenland. After the initial shock, current political rhetoric is increasingly viewed as a negotiating stance rather than a genuine threat to business.
→ Confidence in market leaders. Prices are factoring in expectations that tech giants will outline roadmaps showing how their record AI spending will begin to generate net profits as early as this year.
Technical Analysis of the Nasdaq 100 Chart
Price action in the Nasdaq 100 index points to demand-side dominance:
→ the downward trajectory seen between 16 and 21 January was broken by bulls on the 22nd, with a spike in volatility (visible on the ATR indicator) highlighting a sharp change in market behaviour;
→ recent fluctuations have formed an ascending channel (shown in blue);
→ the market has confidently recovered from the bearish gap seen at the start of the week;
→ the broad bullish candle on Monday, 26 January, signals a demand imbalance, with the rally zone showing signs of support (marked by a rectangle).
From the supply-side perspective:
→ the move above the 13 January high could turn out to be a false bullish breakout (another one, judging by Nasdaq 100 price action over recent months);
→ price is currently hovering near the upper boundary of the existing channel.
A modest technical pullback in the coming days cannot be ruled out, although the key driver is likely to be market reactions to upcoming corporate earnings.
This article represents the opinion of the Companies operating under the FXOpen brand only. It is not to be construed as an offer, solicitation, or recommendation with respect to products and services provided by the Companies operating under the FXOpen brand, nor is it to be considered financial advice.
NASDAQ 100 CFD

Nasdaq — Quiet Start to the Year, But the Structure Is Building.The first month of the year was unusually quiet for the Nasdaq, with price contained inside a tight 1,000-point range, roughly 4% of value.
That calm, however, is starting to fade.
🔎 Signs of Life Since Last Week
Since last week, the index has begun to show clear bullish intent:
- a bullish engulfing candle on Wednesday
- followed by another bullish engulfing yesterday, which pushed price directly into resistance
- This sequence suggests buyers are no longer passive — they are stepping in with intent.
📐 Bigger Picture: A Clean Technical Structure
Looking at the broader context:
After the ATH at the end of October, the correction that followed stopped almost perfectly at the August ATH
From there, price began to compress higher, forming an ascending triangle on the daily chart
This is a textbook continuation pattern:
✔️ rising lows
✔️ flat resistance
✔️ tightening price action
🌍 Macro Noise Didn’t Break the Trend
Despite ongoing geopolitical tensions, the Nasdaq structure remained intact.
In fact, rather than breaking the trend, the volatility reinforced the compression, which often precedes expansion.
🎯 Outlook & Target
With such a clear technical setup and sustained structural strength, it is reasonable to expect:
➡️ a break above resistance
➡️ followed by continuation toward new ATHs
The measured move target for the ascending triangle comes in around:
🎯 27,800
That level could represent a realistic swing target for traders aligned with the trend.
✅ Conclusion
Nasdaq spent a month consolidating
With momentum returning and structure tightening, the market is positioning itself for resolution to the upside.

USNAS100 | Tech Earnings & FOMC in Focus – Key Levels AheadUSNAS100 | Key Tech Earnings & Fed Risk Keep Pressure Elevated
Nasdaq 100 futures remain under pressure as markets position cautiously ahead of a critical week dominated by mega-cap technology earnings and the Federal Reserve rate decision. With growth stocks highly sensitive to rates, any shift in Powell’s tone could trigger sharp repricing across the index.
This week, earnings from Microsoft, Meta, Apple, and Tesla place added focus on forward guidance, margins, and AI-related spending—key drivers for Nasdaq direction. Until clarity emerges, traders remain defensive.
Technical Outlook
The index maintains a bearish structure while trading below 25620.
A continuation below this pivot supports further downside toward 25250, followed by 25130.
A decisive breakdown below 25130, confirmed by stability, would expose a deeper move toward 24770.
On the upside, a recovery above 25620 would allow a corrective move toward 25835.
Only a sustained move above 25835 would shift momentum bullish, opening targets toward 26170.
Key Levels
• Pivot: 25620
• Support: 25410 – 25250 – 25130
• Resistance: 25835 – 25985 – 26170

Steel Dynamics (STLD) Set for Breakout Amidst Earnings Reports Shares of Steel Dynamics, Inc. (NASDAQ: NASDAQ:STLD ) are gearing for amidst earnings reports slated for today before market open.
The stock is already up 2.94% in Monday's premarket session. breaking out of a bullish rectangle pattern albeit market momentum. With the last recorded RSI at 63 NASDAQ:STLD is poise to hit new highs today.
Financial Performance
In 2024, Steel Dynamics's revenue was $17.54 billion, a decrease of -6.68% compared to the previous year's $18.80 billion. Earnings were $1.54 billion, a decrease of -37.28%.
About STLD
Steel Dynamics, Inc., together with its subsidiaries, operates as a steel producer and metal recycler in the United States. It operates through four segments: Steel Operations, Metals Recycling Operations, Steel Fabrication Operations, and Aluminum Operations. The Steel Operations segment offers hot rolled, cold rolled, and coated steel products; parallel flange beams and channel sections, large unequal leg angles, and reinforcing steel bars, as well as standard strength carbon.

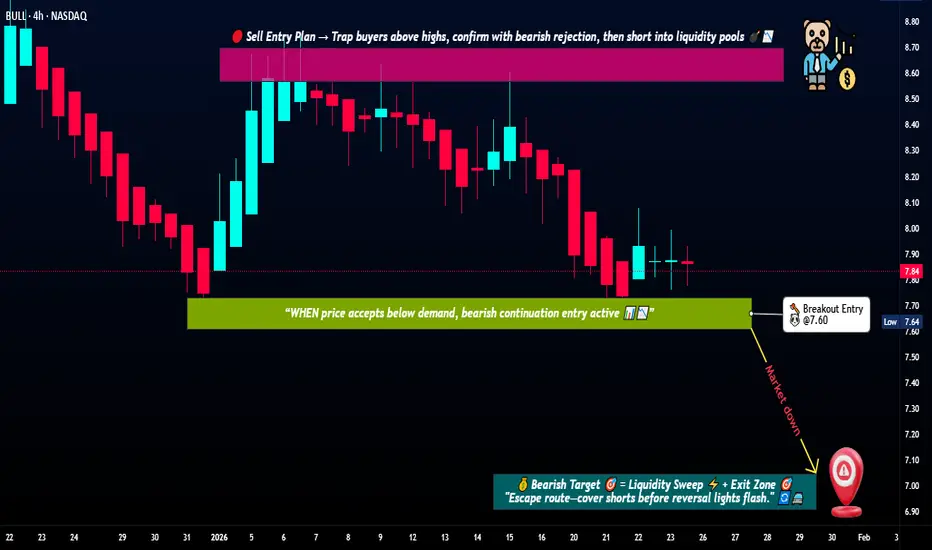
BULL | Support → Breakdown → Momentum Shift📉 BULL (Webull Corporation) — NASDAQ
Market Profit Playbook | Swing Trade Idea
🔍 Trade Bias
Primary Bias: Bearish
Trading Style: Swing Trade
Market Type: US Equities (NASDAQ)
This idea focuses on price action, structure, and confirmation-based execution, not prediction.
🧭 Technical Structure Overview
Price is testing a key demand / support zone
Market structure shows weak follow-through from buyers
Breakdown confirmation below support opens room for mean reversion
Momentum conditions suggest short-term exhaustion after failed support defense
This setup is valid only after confirmation, not anticipation.
🎯 Trade Plan (Structured & Rule-Compliant)
📍 Entry Idea
Consider short exposure only after a confirmed breakdown
Key level to watch: $7.60
Entry is valid after support failure + acceptance below the zone
🎯 Target Zone
$7.00
Area aligns with:
Prior structural reaction zone
Oversold conditions
Historical price congestion
Correlated reaction with broader risk sentiment
🛑 Risk Management (Stop Concept)
$8.10
Positioned above invalidation level
Trade thesis is invalid if price reclaims and holds above broken support
⚠️ Risk Notes (Read Carefully)
Dear Ladies & Gentlemen (Thief OG’s),
The levels shared here are reference points, not fixed instructions.
You are free to manage partials, exits, and risk according to your own plan.
🌍 Fundamental & Macro Context (Relevant to This Trade)
Company-Specific Factors
Fintech and brokerage stocks remain sensitive to volume, volatility, and sentiment
Revenue expectations are closely tied to retail trading activity
Any slowdown in participation impacts near-term valuation perception
Macro & Economic Environment
Equity markets currently react strongly to:
US interest-rate expectations
Fed communication tone
Liquidity conditions
Higher-for-longer rate narratives typically pressure growth and fintech names
Upcoming Risk Drivers to Monitor
US economic data releases (inflation, employment, PMI)
Federal Reserve statements or policy signals
Broad NASDAQ risk-on / risk-off flows
🔗 Correlated Assets to Watch ($)
These instruments help confirm or invalidate the idea:
NASDAQ:QQQ → NASDAQ risk sentiment
Weakness supports bearish continuation
AMEX:SPY → Broad market stability
Sharp rebounds may reduce downside momentum
NASDAQ:HOOD → Retail trading sentiment proxy
Relative weakness confirms sector pressure
TVC:VIX → Volatility expansion
Rising volatility often supports downside continuation
🧠 Execution Philosophy
Trade confirmation, not hope
Respect invalidation
Manage risk first, profits second
No emotional attachment to direction
✨ “If you find value in my analysis, a 👍 and 🚀 boost is much appreciated — it helps me share more setups with the community!”
NAS100 H1 | Bullish Bounce Off Pullback SupportMomentum: Bullish
Price is currently above the ichimoku cloud.
Buy entry: 25,621.48
- Pullback support
- 38.2% Fib retracement
- 61.8% Fib projection
Stop Loss: 25,518.36
- Pullback support
Take Profit: 25,733.97
- Swing high resistance
High Risk Investment Warning
Stratos Markets Limited (fxcm.com/uk), Stratos Europe Ltd (fxcm.com/eu):
CFDs are complex instruments and come with a high risk of losing money rapidly due to leverage. 69% of retail investor accounts lose money when trading CFDs with this provider. You should consider whether you understand how CFDs work and whether you can afford to take the high risk of losing your money.
Stratos Global LLC (fxcm.com/en): Losses can exceed deposits.
Please be advised that the information presented on TradingView is provided to FXCM (‘Company’, ‘we’) by a third-party provider (‘TFA Global Pte Ltd’). Please be reminded that you are solely responsible for the trading decisions on your account. Any information and/or content is intended entirely for research, educational and informational purposes only and does not constitute investment or consultation advice or investment strategy. The information is not tailored to the investment needs of any specific person and therefore does not involve a consideration of any of the investment objectives, financial situation or needs of any viewer that may receive it. Past performance is not a reliable indicator of future results. Actual results may differ materially from those anticipated in forward-looking or past performance statements. We assume no liability as to the accuracy or completeness of any of the information and/or content provided herein and the Company cannot be held responsible for any omission, mistake nor for any loss or damage including without limitation to any loss of profit which may arise from reliance on any information supplied by TFA Global Pte Ltd.
Stratos Trading Pty. Limited (fxcm.com/au):
Trading FX/CFDs carries significant risks. FXCM AU (AFSL 309763), please read the Financial Services Guide, Product Disclosure Statement, Target Market Determination and Terms of Business at fxcm.com/au

kvmev - EURJPY - 25/01/2026 - 30/01/2026Strong pullback on EJ, market structure is overall bullish creating HH's and is respecting the ascending trendline. Looking to take long positions upon strong rejection of zone below current price and trendline.

kvmev - EURNZD FORECAST - 25/01/2026 - 30/01/2026Clear head and shoulders pattern & closure below the current resistance zone above price.
Expecting a strong push to the downside.

kvmev - CADCHF FORECAST - 25/01/2026 - 30/01/2026Expecting a continuation to the downside following a retest of the zone above.

kvmev - USDCHF FORECAST - 25/01/2026 - 30/01/2026Expecting price to continue down following a retest of the resistance zone above.

Us100 Update : Patience - confirmation - executionAs mentioned earlier: no confirmation = no trade
Price first tapped the 1H FVG and continued higher - no reaction so no short taken
Later price returned again into the same 1H FVG and this time the story changed
LTF (3M) confirmation:
• SMT divergence with US500
• Clear Break of Structure on 3M
• Rejection from the 1H FVG zone
Only after these confirmations the short idea became valid

ABNB Demand Zone Holding — Upside Continuation Play🏠💰 THE MARKET PROFIT PLAYBOOK: ABNB SWING TRADE HEIST 🎯
A Bullish Strategic Entry Through Layered Limit Orders
📊 ASSET INTELLIGENCE 📊
Ticker: NASDAQ: NASDAQ:ABNB (Airbnb, Inc.)
Market Cap: 💵 $80.4B | Market Sentiment: Buy-rated (16 analyst Buy vs 3 Sell)
Current Price Range: $131.93 - $135.50 (24h) | 52-Week Range: $99.88 - $163.93
Volatility Index: 🎢 4.06% (Moderate-High with Beta: 1.56)
Upside Potential: ✨ +8.02% | Analyst Target: $143.23 (Consensus)
Next Earnings Catalyst: 📅 February 17, 2026 (After Market Close)
🎭 TRADE SETUP: THE PLAYBOOK 🎭
Strategic Direction: ⬆️ BULLISH MOMENTUM TRADE
This is a swing trade setup leveraging pullback entries into key support zones with a structured layering technique.
🔐 ENTRY STRATEGY: THE "THIEF" LAYERING METHOD 🔐
Rather than chasing a single entry point, deploy multiple limit order layers using the thief-style stacking approach:
📍 Layer 1: $131.00 (First accumulation zone)
📍 Layer 2: $132.00 (Secondary entry confirmation)
📍 Layer 3: $133.00 (Breakeven zone)
📍 Layer 4: $134.00 (Aggressive entry near resistance)
💡 Pro Tip: You can add additional limit layers at $130.50, $130.75, etc., based on your risk tolerance and capital allocation. Divide your total position size across all layers for risk management.
Why This Method Works:
✅ Reduces emotional FOMO buying at market price
✅ Accumulates shares at multiple entry points
✅ Creates a lower average entry cost
✅ Provides strategic entry during potential dips
🎯 PROFIT TARGET: POLICE BARRICADE RESISTANCE 🎯
Primary Target: 🚀 $140.00
Resistance Context:
This level represents a strong resistance barrier that previously acted as a supply zone
Market momentum tends to consolidate and exhaust near these overbought extremes
Technical trap pattern: Early buyers often look to exit when resistance is reached, creating profit-taking zones
Target Rationale:
Recent analyst consensus sits at $143.23 (upside from current levels)
$140.00 offers a clean risk/reward ratio with a natural resistance confluence
Overbought RSI conditions at higher levels suggest profit-taking opportunities
🛑 STOP LOSS: RISK MANAGEMENT ANCHOR 🛑
Hard Stop Loss: ⛔ $130.00
Why This Level:
Sits below current support zones shown in price action
Provides a clear loss-trigger if bullish thesis breaks down
Maintains favorable risk/reward (2:1 or better target-to-stop ratio)
📋 FUNDAMENTAL & MACROECONOMIC BACKDROP 📋
Company Performance - Q3 2025 Highlights: 📈
Revenue: $4.095B (+9.73% YoY) | TTM Revenue: $11.943B (+10.18% YoY)
EPS: $2.21 per share (Q3 2025)
Adjusted EBITDA: $2B+ (highest quarterly mark with 50% margin)
Gross Booking Value: $22.9B (+14% YoY growth)
Free Cash Flow: $4.5B (trailing 12 months)
Growth Catalysts Ahead: 🌍
✨ International Expansion: 20%+ first-time booker growth in Japan | 50% growth in India
✨ New Revenue Streams: Services & Experiences launching; Hotel partnerships expanding
✨ AI Integration: Continued investment in AI-powered pricing, search, and personalization
✨ 2026 Growth Target: Operating income projected at $3B (+15% YoY)
Macro Headwinds to Monitor: ⚠️
🔸 U.S. consumer confidence under pressure (discretionary travel spending at risk)
🔸 Regulatory uncertainty in key markets (Mexico City short-term rental framework unresolved)
🔸 Valuation premium at PEG 2.11 leaves minimal margin for error
🔸 Q4 2025 EPS estimate: $0.66 (must beat to sustain momentum)
🔗 RELATED PAIRS TO WATCH: CORRELATION ANALYSIS 🔗
Watch These Tickers for Market Context:
🏨 NASDAQ:EXPE (Expedia Group)
Correlation: Moderate positive (+0.65) | Direct competitor in online travel sector
Key Point: If EXPE strengthens, validates travel recovery narrative. ABNB often leads this pair.
🏰 NASDAQ:BKNG (Booking Holdings)
Correlation: Moderate positive (+0.60) | Diversified travel platform (hotels, flights, rentals)
Key Point: BKNG shows overall travel demand strength; a BKNG rally supports ABNB thesis
🚗 NASDAQ:TRIP (TripAdvisor)
Correlation: Weak positive (+0.45) | Review/discovery platform for travel
Key Point: User sentiment and travel intent indicator; watch for shifts in booking velocity
💼 NASDAQ:UAL (United Airlines)
Correlation: Moderate positive (+0.50) | Air travel proxy for leisure demand
Key Point: Rising airfare prices/bookings often precede accommodation demand; watch UAL as leading indicator
📱 NASDAQ:DASH (DoorDash) / NYSE:UBER (Uber)
Correlation: Weak (+0.40-0.45) | Broader consumer discretionary spend metric
Key Point: If gig-economy leaders soften, consumer pullback may impact ABNB bookings
Macro Pair: 🌐 TVC:DXY (US Dollar Index)
Inverse Correlation: (-0.55) | Strong dollar headwinds for international travel bookings
Watch Point: Weaker USD supports overseas guests booking ABNB properties globally
⚡ TRADE MANAGEMENT RULES ⚡
📌 Important Disclaimer on Targets & Stops:
This is a stylized swing trade setup presented for educational entertainment purposes only. We do NOT recommend blindly following our target or stop-loss levels. Every trader must assess their own:
✅ Risk tolerance & account size
✅ Entry confirmation using your own technical indicators
✅ Profit-taking strategy based on personal goals
✅ Position sizing rules
You have the freedom and responsibility to adjust TP and SL based on real-time price action, volume, and your risk management framework.
📊 TECHNICAL CHECKLIST BEFORE ENTRY 📊
Before deploying your layered limit orders, confirm:
☑️ Price respects support zones around $130-$131
☑️ Volume dries up on pullbacks (confidence confirmation)
☑️ RSI not in extreme oversold (<30) or overbought (>70) at time of entry
☑️ 4-hour/Daily chart shows bullish structure (higher lows intact)
☑️ Earnings date (Feb 17) factored into volatility expectations
📅 WATCH THESE CATALYSTS �CALENDAR
🔴 Feb 17, 2026 - Q4 2025 Earnings Report (Market Close)
🔴 Consumer Confidence Reports - Check weekly jobless claims & PCE inflation
🔴 Regulatory Headlines - Monitor Mexico City & international STR regulation updates
🔴 Fed Communications - Interest rate policy impacts discretionary travel demand
🎪 PLAYBOOK SUMMARY 🎪
Thesis: Airbnb shows fundamental growth strength with expanding margins, international tailwinds, and a dominant market position. A pullback into the $131-$134 zone offers favorable entry for swing traders betting on a $140+ near-term rally. The thief layering method allows strategic accumulation while managing downside risk at $130.
Reward: +$6-$9 per share profit potential
Risk: -$1-$4 per share (depending on layer)
Timeframe: 2-6 weeks (swing trade, not day trade)
✨ COMMUNITY LOVE REQUEST ✨
If you find value in my analysis, a 👍 and 🚀 boost is much appreciated — it helps me share more setups with the community!

Bullish bounce off overlap support?Based on the H1 chart analysis, we could see the price fall to our buy entry level at 25,307.06, which is an overlap support that aligns with the 38.2% Fibonaci retracement.
Our stop loss is set at 25,110.69, which is an overlap support that is slightly below the 61.8% FIbonacci retracement.
Our take profit is set at 25,576.74, which is a pullback support.
High Risk Investment Warning
Stratos Markets Limited fxcm.com Stratos Europe Ltd fxcm.com
CFDs are complex instruments and come with a high risk of losing money rapidly due to leverage. 69% of retail investor accounts lose money when trading CFDs with this provider. You should consider whether you understand how CFDs work and whether you can afford to take the high risk of losing your money.
Stratos Global LLC fxcm.com Losses can exceed deposits.
Please be advised that the information presented on TradingView is provided to FXCM (‘Company’, ‘we’) by a third-party provider (‘TFA Global Pte Ltd’). Please be reminded that you are solely responsible for the trading decisions on your account. Any information and/or content is intended entirely for research, educational and informational purposes only and does not constitute investment or consultation advice or investment strategy. The information is not tailored to the investment needs of any specific person and therefore does not involve a consideration of any of the investment objectives, financial situation or needs of any viewer that may receive it. Past performance is not a reliable indicator of future results. Actual results may differ materially from those anticipated in forward-looking or past performance statements. We assume no liability as to the accuracy or completeness of any of the information and/or content provided herein and the Company cannot be held responsible for any omission, mistake nor for any loss or damage including without limitation to any loss of profit which may arise from reliance on any information supplied by TFA Global Pte Ltd.
Stratos Trading Pty. Limited fxcm.com
Trading FX/CFDs carries significant risks. FXCM AU (AFSL 309763), please read the Financial Services Guide, Product Disclosure Statement, Target Market Determination and Terms of Business at fxcm.com

S&P500, NASDAQ Update: Found Support! Heading Higher?This is an mid-week UPDATE to the Weekly Forex Forecast for the week of Jan. 19-24th.
In this video, we will analyze the following FX market: ES and NQ
Both of the indices dumped upon the Open Tuesday with Trump tariff threats. Wednesday, the market found support and bounced for a full recovery from Tuesday's drop.
If price breaks through the Volume Imbalance, we could see the market rally to the buy side liquidity highs, as mentioned in the forecast .
We'll soon see...
Enjoy!
May profits be upon you.
Leave any questions or comments in the comment section.
I appreciate any feedback from my viewers!
Like and/or subscribe if you want more accurate analysis.
Thank you so much!
Disclaimer:
I do not provide personal investment advice and I am not a qualified licensed investment advisor.
All information found here, including any ideas, opinions, views, predictions, forecasts, commentaries, suggestions, expressed or implied herein, are for informational, entertainment or educational purposes only and should not be construed as personal investment advice. While the information provided is believed to be accurate, it may include errors or inaccuracies.
I will not and cannot be held liable for any actions you take as a result of anything you read here.
Conduct your own due diligence, or consult a licensed financial advisor or broker before making any and all investment decisions. Any investments, trades, speculations, or decisions made on the basis of any information found on this channel, expressed or implied herein, are committed at your own risk, financial or otherwise.

US100 Short From Resistance!
HI,Traders !
#US100 made a retest
Of the horizontal resistance
Of 25725.0 from where we
Are already seeing a local
Bearish reaction so a further
Move down is to be expected !
Comment and subscribe to help us grow !

USNAS100 | Risk-Off Structure as Geopolitical Tensions WeighUSNAS100 | Technical Outlook
USNAS100 remains under bearish pressure, driven by elevated geopolitical tensions.
The bearish structure is active below 25250, with downside acceleration expected below 25100.
Market Structure
Below 25250: Bearish bias remains intact
Below 25100: Bearish continuation toward 24770
Further downside extension may reach 24580
Above 25250: Short-term recovery toward 25360, followed by 25500
Key Levels
Pivot Line: 25250
Resistance: 25360 – 25500 – 25710
Support: 25100 – 24770 – 24580

Wait for Liquidity. Then Execute.CAPITALCOM:US100 Overall structure remains bearish on both HTF and LTF.
Price is trading around 25,000, holding below key resistance zones. No structural shift confirmed yet.
VANTAGE:NAS100 In the short term, price may attempt a corrective
pullback toward 25,300–25,400, where prior imbalance and resistance sit.
As long as there is no acceptance above 25,400, this move is corrective only, not a trend reversal.
🎯 Key Levels & Scenarios
Upside (Corrective only)
• 25,300–25,400
→ Liquidity grab / short term pullback zone
→ Preferred area to look for short setups on rejection
Downside targets
• 24,800
→ Immediate intraday support (currently in play)
• 24,600
→ First clean downside objective
• 24,000
→ Major HTF liquidity pool / extended bearish target
⚡ Scalp Ideas (LTF)
Scalp Short
• Rejection from 25,250–25,400
• Weak bullish momentum or lower high on LTF
• Targets:
→ 25,000
→ 24,900
Scalp Long (counter trend, quick only)
• Strong reaction from 24,900–24,850
• Clear displacement and acceptance on LTF
• Targets:
→ 25,050–25,150
• Reaction trades only, not swing longs
⚠️ Invalidation
• Sustained acceptance above 25,400
→ Weakens immediate bearish continuation
→ Requires reassessment of short bias
Until invalidation occurs, rallies are sell side opportunities, not reversals.
Bias stays bearish. 📉🦈
🧠 Execution Reminder
Higher time frame first.
Lower time frame execution second.
Not investment advice. Always manage your own risk.

Nasdaq - Stocks are just heading higher!🚀Nasdaq ( TVC:NDQ ) is creating new all time highs:
🔎Analysis summary:
Tech stocks just finished an extremely strong year and we were offered quite a lot of buying opportunities during 2025. Looking at the higher timeframe, we could see a short term retracement going into 2026, but the underlying trend remains totally bullish.
📝Levels to watch:
$25,000
SwingTraderPhil
SwingTrading.Simplified. | Investing.Simplified. | #LONGTERMVISION

HTF Supply in ControlCAPITALCOM:US100 As seen on the daily chart, price continued to respect the OG supply zone at 25,900 – 26,000, a level marked and shared earlier.
The rejection from this area remained valid and downside continuation followed as expected.
VANTAGE:NAS100 On the 1H chart, structure stayed bearish while price remained below key resistance levels.
There was no acceptance back above resistance, keeping sellers in control.
📉 Daily Bias
Bearish below 25,900 – 26,000 (OG Supply Zone).
As long as price trades below this zone, downside scenarios remain valid.
🎯 1H Expectations
• Any move toward 25,300 – 25,350 is considered corrective
• While below 25,300, selling pressure remains active
• Acceptance below 25,150 confirms continuation toward lower levels
📌 Key Levels (HTF & 1H)
• 25,900 – 26,000 → Daily OG Supply / Invalidation
• 25,300 – 25,350 → 1H resistance
• 25,150 → Intraday decision level
• 25,000 – 24,950 → Lower liquidity / demand area
⚡ Intraday Execution Note (15M & 5M)
Bias is taken from Daily and 1H. Execution is refined on 15M and confirmed on 5M.
🔴 SHORT execution (primary direction)
• Entry zone: 25,250 – 25,300 (sell confirmation on 5M)
• Targets: 25,150 then 25,050 – 25,000
• Invalidation: acceptance above 25,350
🟢 LONG execution (reaction-based scalp)
• Entry zone: 25,000 – 25,050 (hold + confirmation on 5M)
• Targets: 25,150 then 25,230 – 25,250
• Invalidation: acceptance below 24,950
These are execution scenarios only and remain aligned with the higher time frame bearish structure.
🛑 Invalidation
Only a daily acceptance above 25,900 – 26,000 invalidates the bearish bias.
Until then, structure favors shorts.
🧠 Execution Reminder
Higher time frame first.
Lower time frame execution second.
Not investment advice. Always manage your own risk.

NASDAQ NAS100 Technical Analysis and Trade IdeaMy bias remains bullish on the NAS100 🐂, but patience is the name of the game today. Fundamentally, the index is struggling for oxygen as the market digests the "no rate cut" reality for January, causing a temporary decoupling from the broader risk-on flows 📉. Technically, we are trapped in a corrective flag, and the rejection at 25,600 confirms that the bears are still defending the highs.
If the setup triggers, aim for a 5R return to start 🎯. If the price action reclaims 25k within our optimal entry zone. Look to close partial profits (50%) at 25,400 (1R) 💰, then let the rest run and use a trailing SL. Patience pays on this one, let the setup come to us. ⏳ This trade is invalidated if we lose the 24,550 structural pivot 🛑.

S&P500 | NASDAQ: AMD In Action! Wait For Distribution!Welcome back to the Weekly Forex Forecast for the week of Jan. 19-24th.
In this video, we will analyze the following FX market: ES and NQ
Both indices have been moving sideways for over two weeks. Tariff news over this weekend has caused investors to move money to safe havens, like gold and silver, and out of the equity markets.
I believe this is for the short term. Should better heads prevail, Trump will back off his tariff threats to NATO allies. Meanwhile, the injection of volatility by the news shook up the markets again, keeping the air of uncertainty in place.
My plan is to wait for the signature of price to show us that the pullback is over, and the market will resume its upward trend.
Accumulation, Manipulation, Distribution. On a Bank Holiday Monday for the US banks, this is a day when manipulation can catch a lot of traders unawares.
I am waiting for the Distribution part to begin.
No trades for me today. ; )
Enjoy!
May profits be upon you.
Leave any questions or comments in the comment section.
I appreciate any feedback from my viewers!
Like and/or subscribe if you want more accurate analysis.
Thank you so much!
Disclaimer:
I do not provide personal investment advice and I am not a qualified licensed investment advisor.
All information found here, including any ideas, opinions, views, predictions, forecasts, commentaries, suggestions, expressed or implied herein, are for informational, entertainment or educational purposes only and should not be construed as personal investment advice. While the information provided is believed to be accurate, it may include errors or inaccuracies.
I will not and cannot be held liable for any actions you take as a result of anything you read here.
Conduct your own due diligence, or consult a licensed financial advisor or broker before making any and all investment decisions. Any investments, trades, speculations, or decisions made on the basis of any information found on this channel, expressed or implied herein, are committed at your own risk, financial or otherwise.

UMAC: when unusual machines start printing moneyUnusual Machines operates in a high-risk, niche technology segment driven by speculative demand and rapid capital rotation. Recent attention to the stock has increased sharply due to volume expansion and growing market interest. This is not a value-driven story but a momentum-driven one, where price behavior and liquidity flows dominate decision-making. Such stocks are often used by funds and traders during risk-on phases to accelerate returns through volatility.
Technically, UMAC has broken out from a long accumulation base and confirmed a structural trend shift. Price is holding above the key 0.618 Fibonacci level, signaling strong bullish control. The current structure resembles post-breakout consolidation with continuation potential. The primary scenario targets 26.1 and 39.3 based on Fibonacci extensions, provided price holds above the 17.5–18.0 zone. An alternative scenario allows for a pullback toward 12.8–13.0, which may act as a re-entry support zone. CCI remains in positive territory, confirming sustained momentum.
When markets reward risk, stocks like this do not move quietly. They move fast, and they move without apology.

No Rush. No FOMO. Just Levels.CAPITALCOM:US100 As seen on the daily chart, price once again respected the OG supply zone around 25,900 – 26,000, a level marked and shared at the beginning of last week.
From this area, all short scenarios provided during the week played out cleanly, with price respecting structure step by step.
This move was further confirmed by the new week opening with a strong gap down, shifting price below the 25,300 area, fully aligning with the higher time frame bearish bias.
📉 Daily Bias VANTAGE:NAS100
Bearish below 25,900 – 26,000 (OG Supply Zone)
As long as price remains under this zone, downside scenarios remain valid.
🎯 1H Expectations
• Any retracement toward 25,600 – 25,900 is considered corrective
• While below 25,600, sellers remain in control
• Acceptance below 25,250 keeps downside pressure active
📌 Key Levels
• 25,900 – 26,000 → Daily OG Supply / Invalidation
• 25,600 → 1H resistance
• 25,250 → Key intraday support
• 24,900 – 24,800 → Lower demand / liquidity area
⚡ Intraday Scalp Scenarios (15M & 5M Execution)
Scalp bias is derived from 1H structure. Execution is refined on 15M and confirmed on 5M.
🔴 Short Scalp Scenario
• Sell zone: 25,580 – 25,650 (15M supply / HTF discount)
• Confirmation: 5M lower high + breakdown
• Targets:
→ 25,300 first reaction
→ 25,250 continuation level
🟢 Long Scalp Scenario (Counter-trend)
• Buy zone: 25,250 – 25,300 (intraday demand / reaction area)
• Confirmation: 5M rejection + hold above level
• Targets:
→ 25,380 – 25,420 quick reaction
→ 25,500 max scalp extension
⚠️ These are reaction based scalps, not trend reversals.
Main structure remains bearish unless daily invalidation occurs.
🛑 Invalidation
Only a daily acceptance above 25,900 – 26,000 invalidates the current bearish bias.
Until then, structure favors shorts.
🧠 Execution Reminder
No rush.
No FOMO.
Just your levels.
Not investment advice. Always manage your own risk.
