QQQ - NASDAQ Has Never Been This ExpensiveQQQ relative to the money supply reveals that markets have never been this expensive in history. Despite the significant amount of money pumped in during the COVID-19 pandemic, the economy has not kept pace with all the zeros added to Gov debt.
If we can't lower deficits now at max employment, when will we?
Tulips!
Caution is in order despite what "experts" may tell you.
Click like Follow Subscribe, let's get to 5,000 followers.
NASDAQ 100 CFD

NQ Shorts IncomingYM approaching 4H imbalance, ES could sweep asian session high and play into previous OB while NQ sweeps london session liq and mitigates asian session OB

NAS100 H4 | Bullish Bounce from Key SupportNAS100 is falling towards the buy entry at 24,804.95, which is an overlap support that is slightly below the 38.2% Fibonacci retracement and could bounce from this level to the upside.
Stop loss is at 24,423.43, which is a pullback support.
Take profit is at 25,500.67, which lines up with the 127.2% Fibonacci extension.
High Risk Investment Warning
Trading Forex/CFDs on margin carries a high level of risk and may not be suitable for all investors. Leverage can work against you.
Stratos Markets Limited (tradu.com ):
CFDs are complex instruments and come with a high risk of losing money rapidly due to leverage. 65% of retail investor accounts lose money when trading CFDs with this provider. You should consider whether you understand how CFDs work and whether you can afford to take the high risk of losing your money.
Stratos Europe Ltd (tradu.com ):
CFDs are complex instruments and come with a high risk of losing money rapidly due to leverage. 66% of retail investor accounts lose money when trading CFDs with this provider. You should consider whether you understand how CFDs work and whether you can afford to take the high risk of losing your money.
Stratos Global LLC (tradu.com ):
Losses can exceed deposits.
Please be advised that the information presented on TradingView is provided to Tradu (‘Company’, ‘we’) by a third-party provider (‘TFA Global Pte Ltd’). Please be reminded that you are solely responsible for the trading decisions on your account. There is a very high degree of risk involved in trading. Any information and/or content is intended entirely for research, educational and informational purposes only and does not constitute investment or consultation advice or investment strategy. The information is not tailored to the investment needs of any specific person and therefore does not involve a consideration of any of the investment objectives, financial situation or needs of any viewer that may receive it. Kindly also note that past performance is not a reliable indicator of future results. Actual results may differ materially from those anticipated in forward-looking or past performance statements. We assume no liability as to the accuracy or completeness of any of the information and/or content provided herein and the Company cannot be held responsible for any omission, mistake nor for any loss or damage including without limitation to any loss of profit which may arise from reliance on any information supplied by TFA Global Pte Ltd.
The speaker(s) is neither an employee, agent nor representative of Tradu and is therefore acting independently. The opinions given are their own, constitute general market commentary, and do not constitute the opinion or advice of Tradu or any form of personal or investment advice. Tradu neither endorses nor guarantees offerings of third-party speakers, nor is Tradu responsible for the content, veracity or opinions of third-party speakers, presenters or participants.

NASDAQ 100 Resistance Reaction and Countertrend Short SetupThe NASDAQ 100 has rallied strongly and is now trading near the top of its current range 📊. Price is approaching a key resistance level, and I’m expecting a potential reaction from liquidity above the highs, followed by a retracement back to equilibrium — around 50% of the current price swing 📉.|
A countertrend short setup could be considered here, with the option to take partial profits early to reduce risk 💡. Full details of the trade idea and execution are explained clearly in the video.
⚠️ Disclaimer: This is for educational purposes only and not financial advice.

NAS100 Technical Outlook (18–25 Oct 2025)Trend Summary:
NASDAQ 100 remains in a corrective phase after rejecting near the 25,200–25,300 resistance zone. Recent price action forms a potential Wave 4 retracement within a medium-term bullish Elliott structure.
1D Chart View:
The index is hovering around key support at 24,750, aligned with the 3 8.2% Fib retracement of the prior leg and near daily EMA50. A bullish reversal from this zone would confirm continuation toward 25,800–26,000.
4H Structure:
A descending channel is observed, acting as a corrective pullback. Ichimoku Cloud shows price testing the lower edge; a break above 25,050 could signal momentum recovery. Volume divergence hints at accumulation beneath.
1H / 30M:
RSI forming a higher low while price prints a lower low — a bullish divergence setup. Bollinger Bands are tightening, suggesting volatility expansion ahead. Watch VWAP reclaim above 25,000 for confirmation of short-term trend reversal.
15M / 5M Intraday Bias:
Short-term traders should monitor the 24,800–24,750 zone for a bounce. Failure below this area exposes 24,620, while a decisive break above 25,050 may trigger an intraday rally targeting 25,250–25,300.
🎯 Trading Plan
Bullish Scenario:
Buy Zone: 24,750–24,800
Targets: 25,050 → 25,250 → 25,800
Stop Loss: 24,580 (below structure low)
Bearish Scenario (alternative):
Sell Zone: 25,250–25,300 (resistance rejection)
Targets: 25,000 → 24,750 → 24,620
Stop Loss: 25,400
🔍 Confluence Factors:
Elliott Wave: Wave 4 correction likely ending.
Fibonacci: 38.2–50% retracement aligning with structure support.
Ichimoku: Testing lower cloud — potential bullish crossover setup.
RSI Divergence: Positive momentum building.
VWAP: Reclaim signals early buyer strength.
Volume: Accumulation noted during low volatility phase.
📘 Outlook Summary:
Bias remains cautiously bullish above 24,750, targeting 25,800–26,000.
Break below 24,620 invalidates bullish structure and opens path to 24,300–24,200.
NAS100 traders should monitor intraday reactions and volume confirmations near key zones. This week may define whether the correction phase transitions into a new impulsive wave or deeper retracement.

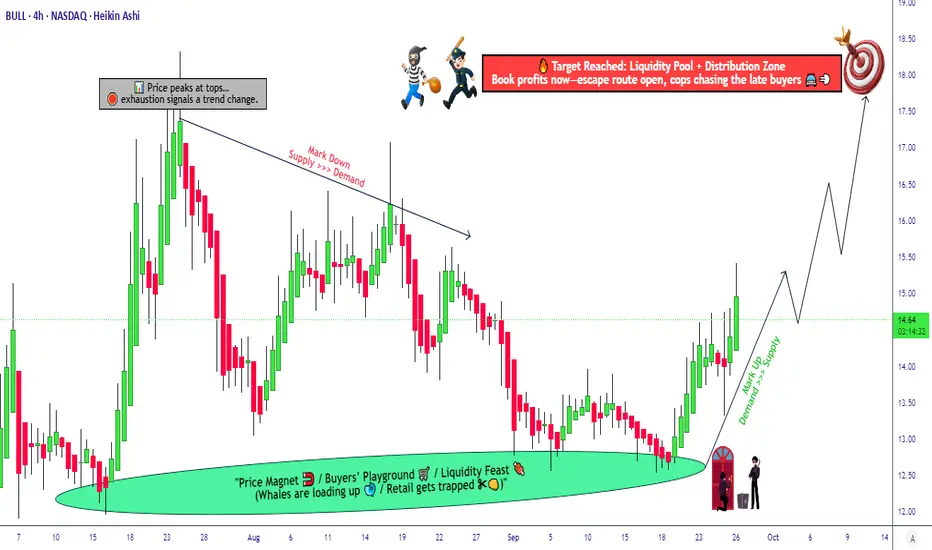
Step-by-Step Strategy Map: BULL Stock Bullish Case Study🚨 Stealing Profits with WEBULL CORPORATION ( NASDAQ:BULL ): The Ultimate Thief Strategy Map 🗺️💰
Asset: WEBULL CORPORATION ( NASDAQ:BULL )
Market: US Stock
MarketStrategy: Swing/Day Trade
Vibe: Bullish 🐂
Buckle up, my fellow Thief OG's 😎! We're about to pull off a heist on NASDAQ:BULL with a slick, layered entry strategy that’s as smooth as a cat burglar in the night. This plan is designed to maximize profits while dodging the police barricades (resistance levels) with style. Let’s break it down with a professional yet fun twist to make this idea pop on TradingView! 🚀
📜 The Heist Plan: Bullish Swing/Day Trade
🎯 Plan: Bullish — we're sneaking into NASDAQ:BULL ’s upward momentum like master thieves!
🔑 Entry Strategy: Thief Layering Strategy 🕵️♂️
Use multiple buy limit orders to layer entries like a pro. Suggested entry points:
$13.00
$13.50
$14.00
$14.50
Pro Tip: Feel free to add more layers based on your risk appetite — scale up or down as you see fit! This flexible approach lets you catch the best price action without chasing the market. 🏃♂️
🛑 Stop Loss: Set a Thief SL at $12.50 to protect your loot.
Note: Dear Ladies & Gentlemen (Thief OG's), this SL is my suggestion, but it’s your heist! Adjust based on your risk tolerance and make those profits at your own discretion. 💼
🎉 Target: Watch out for the police barricade (strong resistance) around $18.00, where overbought conditions and potential traps may lurk. Take profits here or earlier if you spot trouble!
Note: Thief OG's, this is my suggested target, but you’re the boss of your trades. Secure your gains when you feel the heat! 🔥
🔍 Why NASDAQ:BULL ? Key Points & Market Context
📈 Technical Analysis: NASDAQ:BULL is showing bullish momentum with strong volume and price action, making it a prime candidate for swing/day trading. Recent breakouts above key moving averages signal potential upside.
💡 Thief Strategy Edge: The layered entry approach minimizes risk by spreading buy orders across price levels, allowing you to capitalize on pullbacks while avoiding overpaying during spikes.
🚨 Resistance Watch: The $18.00 level is a critical zone due to historical resistance and potential overbought signals (check RSI and volume). Plan your exit carefully to avoid getting caught!
📊 Market Sentiment: Positive sentiment in the fintech sector, driven by increased retail trading activity, supports NASDAQ:BULL ’s upward potential.
👀 Related Pairs to Watch
To maximize your heist, keep an eye on these correlated assets for additional opportunities or confirmation:
NASDAQ:HOOD (Robinhood Markets): Another fintech stock with similar retail trading exposure. If NASDAQ:HOOD is also bullish, it could confirm NASDAQ:BULL ’s momentum. Watch for synchronized breakouts!
NASDAQ:SOFI (SoFi Technologies): A fintech peer with strong correlation to $BULL. Check for parallel price action to validate the bullish setup.
AMEX:SPY (S&P 500 ETF): As a broad market proxy, AMEX:SPY ’s direction can influence $BULL. A bullish AMEX:SPY supports our heist, while a bearish turn signals caution.
Correlation Key: These stocks often move together due to shared exposure to retail investor sentiment and fintech sector trends. If NASDAQ:HOOD or NASDAQ:SOFI lags, it could hint at weakening momentum for $BULL.
🛠️ How to Execute the Thief Strategy
Set Up Layers 🧱: Place buy limit orders at $13.00, $13.50, $14.00, and $14.50 (or customize your levels). This spreads your entry risk and catches dips.
Monitor Momentum 📡: Use indicators like RSI, MACD, or Bollinger Bands to confirm bullish strength. Avoid entering if momentum weakens.
Secure the Loot 💸: Set a stop loss at $12.50 to limit downside. Trail your stop as price climbs to lock in gains.
Escape Plan 🏃♂️: Take profits near $18.00 or earlier if resistance kicks in. Don’t get greedy — the police (market traps) are always watching!
Stay Flexible 🌀: Adjust layers and stops based on real-time price action. This is a dynamic heist, not a one-size-fits-all plan.
⚠️ Disclaimer
This Thief Style Trading Strategy is for entertainment and educational purposes only. Trading involves risks, and you’re responsible for your own decisions. I’m not a financial advisor, just a fellow market bandit sharing ideas for fun! 😜 Always do your own research and trade at your own risk.
✨ “If you find value in my analysis, a 👍 and 🚀 boost is much appreciated — it helps me share more setups with the community!”
#Hashtags:#BULL #WEBULL #SwingTrading #DayTrading #ThiefStrategy #Fintech #StockMarket #Bullish #TradingView #ProfitHeist
NASDAQ 100 ShortRetracement function on the daily chart...
Price has filled the inefficiency on the daily chart here on NQ and formed a Reversal on all 3 correlated assets alongside Dow Jones 30 and S&P500
Anticipating price to drop down to the lows outlined before the end of next week 24 Oct 25', option puts??
Daily chart projection, nothing more than that, lower timeframes are subject to fluctuations that we may not be able to update quickly enough, so yeah.
I use the VANTAGE:NAS100FT by Vantage
GLGT

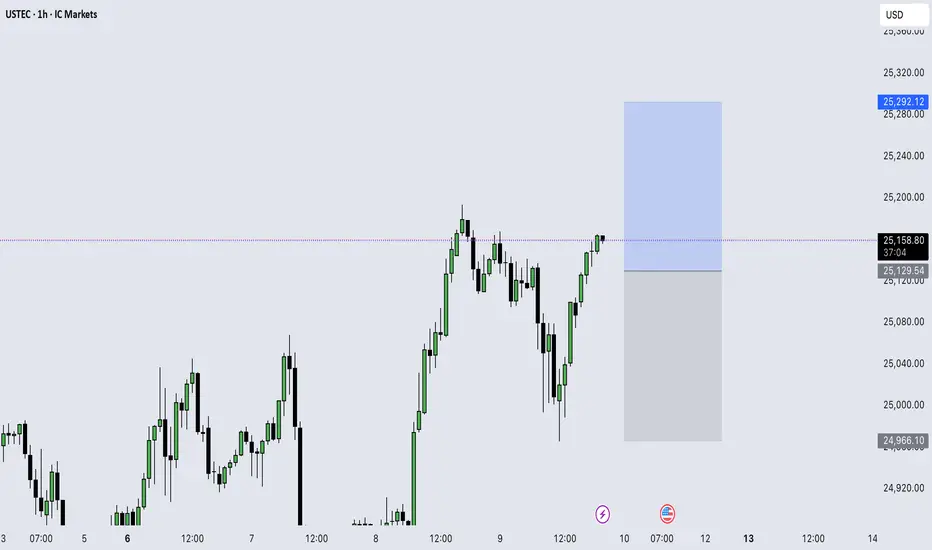
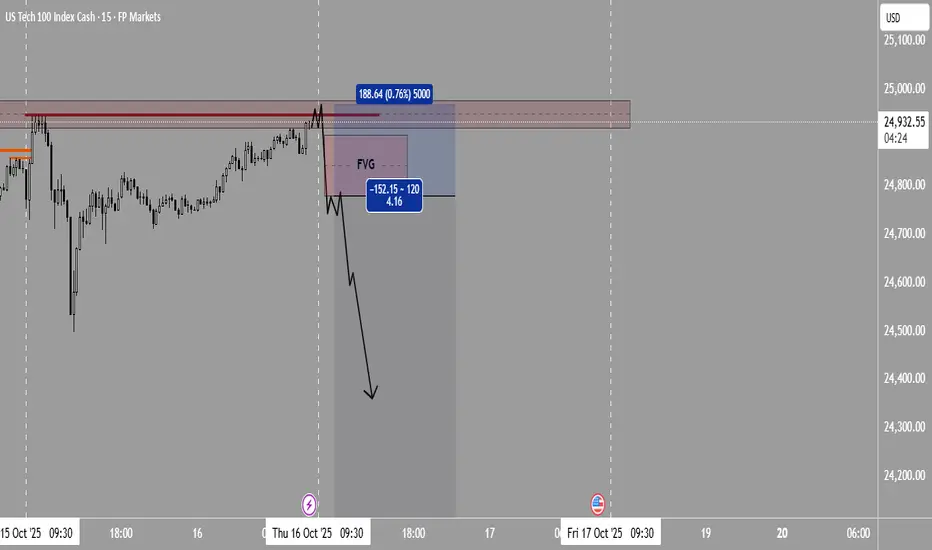
I’m getting ready for potential short position |October 16 2025If today the price goes up and hunts the high from 10 AM yesterday (New York time) — meaning it grabs the liquidity and takes out the stops above that level — and then forms a bearish Fair Value Gap (FVG) followed by signs of weakness or a rejection structure (like a lower-timeframe break, divergence, or bearish confirmation candle), that scenario would be one of the best short setups of the day.
USNAS100 – Overview | Bearish Pressure Below 24,855USNAS100 – Overview | Bearish Momentum Below 24,855
The index shows bearish momentum today as long as price trades below 24,855, after testing the resistance zone twice.
Failure to break higher keeps the pressure on the downside, with potential to drop toward 24,510 in the near term.
A 1H close above 24,855 would invalidate the bearish setup and trigger a strong bullish continuation toward the all-time-high (ATH) region near 25,035 → 25,200.
Pivot: 24,855
Support: 24,660 – 24,520 – 24,350
Resistance: 25,035 – 25,200 – 25,400

NQ Bias | October 15, 2025NQ perpective after mass liquidity sweep again. Correlation w/ other indices as well.

Can NASDAQ100’s Retest Turn Into a Full-Fledged Rally?⚡ NASDAQ100 — “The Wall Street Engine” Trade Opportunity Guide (Swing / Day Trade)
Plan:
📈 Bullish confirmation awaited at the Hull Moving Average retest.
When price respects that dynamic zone and momentum aligns, the Thief layers up — ready to stack positions like a pro!
💰 Thief Strategy Playbook:
Thief’s weapon? Layering entries — the art of scaling in like a patient hunter.
Multiple buy limit orders are placed around:
🔹 24,400 🔹 24,500 🔹 24,600
(You can adjust or add more layers based on your own trading structure and capital.)
🛡️ Stop-Loss:
This is the Thief’s SL → @24,200
🕵️♂️ Note to all Thief OGs:
I’m not recommending that you copy my SL — risk management is your call.
Remember: Make money, then take money at your own risk.
🎯 Target Zone:
@25,300 — where the POLICE BARRICADE (resistance) stands tall!
⚠️ The zone aligns with overbought levels + liquidity trap potential, so don’t overstay your welcome.
Escape with profits like a smart thief before the market cuffs you! 💨
🕵️♂️ Note again to Thief OGs:
Targets are flexible — adapt based on your execution and structure confirmation.
🔍 Correlated Assets to Watch:
SP:SPX (S&P500) — often mirrors NASDAQ’s overall direction.
TVC:DJI (Dow Jones) — gives early risk-on/risk-off sentiment clues.
TVC:US10Y (US Treasury Yield) — rising yields can pressure tech stocks.
TVC:VIX (Volatility Index) — watch for volatility spikes; they often precede reversals.
Correlation Key Insight:
When the dollar weakens and yields cool, NASDAQ tends to fly 🚀 — liquidity rotation favors growth stocks and tech-heavy indices.
⚙️ Quick Recap:
✅ Bias: Bullish (with retest confirmation at Hull MA)
💸 Entry Zone: 24,400 → 24,600 (Layered limits)
🧱 SL: 24,200 (risk-controlled zone)
🎯 TP: 25,300 (liquidity + resistance zone)
⚠️ Risk: Adjust position size and trail stops as structure evolves
✨ “If you find value in my analysis, a 👍 and 🚀 boost is much appreciated — it helps me share more setups with the community!”
📜 Disclaimer:
This is a Thief-style trading strategy — designed for entertainment, education, and market storytelling. Trade responsibly; it’s just for fun, not financial advice.
#NASDAQ100 #US100 #IndexTrading #HullMA #PriceAction #MarketStructure #SwingTrade #DayTrade #TechnicalAnalysis #SmartMoneyConcepts #TradingCommunity #ThiefTrader #ChartArt #EditorPickCandidate

Rising Wedge Broken: Is This the Start of a Deeper Pullback?Price on NAS100 has been climbing steadily inside a rising wedge, a pattern that often signals buyer exhaustion and a potential bearish reversal.
As the structure tightened near the top, momentum began to fade, showing signs of weakening bullish pressure.
And then price broke below the wedge support line with a strong impulsive bearish candle.
So my expectation is for price to continue more to the downside with the next downside target at around 23,500.

NASDAQ NAS100 Trade Plan: VWAP & Volume Profile StrategyI’m currently watching the NASDAQ #100 (#NDX) 📊. After a strong correction due to geopolitical turmoil 🌍, the market rebounded just as aggressively. Right now, price is trading above VWAP 📈. If it stays above VWAP, I’ll be looking for a long opportunity.
In the video, we zoom into a 30-minute timeframe ⏱️, using VWAP and Volume Profile to plan the trade. If price respects these levels, we can take a long. If it falls below the support level ❌, we abandon this idea.
⚠️ Disclaimer: This is for educational purposes only and not financial advice.

Nasdaq - Clearly heading to $30.000!🎉Nasdaq ( TVC:NDQ ) points much higher:
🔎Analysis summary:
Yes, we witnessed a short term correction over the past couple of days. But no, this does not mean that the bullrun is now entirely over. In fact, looking at the longer term rising channel pattern, the Nasdaq can still rally higher until it will retest the upper trendline.
📝Levels to watch:
$25.000, $30.000
SwingTraderPhil
SwingTrading.Simplified. | Investing.Simplified. | #LONGTERMVISION

How to find algorithmic levels of support and resistanceUsing repeating pinpoint levels to form meaning of opens and closes around these levels give you an advantage in your analysis.
As price gives us clues to what levels are affecting price, we should mark the new candles that are responding to these levels by breaking and retesting these very levels.
Please let me know your thoughts! 🙏🏾

NASDAQ 100 (NQ1!): Still Bullish! Wait For Valid Buys!Welcome back to the Weekly Forex Forecast for the week of Oct. 13 - 17th.
In this video, we will analyze the following FX market: NASDAQ (NQ1!) NAS100
The NASDAQ dumped last Friday with the Trump tariffs on China announcement. His latest tweet seems to have lowered the temperature on the tension. The markets have opened with a gap up.
The plan: look for valid buy setups, and stay with the overall trend. Avoid selling this market.
Simple.
Enjoy!
May profits be upon you.
Leave any questions or comments in the comment section.
I appreciate any feedback from my viewers!
Like and/or subscribe if you want more accurate analysis.
Thank you so much!
Disclaimer:
I do not provide personal investment advice and I am not a qualified licensed investment advisor.
All information found here, including any ideas, opinions, views, predictions, forecasts, commentaries, suggestions, expressed or implied herein, are for informational, entertainment or educational purposes only and should not be construed as personal investment advice. While the information provided is believed to be accurate, it may include errors or inaccuracies.
I will not and cannot be held liable for any actions you take as a result of anything you read here.
Conduct your own due diligence, or consult a licensed financial advisor or broker before making any and all investment decisions. Any investments, trades, speculations, or decisions made on the basis of any information found on this channel, expressed or implied herein, are committed at your own risk, financial or otherwise.

NASDAQ Faces Downside Risk Amid Tariff and Shutdown UncertaintyUSNAS100 – Technical Outlook Aligned with Fundamentals
The Nasdaq 100 fell sharply on Friday, losing nearly 1,200 points within six hours as it retreated from its all-time high.
The drop came amid renewed U.S.–China tariff tensions and growing uncertainty from the ongoing U.S. government shutdown, which has delayed key economic data releases and weighed on sentiment ahead of third-quarter earnings season.
Technically, the index is showing clear bearish pressure, and sellers will likely maintain control while the price remains below 23,930.
A short-term corrective rebound toward 24,160 – 24,350 is possible before renewed downside momentum.
If the price closes a 1H or 4H candle below 23,930, it would confirm a continuation of the bearish trend, opening the way toward 23,700 → 23,500 → 23,350.
Conversely, as long as the index trades above 23,930, limited corrections may occur, but overall bias remains weak under current macro headwinds.
Pivot Line: 23,930
Support Levels: 23,700 / 23,500 / 23,350
Resistance Levels: 24,160 / 24,340 / 24,480
Summary:
Fundamental headwinds — from tariff threats to the shutdown’s data vacuum — are fueling pressure on tech stocks.
Technically, bias stays bearish below 23,930, with a potential correction toward 24,350 before continuation to the downside.

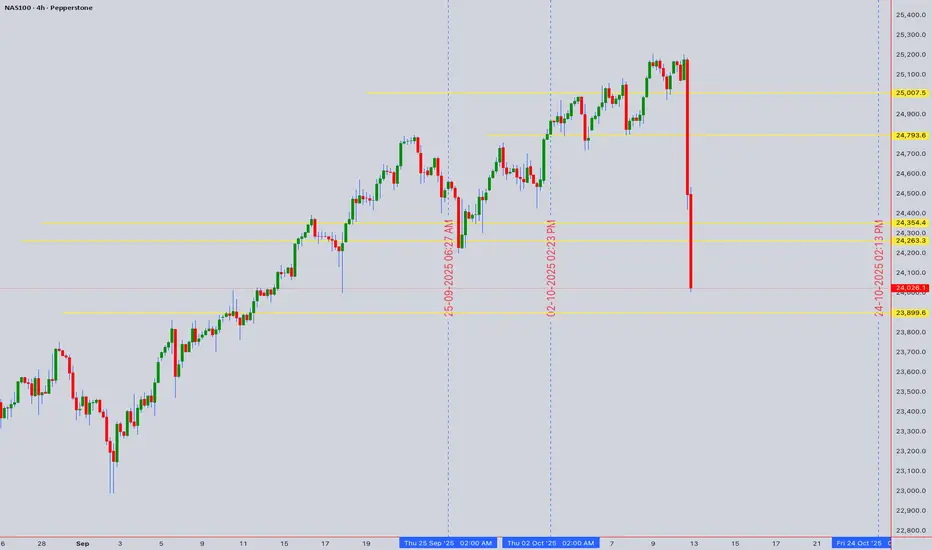
NAS100 Decision Point at All-Time HighsNAS100 Decision Point at All-Time Highs
Asset: NAS100 (NASDAQ 100) 11th Oct 2025 UTC+4
Closing Price: 24,026.1 | Bias: Neutral, awaiting breakout confirmation.
1. Multi-Timeframe Market Structure
Daily Chart Context: The index is in a powerful, sustained uptrend, trading near all-time highs. The recent consolidation suggests a pause within the broader bullish structure.
Critical Resistance: 24,200 - 24,300. A confluence of the recent swing high and a psychological barrier. A decisive daily close above 24,300 is the key bullish trigger.
Key Support Levels:
Immediate: 23,900 (Recent swing low & 4H consolidation base).
Primary: 23,650 - 23,750 (Previous resistance, now key support & 50 EMA area).
Major: 23,400 (Would signal a deeper correction).
2. Chart Pattern & Wyckoff/Elliott Wave Context
Pattern: The price action from the September low exhibits characteristics of a Wyckoff Accumulation phase, followed by a strong markup. The current pause could be a re-accumulation before the next leg up, or a distribution.
Elliott Wave Count: The rally from the ~23,400 low is impulsive. We are likely in a Wave 4 (corrective) consolidation. A break above 24,200 would confirm the start of Wave 5 towards new highs. A break below 23,650 would invalidate this count.
3. Indicator Confluence & Momentum
Ichimoku Cloud (Daily): Price is well above the Senkou Span (Cloud), confirming the strong bullish trend. The cloud itself is thick and rising, providing strong dynamic support.
RSI (14): On the daily, RSI is neutral (~60), not yet overbought, leaving room for further upside.
Bollinger Bands (4H): Price is hugging the upper band, indicating strength. A move to the middle band (~23,950) would be a healthy pullback.
Moving Averages: The 50 EMA (23,850) and 200 EMA (23,500) are bullishly aligned, acting as dynamic support layers.
Actionable Trading Plan
Intraday Trading (Based on 1H/15M Charts)
Bullish Breakout Setup:
Trigger: Sustained price action above 24,150 with rising volume.
Buy Entry: On a pullback to 24,100-24,130, or a break of 24,200.
Stop Loss: Below 24,000.
Targets: 24,300 (TP1), 24,450 (TP2).
Bearish Rejection Setup:
Trigger: Bearish reversal candle (e.g., Shooting Star, Bearish Engulfing) at 24,150-24,200.
Sell Entry: On the confirmation of the rejection.
Stop Loss: Above 24,250.
Targets: 23,950 (TP1), 23,850 (TP2).
Swing Trading (Based on 4H/Daily Charts)
Long Swing Entry:
Condition: Wait for a daily close above 24,300.
Entry: On the next pullback towards 24,200 (new support).
Stop Loss: Below 23,900.
Target: 24,600 - 24,800.
Short Swing Entry (Counter-Trend):
Condition: A clear break and close below 23,900.
Entry: On a retest of 23,900 as resistance.
Stop Loss: Above 24,100.
Target: 23,750, then 23,650.
Risk & Trade Management Note
The current setup is a high-probability bull trap if price fails at the 24,200 resistance. Conversely, a breakout opens significant upside. Do not chase price in the middle of the range. Patience for a confirmed trigger is key. Always use a stop-loss and manage position size accordingly.
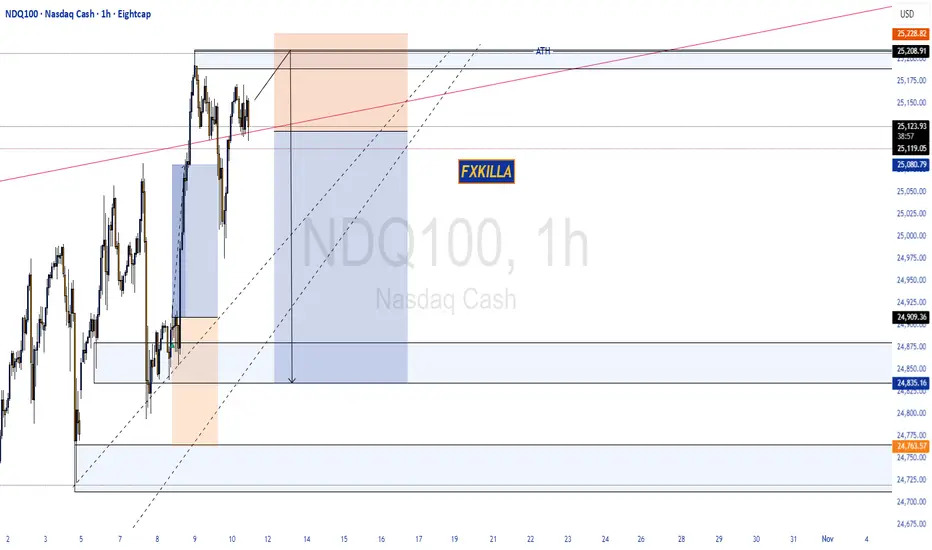
NASDAQ100 HIGH PROBABILITY SETUP SOON!!!🚨 NAS100 HIGH PROBABILITY SELL SETUP 🚨
* Here We Can See Clearly The Next Potential Move For US100 Coming Hours/Days.
* Keep Your Eyes Close On Your Trading Positions.
* Happy PIP Hunting Traders.
FXKILLA.
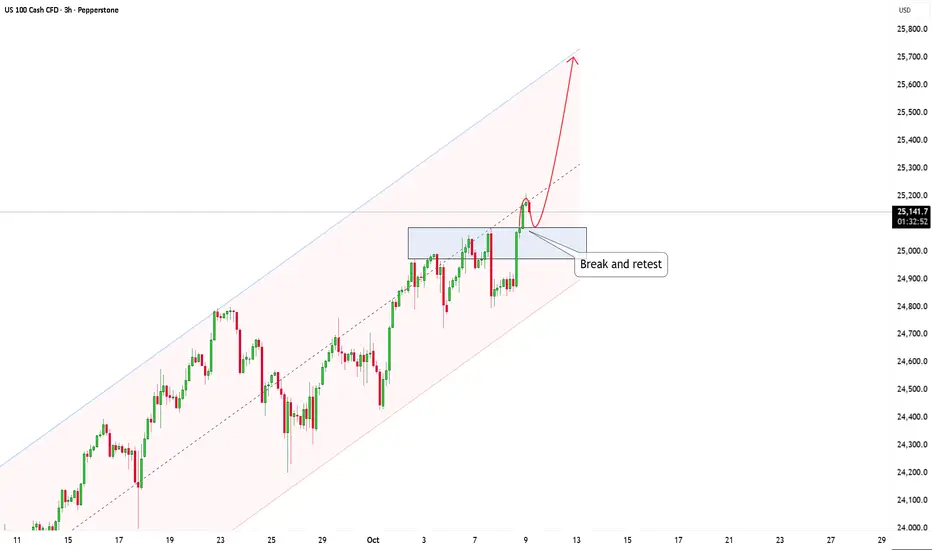
NAS 100: Price Surge Potential After Break and RetestHi everyone, Kilian here!
Let's take a closer look at the NAS 100 on a 3-hour timeframe, as it’s currently showing some interesting movements. The price has been steadily moving within an ascending channel, with the buyers continuing to dominate and push the price higher.
What’s particularly interesting right now is the breakout level. As the price approaches this level, we’ll be watching closely to see if the buyers can maintain control. A break and retest scenario could unfold here. If the price breaks through this level and then comes back to retest it (testing the broken level as support), and the buyers manage to hold it, this would be a strong confirmation that the buyers are still in control, and we could see price continuing to move towards the upper boundary of the channel.
However, if the price drops back below this level after the breakout, this could signal a false breakout, which may lead to a short-term correction as the sellers take control.
Currently, the momentum is still in favor of the buyers, and as long as the price holds above the breakout level, the bullish structure remains intact.
What do you think? Feel free to share your thoughts in the comments!
And remember, discussions within the TradingView community are a great way for all of us to improve our trading skills and grow together.
Bearish Outlook on NQ📉 Bearish Outlook on NQ
After completing the manipulation phase, NQ has tapped perfectly into the Bearish FVG (1H) zone around 25,366.45 – 25,392.25, sweeping both SSLs in the process. This confirms premium-level distribution, suggesting the market is ready for a downside move.
Scenario 1 – Primary (Bearish Bias):
Price rejects from the Bearish FVG 1H, fails to reclaim 25,366.45, and begins its descent. Liquidity below the BSL at 25,293.65 becomes the first target, followed by a clean run toward 25,264.95, completing a liquidity sweep below recent lows.
Scenario 2 – Rejection & Re-Test:
A short-term push above 25,330.55 (NAS100FT) to re-test the Bearish FVG 1H could offer another entry opportunity before the drop resumes toward 25,293.65 and 25,264.95.
Scenario 3 – Deep Liquidity Grab Before Reversal:
Should price tap deeper into the Bullish FVG 4H, we could see a final liquidity sweep below 25,264.95 before a stronger bullish reaction emerges.
🎯 Overall Bias:
Bearish — targeting liquidity below 25,293.65 and 25,264.95. Manipulation phase complete, distribution underway.
Follow and like for more.
Greetings,
MrYounity

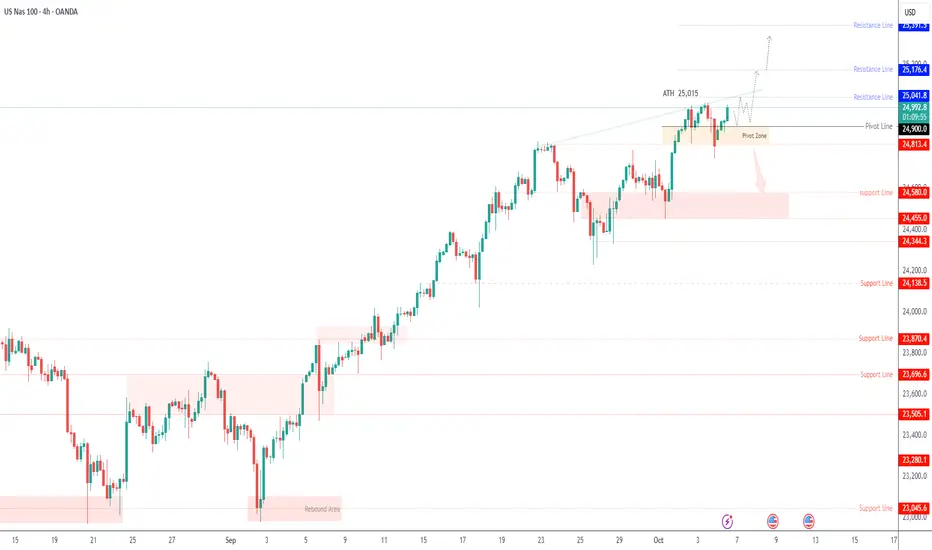
USNAS100 Extends Gains on AI Strength & Fed Cut Hopes?USNAS100 – Overview
Wall Street futures rose on Monday, extending last week’s rally as AI-related optimism and softer labor market data boosted expectations for a Fed rate cut later this year. The upbeat sentiment continues to support risk assets, though volatility remains sensitive to policy headlines.
Technical Outlook
The index has stabilized in a bullish zone, maintaining upward pressure above 24,900, with potential to extend toward 25,175, especially if it breaks 25,040.
To confirm a bearish reversal, the price must close a 4H candle below 24,810, which would expose downside targets near 24,580.
Pivot: 25,040
Resistance: 25,175 – 25,390
Support: 24,810 – 24,590 – 24,450