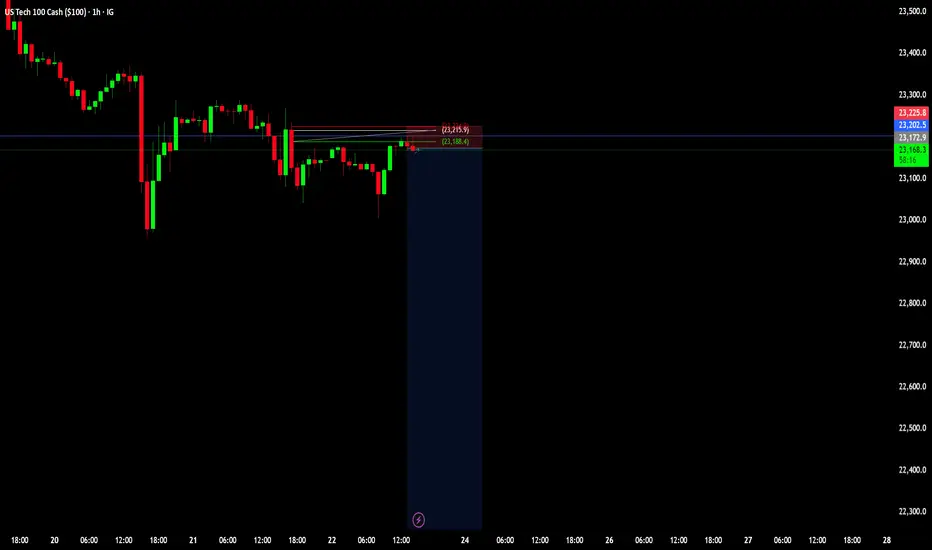
Nas100 technical analysis #NAS100 technical analysis. Price broke out through trend line. Price should continue down trend line acting as support levels now. Price should go down to 23450 area then continue back up.
NASDAQ 100 CFD
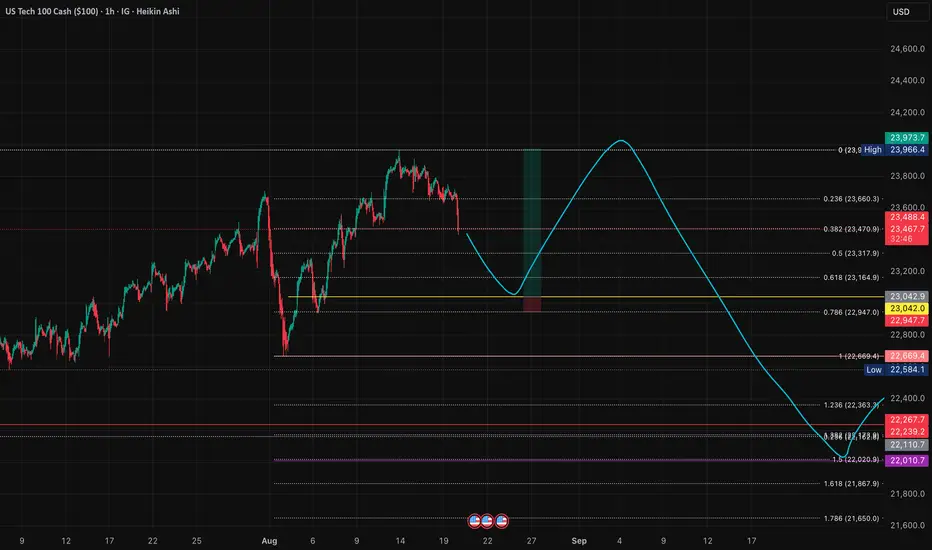
NAS100 Overextended: Support or Further Downside Ahead?The NAS100 is currently overextended following Friday’s strong rally. From a technical perspective, I’m anticipating a potential retracement toward equilibrium, aligning with the 50% Fibonacci level of the prior price swing. This zone will be key in determining whether price establishes support and resumes its bullish continuation, or if a breakdown occurs that could signal further downside risk. (Not financial advice.)

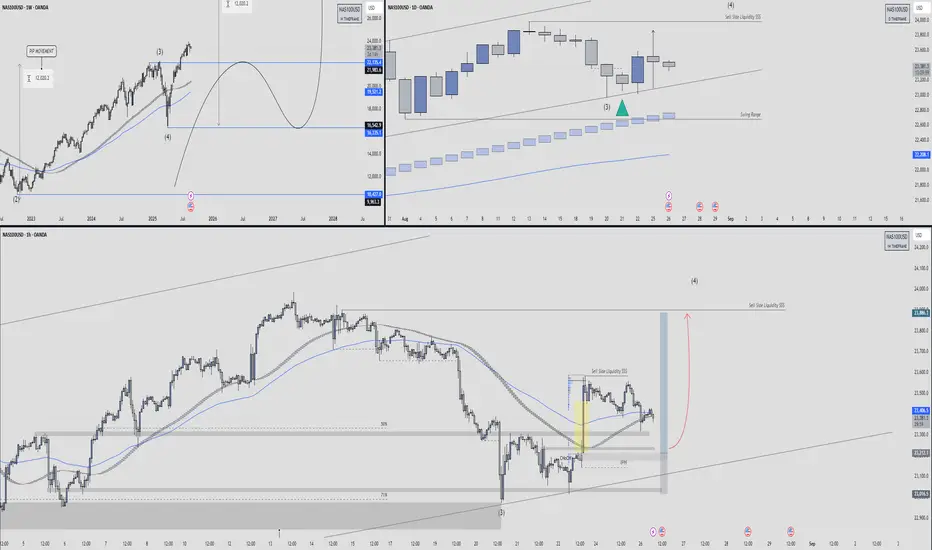
Nas100 Breakdown with Trade Setup🕰 Weekly Structure
Price has completed a Wave (3) high and is now transitioning into a corrective Wave (4) phase.
The broader market cycle suggests sell-side liquidity is being targeted before any new impulsive leg higher.
The EMA structure is still bullish long-term, but retracements are healthy after extended rallies.
Key downside zones:
21,985 – 22,135 (mid-support pocket)
16,962 – 16,353 (deeper retracement if correction extends)
📉 Daily Timeframe
Current daily candles are rejecting the upper levels after tagging swing-high liquidity.
Price is consolidating near the swing range support line (~22,700–23,200).
Buyers are defending the level marked by the green triangle, aligning with a previous Wave (3) pivot.
If this level holds, we may see a relief rally targeting 23,800–24,200 before deciding the next move.
⏱ 1H Short-Term View
Price recently tapped into sell-side liquidity (SSS) and bounced from the 71% fib retracement + demand zone.
A change of character (ChoCH) is visible from the highlighted yellow candle, indicating buyers are stepping in.
Expect a possible bullish leg toward 23,800 – 24,000 if higher-low structure confirms.
If 23,200 fails, downside liquidity sits at 23,000 → 22,700.
🎯 Trade Plan
Bias: Short-term bullish relief rally inside larger corrective Wave (4).
Entry Zone: 23,200 – 23,400 demand retest.
Target 1: 23,800 (SS liquidity pocket)
Target 2: 24,000–24,200 (daily resistance)
Invalidation: Sustained close below 23,000 → opens path to 22,200.
📌 Summary
NAS100 looks corrective after a strong multi-month bullish wave. Near-term, liquidity sweep setups favor a bounce into 23,800+ as long as 23,000 holds. Medium-term, Wave (4) correction could extend deeper into 22k–20k levels before the next major bullish wave.
Possible shorts incoming on ES (S&P 500)Price tapped a daily resistance, and the 1h is bearish. Shorts only with a confirmation

NAS100 - Where will the stock market ?!The index is above the EMA200 and EMA50 on the four-hour timeframe and has re-entered its ascending channel. If this channel is maintained, its upward path to the specified price target will be possible, but before that, the downward trend line must be broken in a valid way. If the channel is lost, the index's downward path will continue to around 23,000 points.
Federal Reserve Chair Jerome Powell’s latest remarks, delivered in a dovish tone, boosted bullish sentiment in financial markets and sparked a new wave of optimism among Wall Street investors and market participants. Following Powell’s speech, U.S. stock benchmarks surged sharply, with capital flows notably directed into the Russell 2000 index of small-cap companies, which jumped 3.86%—its strongest gain since April 9.
During his keynote at the Federal Reserve’s annual symposium, Powell implicitly suggested that an interest rate cut could come as soon as next month. At the same time, he warned of rising inflation risks and signs of slower economic growth, stressing that although risks are relatively balanced, the current environment may require an adjustment in monetary policy. He stated: “Given that monetary policy remains in a restrictive stance, the baseline outlook and the shifting balance of risks may warrant a reassessment of our policy stance.”
Naeem Aslam, chief investment strategist at Zaye Capital Markets, described Powell’s comments as a turning point for markets, saying: “Powell’s dovish tone came as a real surprise to many market participants who did not expect such an approach from the Fed Chair. His remarks were clearly interpreted as a dovish signal.”
Following Powell’s comments, traders raised their expectations for a September rate cut. Barclays revised its forecast and now expects the Federal Reserve to deliver two 25-basis-point cuts this year—in September and December.
Meanwhile, Fitch Ratings affirmed the U.S. sovereign credit rating at AA+ with a stable outlook, a decision made despite significant political uncertainty. According to Fitch, rising trade tariffs, government spending cuts, stricter border controls, and increased deportations have heightened policy uncertainty, weighing on household consumption and business investment.
Fitch projects that the U.S. economy will remain in recession in 2026, growing only 1.5%, as elevated inflation and policy uncertainty continue to dampen consumer spending. However, the agency expects that faster rate cuts that year could boost domestic demand, helping growth rebound to 2.1% in 2027.
This week, two key reports are in focus: the second estimate of Q2 GDP and July’s Personal Consumption Expenditures (PCE) Price Index. The initial GDP estimate showed a 3% expansion, and consensus forecasts anticipate confirmation of this figure. In contrast, the Atlanta Fed’s GDPNow model projects a 2.3% growth rate, which, while lower, still points to economic resilience and suggests no urgent need for accelerated rate cuts—even as political pressure from the White House on Powell continues. Notably, GDPNow will be revised on Tuesday ahead of the official release.
Inflation data, however, carry greater weight. The core PCE index, the Fed’s preferred inflation gauge, has closely tracked core CPI for the past decade. With July’s core CPI climbing from 2.9% to 3.1%, there is a risk that PCE will follow the same path. Such a scenario would signal persistent inflationary pressures and significantly reduce the likelihood of a second rate cut this year.
If these data confirm stronger inflation, the U.S. dollar will likely strengthen further, while equities could come under additional pressure. A slower pace of monetary easing diminishes the present value of future cash flows for growth-oriented companies, explaining why Wall Street’s corrective phase may persist.
On the corporate front, Nvidia’s CEO said that the ability to ship its H20 chip to China is highly valuable and poses no national security concerns. He added that the decision to supply a next-generation AI data center chip to China, which will succeed the H20, is not within Nvidia’s direct control. The company is set to report earnings on Wednesday and remains in discussions with the U.S. government, though no resolution has yet been reached. The CEO also mentioned that his brief visit to Taiwan would mainly involve a dinner with TSMC executives. He revealed TSMC’s new “Rubin” architecture, comprising six new chips, and announced that Nvidia will hold its GTC conference in Washington, D.C. for the first time.
Separately, Meta has halted AI hiring after onboarding more than 50 specialists with lucrative compensation packages. The freeze affects both new hires and internal transfers, unless personally approved by Alexander Wang, head of AI. In recent months, Meta has reorganized its AI division into four separate teams to advance its “superintelligence” projects. Analysts have warned about rising costs and equity grants, framing the hiring pause as part of broader budget control and organizational restructuring efforts.

NASDAQ 100: Bullish, But There Is a Headwind.....Welcome back to the Weekly Forex Forecast for the week of Aug 25 - 29th.
In this video, we will analyze the following FX market: NASDAQ (NQ1!) NAS100
The NASDAQ has a bearish FVG on the Daily TF. Should it fail, buy the pullback to it, as it will invert to a iFVG and support higher prices.
Should it fail, and we will know Monday/Tuesday, sells become valid, down to the Weekly bullish FVG.
Let the market unfold Monday, then look for valid entries.
Enjoy!
May profits be upon you.
Leave any questions or comments in the comment section.
I appreciate any feedback from my viewers!
Like and/or subscribe if you want more accurate analysis.
Thank you so much!
Disclaimer:
I do not provide personal investment advice and I am not a qualified licensed investment advisor.
All information found here, including any ideas, opinions, views, predictions, forecasts, commentaries, suggestions, expressed or implied herein, are for informational, entertainment or educational purposes only and should not be construed as personal investment advice. While the information provided is believed to be accurate, it may include errors or inaccuracies.
I will not and cannot be held liable for any actions you take as a result of anything you read here.
Conduct your own due diligence, or consult a licensed financial advisor or broker before making any and all investment decisions. Any investments, trades, speculations, or decisions made on the basis of any information found on this channel, expressed or implied herein, are committed at your own risk, financial or otherwise.

NAS100USD Analysis – POC Magnet, Demand Zone🔎 Context
Price action on NAS100USD is currently trading within a clearly defined range between the Value Area High (VAH) and Value Area Low (VAL) . Volume Profile highlights a key Point of Control (POC) around 23150 – the price level where the highest amount of trading volume has accumulated in this range.
In Smart Money terms, we also have a refined demand zone forming below, with the proximal line aligning closely above the POC. This overlap strengthens the case for the POC acting as a "magnet" and a potential support base.
⚡ Key Levels
Value Area High (VAH) : ~23880 – range resistance.
Value Area Low (VAL) : ~23010 – range support.
POC : ~23150 – high-volume node, magnetic level.
Proximal Line : Sitting just above POC, marking the edge of demand.
Refined Demand Zone : 22950 – 23050 region.
🏗 Structural Insights
A major structural failure occurred earlier near 23880, confirming supply above.
Price swept liquidity below 23050 before aggressively reclaiming the range.
Current trading sits just above POC and proximal, showing buyers defending.
A break and acceptance above 23510 (mid-range) opens the path back to VAH at 23880.
✅ Trade Scenarios
Bullish Case (Continuation to VAH)
If price sustains above 23516 and holds above the proximal/POC cluster, we can expect a continuation toward VAH (23880).
Targets: 23880 (VAH) → potential extension toward swing high.
Bearish Case (POC Magnet + Demand Retest)
Failure to hold above proximal/POC may drag price back into the POC magnet zone at 23150.
If momentum weakens further, a retest of the refined demand zone (22950 – 23050) is likely.
Below VAL (23010), imbalance could drive a deeper correction.
📌 Conclusion
The confluence of POC (fair value) and proximal demand (structural support) makes 23150 a pivotal level. Holding above it favors a continuation toward 23880 VAH , while a rejection would likely see price revert back to demand.
This setup showcases how Volume Profile levels (POC/VAH/VAL) can be combined with SMC concepts (demand zones & structural breaks) to create a high-probability framework.
💡 Trade safe, manage risk, and always wait for confirmations around these key levels before execution.

Short idea nasdaq spotBased on -
- Correlation between eth and btc with equities shows potential short
- supply zone
- sector rotation (tech weak and small caps strong)
USNAS100 Update | Fed Pressure Keeps Market Under Bearish BiasUSNAS100 – Overview
Tech fright calms but Fed pressure grows
U.S. tech stocks appear to have stabilized after two sessions of sharp declines, but uncertainty persists as the Treasury market reacts to the latest Federal Reserve developments ahead of the central bank’s annual Jackson Hole symposium in Wyoming.
Technical Outlook
USNAS100 maintains a bearish setup while below 23,295.
A break and sustained close above this level would signal a potential bullish reversal.
📍 Key Levels
Pivot: 23,295
Support: 23,165 – 23,045 – 22,850
Resistance: 23,430 – 23,540 – 23,690
previous idea:

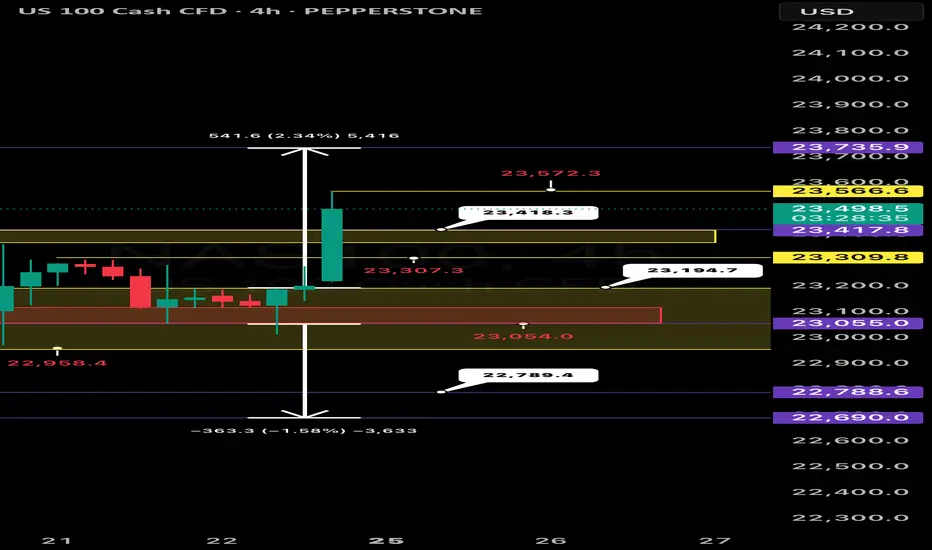
NASDAQ Technicals
NASDAQ (NAS100) Technical Analysis
Based on the 4 hour chart, NASDAQ (NAS100) is currently showing range bound price action, indicating a period of consolidation after a recent downtrend. This price behavior suggests a tug of war between bulls and bears, with neither side able to decisively break through key support or resistance levels.
Key Levels and Price Zones
The market is trading within a defined range. The key support zone is identified around 23,055 to 22,958. This is a critical area, as a clean break below it would signal a continuation of the previous bearish trend. The primary resistance zone is located between 23,309 and 23,418. This zone must be broken and held for a potential bullish reversal to be considered.
Bullish and Bearish Scenarios
* Bullish Scenario: For a bullish trend to resume, the price needs to break above the 23,418 resistance level. A confirmed breakout with a subsequent retest of this level as support could open the door for a move towards the higher resistance at 23,736. Traders should watch for a strong bullish candle closing above this zone and an increase in buying volume to confirm the breakout.
* Bearish Scenario: The bearish outlook remains intact as long as the price stays below the resistance zone. A break below the support zone around 22,958 would be a significant bearish signal. This could lead to a further drop toward the lower range's support at 22,690. A strong bearish candle closing below the support zone would provide confirmation.
Risk Management and Final Thoughts
Given the current consolidation, traders should be cautious about initiating new positions without clear confirmation. The most prudent approach is to wait for a definitive breakout above resistance or a breakdown below support. Trading within the range can be highly volatile and is generally considered higher risk. Placing stop loss orders outside of the key support and resistance zones is crucial to manage potential risks effectively. The current technical screenshot of NAS100 is one of indecision, and a significant move is likely on the horizon once one of the boundaries is breached.

NASDAQ (NQ1!): Started Retracing Last Week. Will It Continue?Welcome back to the Weekly Forex Forecast for the week of Aug 18 - 22nd.
In this video, we will analyze the following FX market: NASDAQ (NQ1!) NAS100
The NASDAQ reached ATHs Tuesday, and retraced for the rest of the week. Will there be some
follow through to open next week? Wait for the market to tip its hand and show you strength or weakness.
If the highlighted +OB fails, look for sells.
If the OB holds, buys until a bearish BOS takes place.
Enjoy!
May profits be upon you.
Leave any questions or comments in the comment section.
I appreciate any feedback from my viewers!
Like and/or subscribe if you want more accurate analysis.
Thank you so much!
Disclaimer:
I do not provide personal investment advice and I am not a qualified licensed investment advisor.
All information found here, including any ideas, opinions, views, predictions, forecasts, commentaries, suggestions, expressed or implied herein, are for informational, entertainment or educational purposes only and should not be construed as personal investment advice. While the information provided is believed to be accurate, it may include errors or inaccuracies.
I will not and cannot be held liable for any actions you take as a result of anything you read here.
Conduct your own due diligence, or consult a licensed financial advisor or broker before making any and all investment decisions. Any investments, trades, speculations, or decisions made on the basis of any information found on this channel, expressed or implied herein, are committed at your own risk, financial or otherwise.

NAS100 falls slightly but conditions are still bullish!NAS100 climbed in a steep ascending trend and my expectation is for a continuation, with an upside target at around 24,000.
It is still clearly moving inside the channel, as predicted previously in my idea:
At 24.000 is where it can become a decision point, where price might correct again, or it pushes more and that’s when we might see the move start to gain more momentum.
But if price breaks below the trendline with conviction, it would invalidate the bullish scenario, suggesting that the uptrend may pause or could even reverse short-term.

NAS100 Analysis – Bullish Channel Break & Retest in Progress📌 Key Highlights:
Bullish Channel Broken: Price failed to respect the upward trend channel. Although the candle bodies held above a support zone, price wicked through to test a lower level – indicating a weakening bullish structure.
Pressure Reversal Zone: Around 23,800, price ran out of momentum. Downward pressure entered the market, shifting the trajectory and breaking the previous bullish pattern.
Confirmed Zones via Retest: Each zone was respected by a clean retest, reinforcing their validity as support/resistance areas. This is textbook price action – confirming zones before continuation.
Current Candle Behaviour: The most recent green candle has no top wick, showing strong buyer conviction. However, the bottom wick is long, meaning bears are still present and applying pressure.
Decision Point: We’re at a critical moment. Will price break above this level to reclaim the channel — or reject and fill the imbalance left behind by the last bullish move?
📉 Scenario 1 – Rejection & Continuation Down
If price fails to break and close above this resistance, we could see a bearish continuation — potentially aiming for the next key support zone around 22,677.
📈 Scenario 2 – Bullish Recovery
If bulls maintain strength and close above this level with volume, we could see price climb back toward 23,500+ to retest the upper zone.
✅ Bearish Bias
Price broke below the bullish channel structure (a major technical shift).
Retests have confirmed lower zones — typical bearish continuation behaviour.
The current green candle has no upper wick (buyers trying to push), but a long lower wick shows bears are still active.
Downward pressure has already shifted momentum, and we’re now waiting to see if the zone holds.
🟡 However – Confirmation Needed
If price fails to break above this current resistance zone, then bearish continuation becomes confirmed.
If price closes strong above this level and reclaims the channel, the bias would shift neutral to bullish again.
📌 Final Bias Statement:
Bearish bias for now — unless price cleanly breaks back above the resistance zone. Current price action suggests a possible continuation down to fill the wick and test deeper support zones.
🧭 Watching for:
Candle body closures above or below key zones
Wick reactions showing liquidity grabs
Momentum shifts in volume
🔔 Stay sharp. Trade with confirmation, not emotion.
By AutoMarkets | Built. Not Begged.

NAS100 BUY TECHNICAL ANALYSIS.nas100 buy technical analysis. price came down and touched support levels and now broke through this bear trend line. now the bear trend line will act as support all the way to resistance levels. gte vip breakout strategy!

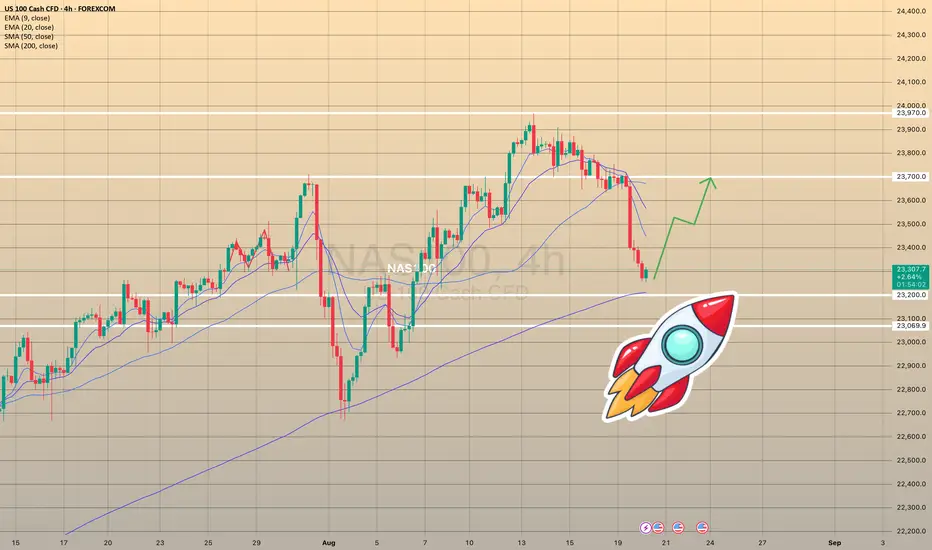
Profit-taking hits NASDAQ100: Uptrend still intact? The NASDAQ100 extended its losing streak as investors keep taking profits in tech stocks
Advanced Micro Devices and Broadcom each lost around 1%. Intel slid over 7%. Apple , Amazon , Alphabet , and Tesla also posted losses. Market volume typically falls in late August, which can lead to wilder swings.
The index has now broken below 23,600 and is trading near 23,300, marking its steepest pullback since late June. The short-term trend that began in mid-July is still possibly intact, with higher highs and higher lows. However, volume on down days suggests sellers are active, which may reinforce near-term downside pressure.

Nasdaq 100 Analysis: Tech Stocks Face Sell-OffsNasdaq 100 Analysis: Tech Stocks Face Sell-Offs
As the chart shows, the Nasdaq 100 index fell by approximately 1.6% yesterday.
According to media reports, bearish sentiment has been fuelled by the approach of key events:
→ the release of the FOMC meeting minutes (today at 21:00 GMT+3);
→ Jerome Powell’s speech at the Jackson Hole symposium on Friday. Market participants are preparing for remarks from the Fed Chair on the trajectory of interest rates.
Notably, the S&P 500 declined less significantly, while the Dow Jones remained virtually unchanged. This suggests that:
→ tech stocks are heavily overvalued due to AI-driven hype;
→ capital shifted yesterday from risk assets (including cryptocurrencies) into so-called safe havens.
Could tech stocks continue to decline?
Technical Analysis of the Nasdaq 100
Analysing the Nasdaq 100 index chart on 5 August, we plotted the main upward channel (shown in blue). It remains valid, as since then the price has:
1→ reached the upper boundary, which (as often happens) acted as resistance;
2→ retreated to the median line, where volatility decreased (a sign of balance between supply and demand), but only briefly.
Yesterday’s low coincided with the lower boundary of the channel.
From a bullish perspective, buyers might rely on:
→ a resumption of the uptrend from the lower boundary (as was the case in early August);
→ support at the 50% retracement level after the A→B impulse (located around the current price area);
→ a rebound from the oversold zone indicated by the RSI;
→ support at the 7 August low of 23,250 (a false bearish breakout remains possible).
On the other hand: the price has confidently broken through the channel median and then accelerated downwards (a sign of imbalance in favour of sellers). This imbalance zone (which, under the Smart Money Concept methodology, is considered a bearish Fair Value Gap) could act as resistance going forward.
Given the pace of yesterday’s decline, we could assume that sellers currently hold the initiative. Should we see weak rebounds (in the style of a dead cat bounce) from the channel’s lower boundary, the likelihood of a bearish breakout could increase.
This article represents the opinion of the Companies operating under the FXOpen brand only. It is not to be construed as an offer, solicitation, or recommendation with respect to products and services provided by the Companies operating under the FXOpen brand, nor is it to be considered financial advice.
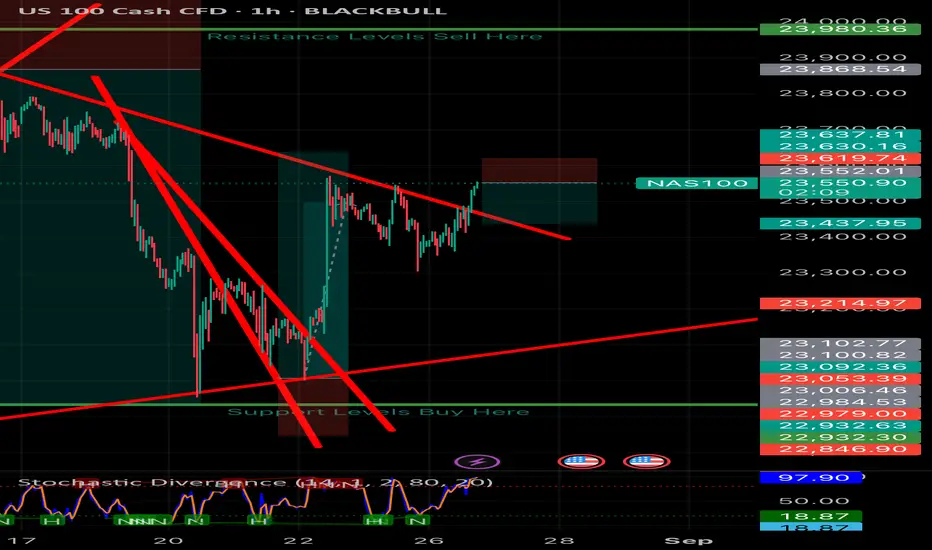
USNAS100 | Geopolitical Tensions & Fed in Focus – Pivot at 23690USNAS100 Overview
Geopolitics dominates before the Fed takes the stage.
Putin’s position remains that Ukraine should cede all territory Russia has occupied — and even areas it has failed to capture in more than three years of fighting. This has been firmly rejected by Zelenskiy and European leaders, who will stand alongside him in Washington when he meets Trump later today.
Technical Outlook:
Price looks set to stabilize below 23690, which would extend the bearish trend toward 23435 and 23295.
A 4H close above 23690 would shift the outlook bullish, targeting 23870.
Pivot: 23690
Support: 23550, 23435, 23295
Resistance: 23870, 24090
NAS100 dropped on 1.32% on August 19NAS100 dropped on 1.32% on August 19 as market participants are waiting for Powell's key rate comments
The Nasdaq and S&P 500 dipped on August 19, led by tech stocks, as investors awaited Federal Reserve Chair Jerome Powell’s comments on interest rates at the Jackson Hole symposium (Aug. 21-23). Analysts, including James Cox of Harris Financial Group, suggest markets are bracing for a possibly hawkish stance from Powell. Interest rate futures indicate two 25 bps cuts this year, starting in September. Concerns also rose over AI stocks after OpenAI’s CEO Sam Altman called them a bubble in a recent "The Verge" interview.
The price continued to drop during Asian and early European trading hours and reached the SMA200 on 4-h chart. This moving average is a traditionally strong support. The further rebound towards 23,500.00 level is expected with a final target of 23,700.00.
NASDAQ: 10:1 R/R Setup - One More High Before Major CorrectionSharing my current outlook on NASDAQ with a high-probability setup offering exceptional risk-reward. 📊
**🎯 The Setup:**
I'm expecting one more push to new all-time highs from the yellow line around 23,000. This would offer a **10:1 risk-to-reward ratio** with the stop loss just below the recent low. 🚀
**📍 Yellow Line Logic:**
This level represents my experience-based zone just shy of the 0.786 Fibonacci retracement. I've observed that when price reaches the 0.786 level, it tends to result in a complete reversal more often than not. This yellow line sits in that "sweet spot" where buyers typically step in. 🎯
**📈 Chart Structure Support:**
The overall chart pattern suggests a higher probability of making new highs rather than a complete reversal from current levels. The structure is bullish despite the recent pullback. ✅
**🔄 Bigger Picture Scenario:**
After the anticipated new high, I expect a significant retracement back toward the previous high (red line area). However, this would likely be just a healthy correction before the bull run resumes for the remainder of the year. 📉➡️📈
**🧠 Key Insight:**
Sometimes the best trades come when the market gives you that "one more push" setup. The risk is small relative to the potential reward, making this a compelling opportunity if the setup materializes. 💡
📈 **This trade setup offers a risk-to-reward ratio of 10:1.** Without including fees, the breakeven win rate for this trade would be approximately 9.09%. Knowing these figures in advance helps me avoid emotional trading. 🧠
💡 **Pro Tip**: If you often find yourself trading based on emotions, I recommend doing this type of pre-planning and quantifying your setups before execution — it can be a simple yet highly effective improvement. ✅
---
**Trading is simple.** You don't need multiple indicators or dozens of lines on your chart. A clean and simple chart often works best — it keeps your decisions consistent and reduces uncertainty. Sure, it might not look flashy, and my analysis may seem a bit "plain" compared to others… but that's how I like it. If you find this analysis useful, feel free to follow me for more updates.
---
*Disclaimer: This post is for general informational and educational purposes only. It does not constitute financial advice, investment recommendation, or a service targeting specific investors, and should not be considered illegal or restricted information in any jurisdiction.*
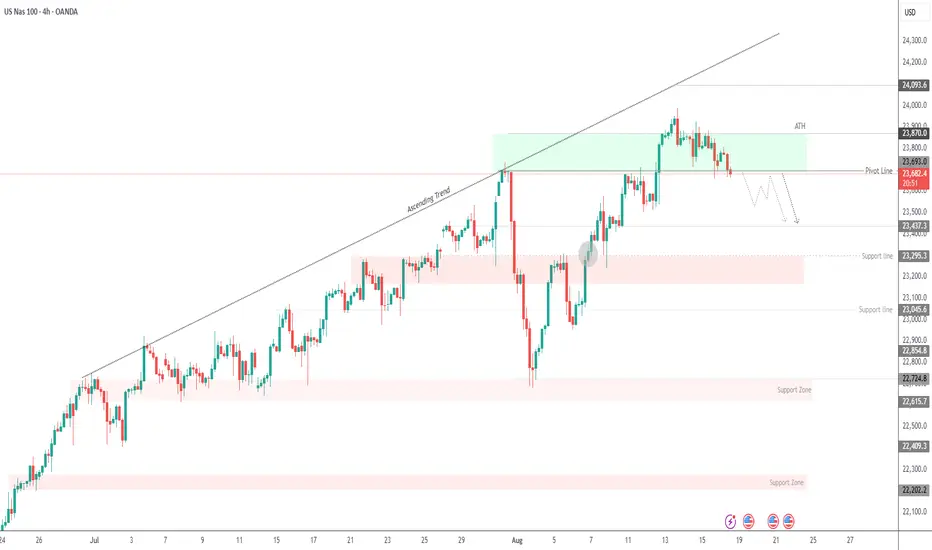
NASDAQ – Is the Top Finally In?In my past two NAS analyses, I argued that the index was overstretched and vulnerable to a deep correction. Even the fact that from the April bottom to mid-August it surged nearly 50% should have raised big red flags — that kind of move rarely sustains without a meaningful pullback.
At this moment, the technical picture has shifted significantly. The index has broken two critical levels:
1. The ascending trendline drawn from the recent low.
2. The horizontal support defined by the previous all-time high.
Losing both of these supports in quick succession suggests the bullish momentum is fading and a top may already be in place.
If this scenario unfolds as expected, selling pressure could intensify in the coming sessions. My first downside target stands in the 22,700 zone, with further weakness possible if the correction develops into a broader risk-off cycle.
Disclosure: I am part of TradeNation's Influencer program and receive a monthly fee for using their TradingView charts in my analyses and educational articles.

USTECH Long Opportunity USTECH has been making some bullish strides and continues the overall bullish trend. Last week, price broke above the major pivot level at $23680 and seems to be maintaining its bullish structure
Price is currently in a retracement and is testing the $23680 level where i am expecting a bounce to the upside in continuation with the bullish trend.
From the higher timeframes price is trading above all 3 SMA and in the bullish region of the RSI. on the 1 hour timeframe, price is maintaining its position above the Bullish support trendline and the 200 SMA which adds to the bullish move i am looking at.
Alternatively if price continues to move down, i am targeting the support level at $23520 where buyers are sitting and having enough momentum to push the market higher.
Looking for long positions from either the $23680 or alternatively the $23520 level.

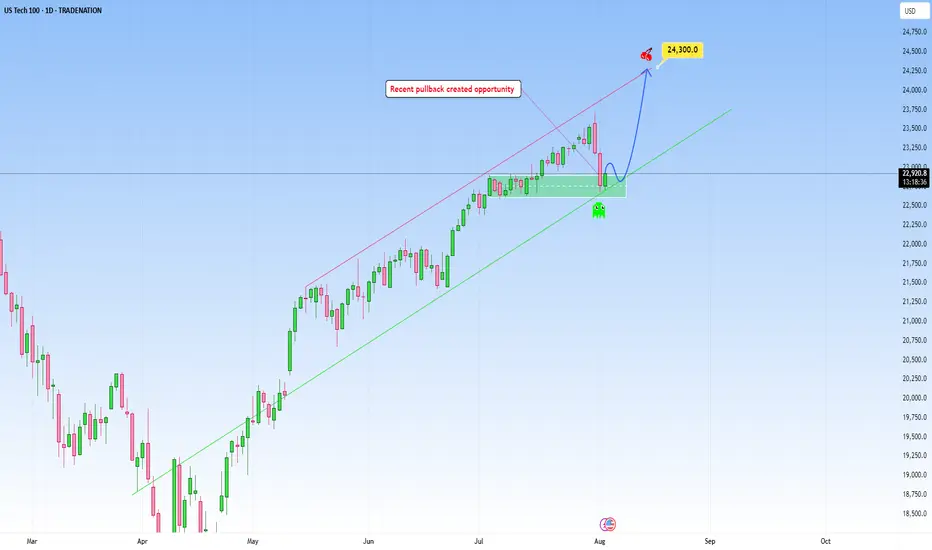
USTEC: Likely continuation following pullbackNAS100 climbed a steep uptrend and my expectation is for a continuation as marked on my chart, with an upside target at around 24,300.
This area here is where it can become a decision point, either price finds support and bounces, or it breaks below, and that’s when we might see the move start to extend lower.
If I were to take a side here, I would definitely choose more upside, but again only price action should determine next move.
But if price breaks below the trendline with conviction, it would invalidate the bullish scenario, suggesting that the uptrend may pause or could even reverse short-term.
Just sharing my thoughts for the charts, this isn’t financial advice. Always confirm your setups and manage your risk properly.
Disclosure: I am part of Trade Nation's Influencer program and receive a monthly fee for using their TradingView charts in my analysis.