NAS100 I Potential break of 25,217 Resistance Welcome back! Let me know your thoughts in the comments!
** NAS100 Analysis - Listen to video!
We recommend that you keep this on your watch list and enter when the entry criteria of your strategy is met.
Please support this idea with a LIKE and COMMENT if you find it useful and Click "Follow" on our profile if you'd like these trade ideas delivered straight to your email in the future.
Thanks for your continued support!
Nas100short

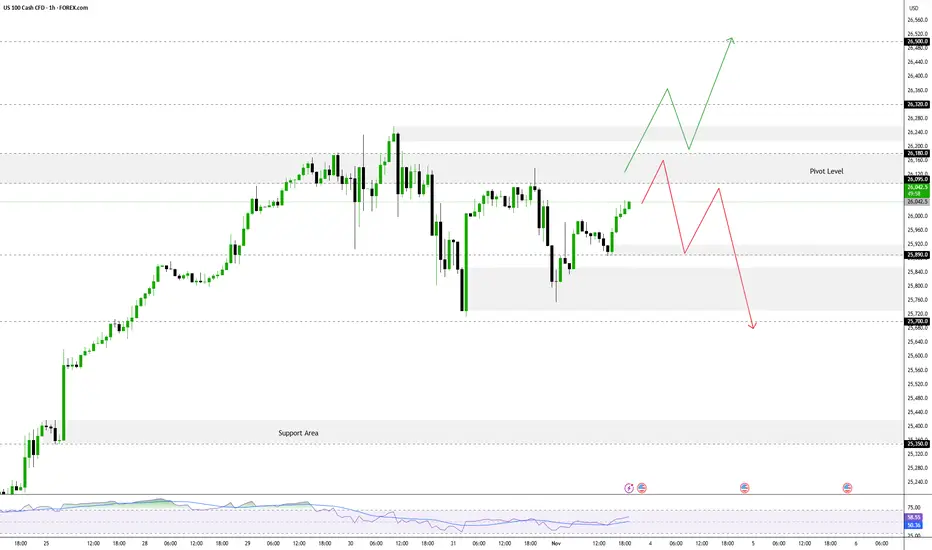
NASDAQ Testing Pivot Zone, Awaiting Breakout The FOREXCOM:NAS100 is currently testing a key zone called the Pivot Zone (a direction-determining area). The short-term trend will be determined by whether the price manages to stay below or break above this zone.
Pivot Zone: 26,095 – 26,180
As long as the price trades below this zone, short-term momentum remains bearish (tending to fall).
➡️ Bearish Scenario
If the price remains below 26,180, the negative bias will continue, with the following main targets:
- Target 1: 25,890
- Target 2: 25,700
- Target 3: 25,340
⬆️ Bullish Scenario
If a breakout and confirmation occurs above 26,180, this could signal the start of a new bullish trend, with the following targets:
- Target 1: 26,500
- Target 2: 26,850
USNAS100 remains bearish below 26,180, but a confirmed break above this level could signal the start of a new bullish leg.
NAS100US100 created a NH as price is changing direction creating a bearish peanant, price to retrace back to resistance before it dumps..Trade safe and be Blessed..

NAS100 Short SetupTrend: Bullish
Divergence: Bearish
Continuation Pattern : None
Reversal Pattern: Double Top
Bias: Bearish
Scenario: Sell Stop at Neckline breakout
Trade Plan
Stop Loss 24750
Entry Level 24400
TP1 24230

E-mini Nasdaq-100 Trading Setup for sellers ^)We have completed cup and handle pattern here...
So after the price is still high!
We may see some price gain additional, something like 13-18% .
So we have two option here for the sellers, wait and sell from marked point 1 or 2 .
P.S. This is very long time range position. ( Something like 200-800 day ).
Have a profit in your day!
Thanks.

NAS100 MAY FORM THE BEARISH HEAD AND SHOULDERS.NAS100 MAY FORM THE BEARISH HEAD AND SHOULDERS.
NAS100 has been trading sideways since the beginning of the week, forming local highs with lows staying at same price for the most part. The price seem to form the Head and Shoulders reversal pattern
What is a Head and Shoulders?
A Head and Shoulders pattern is a reversal chart pattern signaling a potential trend change. It consists of three peaks: two lower "shoulders" and a higher "head" in the middle, connected by a "neckline" (support level). A bullish (inverse) Head and Shoulders forms at a downtrend's end, signaling an uptrend; a bearish Head and Shoulders forms at an uptrend's end, signaling a downtrend.
Currently the SMA50 is pushing on NAS100 from above, while SMA200 is supporting the price. In case the SMA200 on 30-m minutes timeframe gets broken, we may see the decline towards 23,200.00 support level.

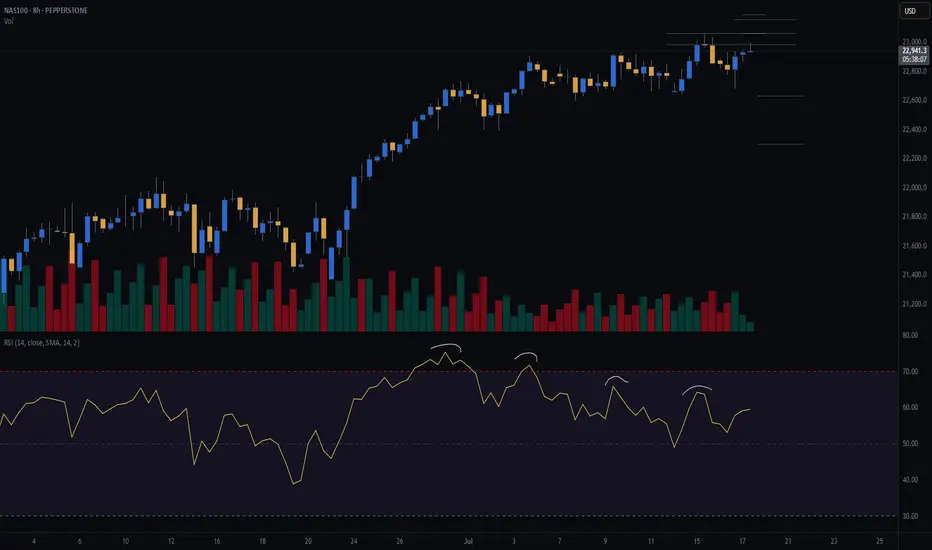
NAS100 (CASH100) SHORT - Double Top H8Risk/reward = 4.6
Entry price = 23 063
Stop loss price = 23 190
Take profit level 1 (50%) = 22 635
Take profit level 2 (50%) = 22 303
Still waiting for confirmation on some variables.
For example, need H8 candle to close in range and volume to validate, amongst other variables.
Nasdaq continuation sellsH4: STILL BULLISH INTERNALLY WITH OUR LAST SIGNIFICANT HL AT 21000
-Possible major chOch on H4 is very possible due to the HTF major zone we at
-Wait for proper H1 & lower tineframe confirmations before jumping in any trades
H1: BEARISH MARKET STRUCTURE STARTING TO PLAY WITH LAST LH AT 21925
-Potential continuation of sells all the way down to take out H4 hl a 21000
-We recently broke below a buying range on H1 & created a selling range
-Possible pullback buys before sells within that range are imminent
M15: We have a nice supply+fvg for sells at 21835
-Wait for price to pullback in there then M1 chOch then attack

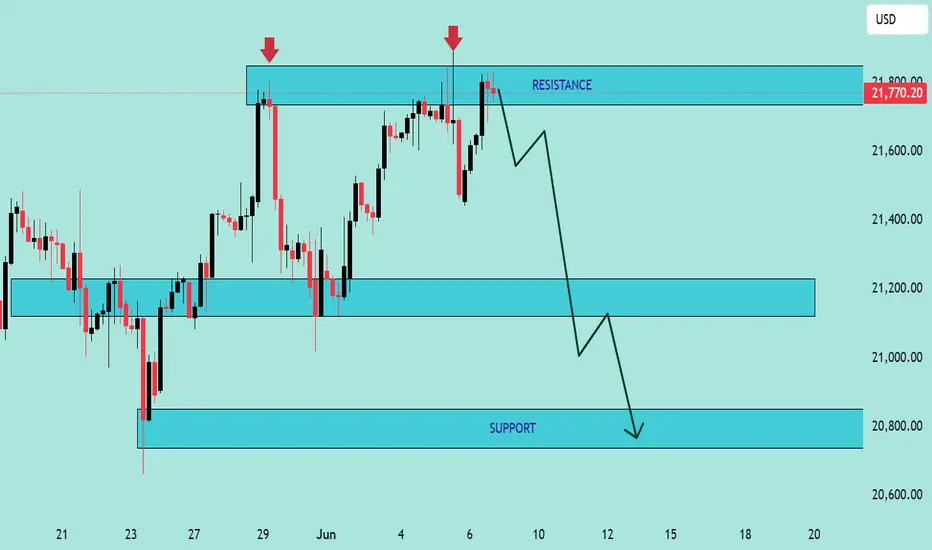
NAS100 Technical Analysis – Bearish Rejection at ResistanceNAS100 Technical Analysis – Bearish Rejection at Resistance 🚨
📅 Date: June 6, 2025
📈 Instrument: NAS100 (US Tech 100 Index)
🔍 Chart Overview:
The price action shows a clear rejection from the 21,800 USD resistance zone, marked by two strong bearish wicks (indicated by red arrows 🔴). This level has proven to be a strong supply zone, as sellers repeatedly step in to push prices lower.
🔵 Key Zones:
🔺 Resistance Zone: 21,750 – 21,800 USD
✅ Multiple rejections and bearish pressure.
🔻 Support Zone 1: 21,100 – 21,200 USD
📍 Acts as a mid-range demand zone and a potential take-profit level for short positions.
📉 Support Zone 2 (Major): 20,700 – 20,850 USD
📦 High-probability bounce area due to historical demand.
🔄 Price Action Insight:
The chart outlines a bearish double rejection pattern at the resistance level.
The current candlestick setup suggests bearish momentum, with a potential drop toward the mid-support zone.
If the price breaks below the mid-support, it could cascade down toward the major support near 20,800 USD.
📌 Projected Move:
🔻 From current levels (~21,750), expect:
Pullback from resistance,
Target 1️⃣: 21,100 USD zone,
Target 2️⃣: 20,800 USD major support.
🚫 A clean break and close above 21,800 invalidates the bearish outlook and may trigger a bullish continuation.
✅ Conclusion:
The chart favors a short bias below the resistance zone. Patience is key—wait for confirmation (like a bearish engulfing or break of structure 📉) before entering positions.
📊 Always use risk management. Set stop-loss above resistance in case of reversal.
NAS100 Sell TradeAfter Yesterday free fall NAS100 Took Support at 21021 level and formed a bearish Flag Pattren, we will take a sell stop entry after the breakout of Pole at 20970 level with SL of LH 21175 our 1st TP will be at 20790 right up side of 1st support and 2nd TP at 20610 2nd Support

SHORT ON NAS100Nice Double Top on NAS at a major resistance level.
I will be selling nas to the next demand level for 2000-3000 points.

NAS100 Turn of the Month Strategy Meets Market Volatility!In this video, we dive into the Turn of the Month Strategy and explore how it could play out in the current market environment. Historically, mutual funds rebalance their portfolios at the end of the month, creating buying pressure that often leads to higher stock prices into the new month. Additionally, recurring financial inflows, such as monthly salary payments and pension contributions, tend to boost market demand during this period.
However, this month presents a unique challenge. The NASDAQ 100 has capitulated into the end of the month, driven by heightened volatility and uncertainty fueled by Donald Trump's rhetoric. With the market currently trading into a significant support zone and liquidity pool, we analyze whether the Turn of the Month effect can counteract the recent bearish momentum.
📊 Key Highlights in the Video:
Price Action Analysis: The NASDAQ 100 is deeply overextended, trading into a critical liquidity pool.
Trade Idea: A potential counter-trend rally could emerge as the market seeks to correct and rebalance.
Strategy: Look for a short-term rally into resistance, followed by a possible shorting opportunity as the market resumes its downward trend.
This video is perfect for traders looking to combine price action trading with seasonal strategies like the Turn of the Month effect. Will the market rally into the new month, or will bearish momentum prevail? Watch now to find out! 🚀

NASDAQ 100 (NAS100) Technical Outlook
NAS100 is currently in a corrective phase, trading at $18,900, with bearish momentum suggesting a potential move toward the $18,300 support level in the coming week. If this level holds, a rebound could push the index back up toward $20,300, creating a temporary recovery phase.
However, if the price struggles at $20,300 and fails to sustain bullish momentum, it would confirm the formation of a descending channel, reinforcing the broader downtrend. In this scenario, NAS100 could extend its decline toward $16,100, where the price may find support.
Key structural levels to watch:
Support Levels: $18,300 → $16,100 → $14,600 (Major support from 2021)
Resistance Levels: $20,300 → $16,000 (Resistance from 2023)
If the index reaches $16,100, this could serve as a critical level where a strong reaction may occur, as it aligns with historical price zones and previous sell-off extensions. The $14,600 support from 2021 remains a last defense level, potentially preventing deeper declines.
Traders should monitor volume and price action confirmations at key levels to assess whether the index is setting up for a reversal or further downside continuation.

NASDAQ Trade Plan: From 4-Hour Trend to 15-Minute Execution!NAS100 Strategy: Using Fibonacci and Market Structure for Precision!
📊 In this NASDAQ (NAS100) trade idea, I focus on a top-down approach starting with the 4-hour chart. If the 4-hour trend is bullish, I look for higher highs and higher lows. If bearish, I focus on lower highs and lower lows. 🔄 My key strategy is identifying pullbacks into equilibrium—around the 50% Fibonacci retracement level—within any price swing. This is my point of interest.
Once price moves into this area, I shift to the 15-minute chart to refine my entry. 🔍 Here, I wait for a break of structure during the pullback, aligning with the overall trend direction. This approach allows for precise execution while staying in sync with the larger trend. 🚀
⚠️ This is not financial advice. Always trade responsibly and manage your risk.

NAS100 short setup alert!Hello traders,
I've identified a prime shorting opportunity on NAS100! As noted in my previous analysis, the index remains under bearish pressure, driven by Apple’s stock decline.
On March 28, 2025, NAS100 broke below 19,100 support zone, confirming strong downside momentum. It then retraced to 19,500, filling an imbalance before facing a rejection.
📉 Trade Setup:
🔻 Sell Zone: 19,200 – 19,350
🎯 Target 1: 18,800
🎯 Target 2: 18,297
🛑 Stop Loss: 19,564
Stay disciplined, trade smart, and secure those profits! 🚀📊

Potential Reversal on the NAS100. key level around 20700.0?The Nas100 has been in a downtrend since mid-February, primarily due to President Trump's tariffs, among other factors. The bearish trend began at a high of 22225.5 and has aggressively declined to 19171.0 without any significant corrections on the 1-day chart. However, currently, the price is forming a correction phase, and I am focusing on the 0.5 Fibonacci level, which is around 20700.0. This level coincides with a previous weekly higher high and higher low area.
Now on the 1D Chart
We can observe that the price bounced from 19171.0. After being choppy for a few days, the price has now broken the lower high structure. It appears that the price is aiming to return to the key level around the 20700.0 area, where we also have the aforementioned weekly levels.
The price seems to be making a gradual approach to the mentioned level, which I find favourable. As this develops on the daily chart, I will continue to monitor this setup in preparation for a bearish sell opportunity, when the price breaks the 1-day correction.
Thank you for reading! 🙋🏼♂️

NAS100 I Potential Gap Fill and More Growth to 21,000Welcome back! Let me know your thoughts in the comments!
** NAS100 Analysis - Listen to video!
We recommend that you keep this pair on your watchlist and enter when the entry criteria of your strategy is met.
Please support this idea with a LIKE and COMMENT if you find it useful and Click "Follow" on our profile if you'd like these trade ideas delivered straight to your email in the future.
Thanks for your continued support!Welcome back! Let me know your thoughts in the comments!

NASDAQ POSSIBLE SHORTSWe could be looking at NASDAQ continuing to take out lows as seen on the 4Hr TF .I would be looking at shorts targeting the lows 19113.3 .. Patience is key ... Drop a comment on what you think , Thanks

NASDAQ SHORTConsidering Friday's PA where there was a liquidity grab,there is high resistance liquidity on the buyside. Formation of a one candle CISD further confirms that we might be bearish for a couple of days.
We will delve into the smaller timeframe (4H & 1H) to have our entry position and our targets will be at 20860 and 20670

Potential bearish drop?NAS100 has reacted off the support level which is an overlap support that lines up with the 23.6% Fibonacci retracement and could drop from this level to our take profit.
Entry: 20,941.46
Why we like it:
There is an overlap support level.
Stop loss: 21,195.49
Why we like it:
There is a pullback resistance level that lines up with the 50% Fibonacci retracement.
Take profit: 20,573.63
Why we like it:
There is a pullback support level that lines up with the 127.2% Fibonacci retracement.
Enjoying your TradingView experience? Review us!
Please be advised that the information presented on TradingView is provided to Vantage (‘Vantage Global Limited’, ‘we’) by a third-party provider (‘Everest Fortune Group’). Please be reminded that you are solely responsible for the trading decisions on your account. There is a very high degree of risk involved in trading. Any information and/or content is intended entirely for research, educational and informational purposes only and does not constitute investment or consultation advice or investment strategy. The information is not tailored to the investment needs of any specific person and therefore does not involve a consideration of any of the investment objectives, financial situation or needs of any viewer that may receive it. Kindly also note that past performance is not a reliable indicator of future results. Actual results may differ materially from those anticipated in forward-looking or past performance statements. We assume no liability as to the accuracy or completeness of any of the information and/or content provided herein and the Company cannot be held responsible for any omission, mistake nor for any loss or damage including without limitation to any loss of profit which may arise from reliance on any information supplied by Everest Fortune Group.

NAS100 Sell setup updateOn our last analysis of NAS100, we were bearish for the longer term and we were waiting for price to reach our area of interest where we would be looking for selling opportunities. Price did indeed push till our area of interest and we managed to place sell trades as per our strategy.

NAS100 hello friends
Due to the severe fall and structural change that has been formed.
Now we are waiting for the pullback after it has been hit.
It can continue to fall until the specified areas.
Capital management should be followed.
Be successful and profitable.

NAS100USD Shooort!This index has been forming a rising flag for the past few hours(IMO a strong bearish momentum), ever since it touched its new lower low.
Let us wait and see if the price will breakout of the trend, retest the lower trendline so that we can have an entry position.
