NASDAQ100 WATCH FOR HIGH PROBABILITY BUY SETUP SOON!!!🚨 NAS100 HIGH PROBABILITY BUY SETUP 🚨
* Here We Can See Clearly The Next Potential Moves For US100 Coming Hours/Days.
* Keep Your Eyes Close On Your Trading Positions.
* Happy PIP Hunting Traders.
FXKILLA.
Nas100signal

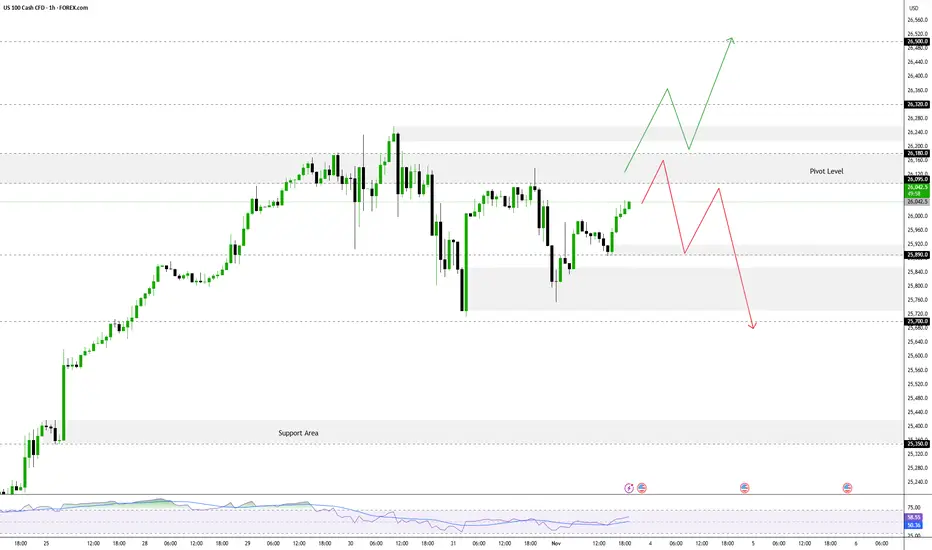
NASDAQ Testing Pivot Zone, Awaiting Breakout The FOREXCOM:NAS100 is currently testing a key zone called the Pivot Zone (a direction-determining area). The short-term trend will be determined by whether the price manages to stay below or break above this zone.
Pivot Zone: 26,095 – 26,180
As long as the price trades below this zone, short-term momentum remains bearish (tending to fall).
➡️ Bearish Scenario
If the price remains below 26,180, the negative bias will continue, with the following main targets:
- Target 1: 25,890
- Target 2: 25,700
- Target 3: 25,340
⬆️ Bullish Scenario
If a breakout and confirmation occurs above 26,180, this could signal the start of a new bullish trend, with the following targets:
- Target 1: 26,500
- Target 2: 26,850
USNAS100 remains bearish below 26,180, but a confirmed break above this level could signal the start of a new bullish leg.
NASDAQ100 HIGH PROBABILITY SETUP SOON!!!🚨 NAS100 HIGH PROBABILITY SELL/BUY SETUP 🚨
* Here We Can See Clearly The Next Potential Moves For US100 Coming Hours/Days.
* Keep Your Eyes Close On Your Trading Positions.
* Happy PIP Hunting Traders.
FXKILLA.

NAS100 H4 | Bullish Bounce from Key SupportNAS100 is falling towards the buy entry at 24,804.95, which is an overlap support that is slightly below the 38.2% Fibonacci retracement and could bounce from this level to the upside.
Stop loss is at 24,423.43, which is a pullback support.
Take profit is at 25,500.67, which lines up with the 127.2% Fibonacci extension.
High Risk Investment Warning
Trading Forex/CFDs on margin carries a high level of risk and may not be suitable for all investors. Leverage can work against you.
Stratos Markets Limited (tradu.com ):
CFDs are complex instruments and come with a high risk of losing money rapidly due to leverage. 65% of retail investor accounts lose money when trading CFDs with this provider. You should consider whether you understand how CFDs work and whether you can afford to take the high risk of losing your money.
Stratos Europe Ltd (tradu.com ):
CFDs are complex instruments and come with a high risk of losing money rapidly due to leverage. 66% of retail investor accounts lose money when trading CFDs with this provider. You should consider whether you understand how CFDs work and whether you can afford to take the high risk of losing your money.
Stratos Global LLC (tradu.com ):
Losses can exceed deposits.
Please be advised that the information presented on TradingView is provided to Tradu (‘Company’, ‘we’) by a third-party provider (‘TFA Global Pte Ltd’). Please be reminded that you are solely responsible for the trading decisions on your account. There is a very high degree of risk involved in trading. Any information and/or content is intended entirely for research, educational and informational purposes only and does not constitute investment or consultation advice or investment strategy. The information is not tailored to the investment needs of any specific person and therefore does not involve a consideration of any of the investment objectives, financial situation or needs of any viewer that may receive it. Kindly also note that past performance is not a reliable indicator of future results. Actual results may differ materially from those anticipated in forward-looking or past performance statements. We assume no liability as to the accuracy or completeness of any of the information and/or content provided herein and the Company cannot be held responsible for any omission, mistake nor for any loss or damage including without limitation to any loss of profit which may arise from reliance on any information supplied by TFA Global Pte Ltd.
The speaker(s) is neither an employee, agent nor representative of Tradu and is therefore acting independently. The opinions given are their own, constitute general market commentary, and do not constitute the opinion or advice of Tradu or any form of personal or investment advice. Tradu neither endorses nor guarantees offerings of third-party speakers, nor is Tradu responsible for the content, veracity or opinions of third-party speakers, presenters or participants.

NASDAQ NAS100 Trade Plan: VWAP & Volume Profile StrategyI’m currently watching the NASDAQ #100 (#NDX) 📊. After a strong correction due to geopolitical turmoil 🌍, the market rebounded just as aggressively. Right now, price is trading above VWAP 📈. If it stays above VWAP, I’ll be looking for a long opportunity.
In the video, we zoom into a 30-minute timeframe ⏱️, using VWAP and Volume Profile to plan the trade. If price respects these levels, we can take a long. If it falls below the support level ❌, we abandon this idea.
⚠️ Disclaimer: This is for educational purposes only and not financial advice.

NAS100 Analysis: Trend, VWAP, Three-Drive Pattern, and Fibonacci📹 In this video, we take a detailed look at the NASDAQ/NAS100, which is currently in a strong bullish trend 📈. While the momentum is impressive, price may now be overextended, so caution is important ⚠️.
🔎 I share how I incorporate the VWAP, three-drive patterns, and the Fibonacci retracement tool to help plan high-probability trades 🎯.
📊 We also cover trend analysis, price action, and market structure, giving you a full breakdown of how these indicators work together to identify potential setups 🚀.
⚠️ Disclaimer: This content is for educational purposes only and not financial advice. Always trade responsibly and manage your risk.

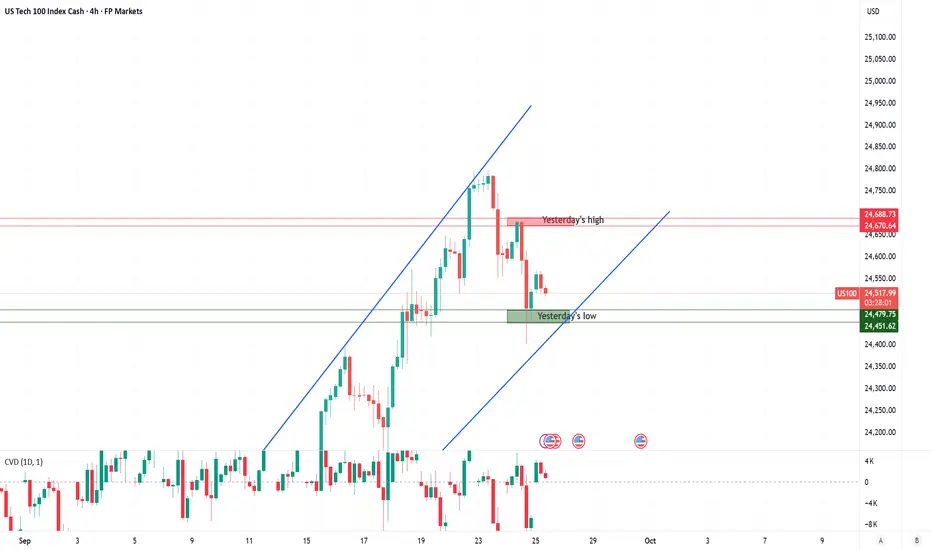
Nas100: Trading Levels in FocusKey Zones in Play
Zone 1 – Yesterday’s High:
Yesterday’s high represents the level where buyers lost momentum and sellers stepped in. If price revisits this zone, traders should expect potential supply pressure. A clean break and sustained hold above would signal renewed strength and could re-ignite bullish momentum.
Zone 2 – Yesterday’s Low:
This zone is the lower boundary of the previous session and now acts as short-term support. Buyers may defend this level to maintain structure, but its reliability is limited given the fresh all-time high environment and lack of historical confirmation. A decisive break below would weaken the bullish case and could invite deeper retracement.
Conclusion:
With US100 trading close to record highs, these zones provide useful guidelines, but they should not be treated as precise buy or sell triggers. In uncharted territory, reactions are often more volatile, making it essential to treat these levels as reference points rather than absolute decision zones.
Morning Sentiment Brief
Market sentiment remains cautiously optimistic. The recent Fed rate cut and ongoing enthusiasm around AI investments continue to underpin a bullish narrative, keeping the US100 near record highs. However, Powell’s cautious tone this week, stressing data-dependence and warning about stretched equity valuations, has cooled some of the initial euphoria.
Traders are now balancing optimism with prudence. Tech momentum is intact, but profit-taking and sector rotation show that conviction is more selective. Political and regulatory headlines add another layer of uncertainty, leaving the market more sensitive to incoming catalysts. Overall, the bias stays positive, but participants are trading with more caution as the index moves in uncharted territory.
NASDAQ NAS100 Analysis: Three-Drive Pattern, VWAP & Trade Plan📊 The NASDAQ 100 has been riding a strong bullish trend, pushing higher with relentless momentum. On the daily timeframe, price now looks heavily overextended 📈.
🔎 Zooming into the 4-hour chart, the overextension is even more apparent. In trending markets, we often observe a three-drive pattern (sometimes a fourth) before an aggressive correction occurs.
⚡ I’m keeping an eye out for a sharp pullback. If price finds support and confirms with a bullish break of market structure, this could present a high-probability long entry setup 🚀.
📹 In the video, I also dive into how I use the VWAP and Fibonacci retracement tools. Both are powerful indicators that provide valuable insight and a trading edge 🔧.
⚠️ Disclaimer: This analysis is for educational purposes only and not financial advice. Always trade responsibly and manage your risk.

Nas100 – Today's Trading Zones Analysis 17 sep.Trading Zones
As price trades around all-time highs, the amount of historical data to build strong zones is limited. This makes the current levels less reliable, and traders should approach them primarily as guidance rather than decisive turning points.
Zone 1 – All-Time High / Yesterday’s High:
This area marks the recent record peak. While it can act as resistance in the short term, its strength is uncertain due to limited data. Price reactions here may be volatile and driven more by sentiment than structure.
Zone 2 – Yesterday’s Low:
A lighter support level that can provide intraday reactions but lacks deep structural confirmation. Best used as a reference point rather than a major decision area.
Zone 3 – Strong Support / High Profitability for Momentum:
This is the most significant zone on the chart, where strong buyers have previously stepped in. It carries a higher probability of triggering a strong reaction. That reaction could unfold as a bounce higher if demand holds, or as a sharp move lower if the zone breaks decisively.
All eyes are on today’s Fed meeting , where markets widely expect a 25bp rate cut. While the move is largely priced in, the real focus will be on Powell’s tone and the updated dot plot, which will guide expectations for the pace of easing ahead. Sentiment in the US100 remains cautiously optimistic, supported by strong tech momentum and softer inflation data, but with price trading at record highs, volatility is likely to spike if the Fed delivers any surprises.

NAS100 Pullback into Fibonacci Zone: Watching for Bullish Break📊 NASDAQ 100 (NAS100) Update 📊
The NAS100 is in a strong bullish trend 🟢📈, clearly visible on the 4H chart ⏰ with consistent higher highs and higher lows 🔼🔼.
Currently, price has pulled back 🔽 right into my optimal entry zone 🎯 based on the Fibonacci retracement 🔢. From here, I’ll be watching closely for a bullish break of structure (BOS) 🔓 on the 15M timeframe ⏰ — that would be my signal to look for a long entry 🚀.
⚠️ This breakdown is educational only and not financial advice. 📚

NAS100 Trend Analysis: From Higher Highs to a Potential Shift📊 NASDAQ 100 (NAS100) Analysis 📊
Someone recently asked me to cover the NAS100 🤔 as price action can look a little confusing right now. On the 4H chart ⏰, we’ve been trending strongly 🟢📈 throughout the week. However, as we head into the end of the week 📅, things are starting to shift.
Zooming into the 30M timeframe 🔍, price action is showing early signs of weakness ⚠️. We’ve had a high, then a higher high ⬆️, and now a lower high 🔽 — instead of a continuation of higher highs.
In the video, we take a deep dive 🎥 into market structure 🏗️, price action 💡, and the trend 📊, highlighting what to watch out for as institutions and big players wind up or unwind positions 💼 into the week’s close.
💬 Your thoughts and comments are welcome!
⚠️ This is educational only and not financial advice. 📚

NAS100 - Trading Zones and Market SentimentZone 1 – 23,926 – 23,943
This is a critical resistance area sitting just below the all-time high. Sellers are likely positioned here, making it a strong zone for potential rejection. A clean breakout and successful retest, however, would flip the zone into demand and open the path toward fresh highs.
Zone 2 – 23,854 – 23,880
Formed around recent consolidation and breakout structure. Buyers are expected to defend this zone on pullbacks, creating potential long opportunities. If broken decisively, it could turn into resistance, signaling weakening momentum.
Zone 3 – 23,782 – 23,798
A deeper demand level aligned with prior absorption and intraday lows. Likely to attract liquidity sweeps and sharp reactions on first touch. A failure here would shift control back to sellers and suggest a larger corrective move.
Sentiment in US100 Today: Between Optimism and Caution
Retail investors pull back from most Big Tech, except Nvidia and Palantir.
According to Charles Schwab’s STAX activity, retail investors have generally reduced exposure to large-cap tech stocks, with the exception of Nvidia and Palantir, which both saw significant net buying. This points to rising risk appetite, particularly toward select growth names in the tech sector.
Job revision data weakens the economy, but keeps rate expectations alive.
Wall Street remains subdued but continues to lean on the likelihood of a Fed rate cut, after job growth was revised down by nearly 1 million over the past 12 months.
Conclusion: Sentiment in the US100 remains cautiously optimistic, driven by a strong tech sector and dovish Fed expectations but the foundation is fragile, especially in light of weaker economic signals.

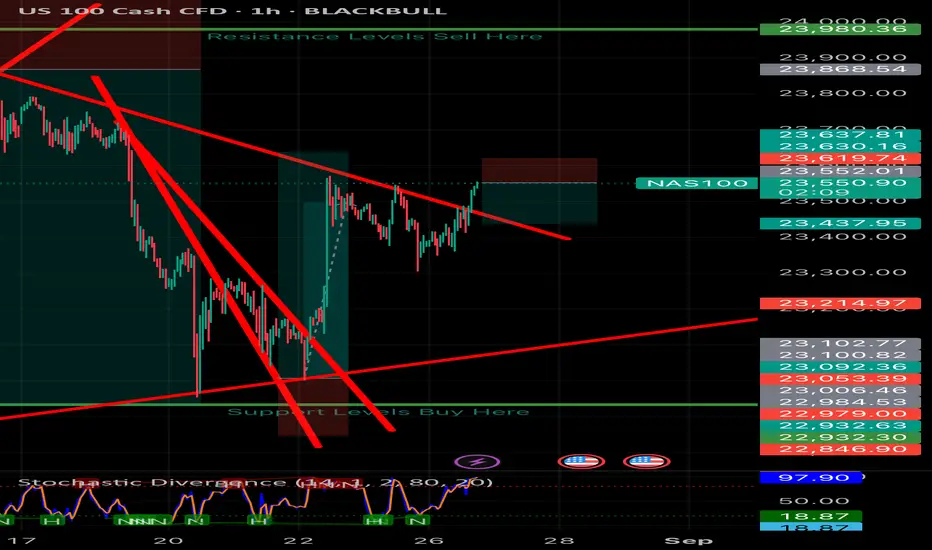
Nas100 technical analysis #NAS100 technical analysis. Price broke out through trend line. Price should continue down trend line acting as support levels now. Price should go down to 23450 area then continue back up.
NAS100 Overextended: Support or Further Downside Ahead?The NAS100 is currently overextended following Friday’s strong rally. From a technical perspective, I’m anticipating a potential retracement toward equilibrium, aligning with the 50% Fibonacci level of the prior price swing. This zone will be key in determining whether price establishes support and resumes its bullish continuation, or if a breakdown occurs that could signal further downside risk. (Not financial advice.)

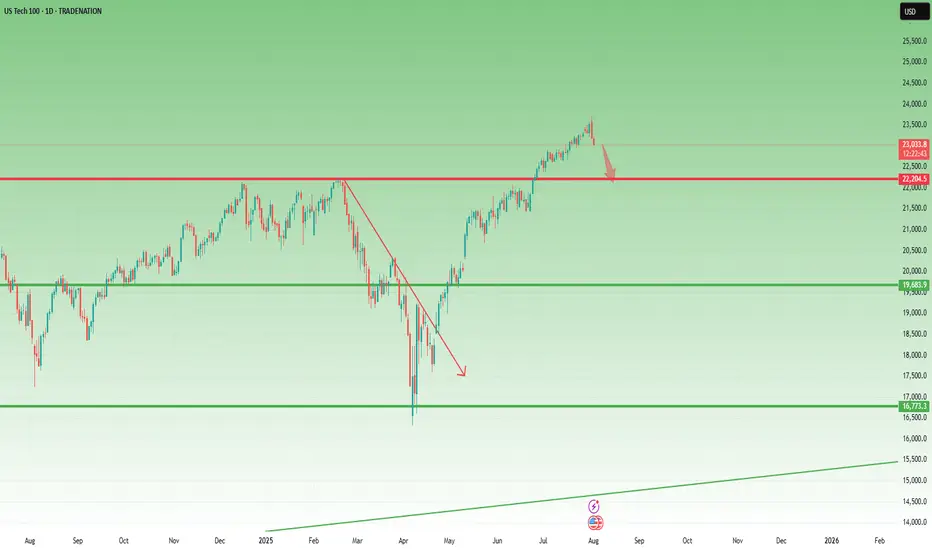
NASDAQ – Is the Top Finally In?In my past two NAS analyses, I argued that the index was overstretched and vulnerable to a deep correction. Even the fact that from the April bottom to mid-August it surged nearly 50% should have raised big red flags — that kind of move rarely sustains without a meaningful pullback.
At this moment, the technical picture has shifted significantly. The index has broken two critical levels:
1. The ascending trendline drawn from the recent low.
2. The horizontal support defined by the previous all-time high.
Losing both of these supports in quick succession suggests the bullish momentum is fading and a top may already be in place.
If this scenario unfolds as expected, selling pressure could intensify in the coming sessions. My first downside target stands in the 22,700 zone, with further weakness possible if the correction develops into a broader risk-off cycle.
Disclosure: I am part of TradeNation's Influencer program and receive a monthly fee for using their TradingView charts in my analyses and educational articles.

NAS100 3 Drive Pattern Correction Wait For BoS📊 The NAS100 has pulled back after a strong bullish run and is currently facing some pressure 📉. I’m watching a three-drive pattern that appears to have extended into a fourth drive, followed by a corrective phase 🔄. From a smart money perspective, liquidity is often targeted after a strong expansion in trend — patterns like the three-drive can frequently lead to a deeper retracement before the continuation resumes. With that in mind, I’m anticipating the possibility of a further pullback before positioning for a potential long setup on a bullish break of structure 🚀 (not financial advice).

Nas100 sell opportunity Nas100 technical analysis. Nas100 price recently reached an all time high. Price is at resistance levels and has also broke through upward trend line which is strong indicator that price will continue down to main support levels over the next week.

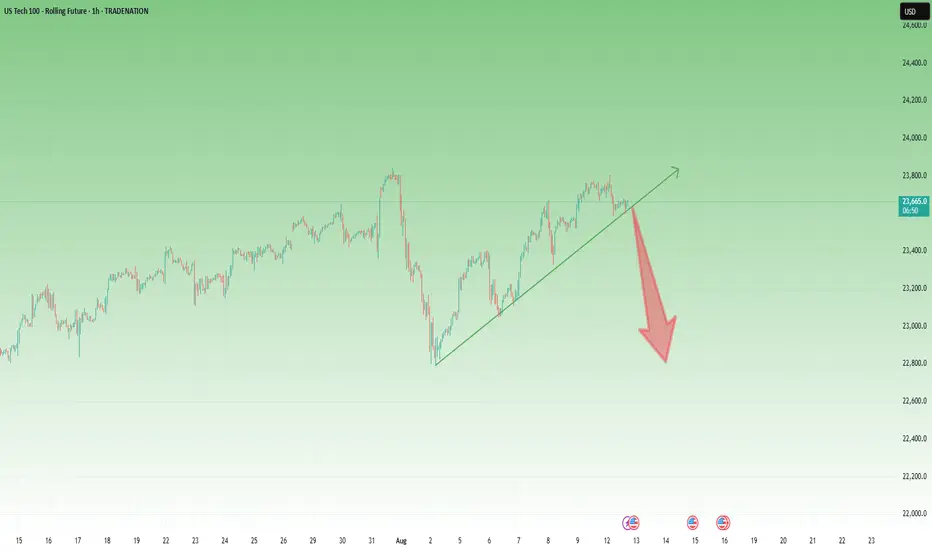
US100 – Dark Cloud Cover Signals Possible Reversal AheadAfter the drop to 22,800, NAS100 recovered strongly and yesterday retested the recent ATH in the 23,800 zone.
However, by the close of the trading day, the index erased the entire intraday advance and closed in the red – leaving a Dark Cloud Cover candlestick formation on the daily chart.
As explained in my previous analysis, I believe the US indices are ready for a deeper correction after the incredible run-up since April.
Technical Outlook:
• The US100 is still holding above its recent ascending trend line.
• A confirmed break below this trend line could trigger an acceleration in selling pressure.
• The first downside target for bears is the recent low at 22,800.
• In the medium term, if a full reversal unfolds, I would not be surprised to see the index trading near 20,000 within the next 2–3 months.
The market has been on an extraordinary bullish streak, but this candle formation combined with extended price action could be the first sign that momentum is shifting.
Disclosure: I am part of TradeNation's Influencer program and receive a monthly fee for using their TradingView charts in my analyses and educational articles.
NAS100 Trade Idea: Liquidity Sweep & Bullish Reversal Potential📊 NASDAQ 100 (NAS100) Trade Outlook 📈
The NASDAQ 100 is holding a strong bullish trend on the higher timeframes 🟢. However, we’re currently seeing a notable pullback into a key support zone ⚠️ — price has dipped beneath previous lows, tapping into what appears to be an institutional accumulation range 🏦.
This move is likely targeting the liquidity resting below those lows 💧, where sell stops are positioned. Price is also reacting off a significant bullish order block 🧱 — a confluence area that could produce a strong reversal.
🎯 What to look for next:
Wait for a bullish break in market structure 🔁 to confirm a potential entry. If that occurs, consider a long setup with your stop loss below the swing low 🛑 and a 1:2 risk-to-reward target 🎯.
🚫 This is for educational purposes only and not financial advice.

Fibonacci Retrace Strategy NAS100 Trade Idea📈 NASDAQ 100 (NAS100) is holding a strong bullish trend 🚀. After a weekend gap-up 🕳️➡️📈, price retraced back into the gap zone—exactly what you'd expect in a healthy trending market.
🔍 I'm applying my Fibonacci Expansion + Retrace Strategy 🔢, watching closely for a pullback into equilibrium ⚖️ within the previous price swing. That’s where I’ll be waiting for a bullish market structure break 🔓📊 to confirm my long bias.
🧠 Patience is key here—let the setup come to you.
📌 As always, this is not financial advice!

Top in Place? NASDAQ100 Signals Exhaustion After Incredible Run📈 The crazy run since April
NASDAQ100 has had a spectacular run since early April, when the index dipped to 16,300 amid rising tensions caused by Trump’s tax war. From that low, we’ve seen a mind-blowing rally of over 7,000 points, which translates to a 40% gain in just 4 months.
Such a rise is not just impressive— it’s overextended , especially by historical standards. Markets don’t move in straight lines forever, and this one might be showing signs of fatigue.
🕯️ Bearish signal at the top
Fast forward to this week: yesterday, the index marked a new all-time high at 23,700, but closed the day with a strong bearish engulfing candle — one that wipes out the gains of the previous 4 trading sessions.
This is not a small technical detail. Such candles, when appearing after an extended rally, often signal exhaustion and a potential shift in momentum.
❗ Top in place?
In my opinion, there's a high probability that a top has been set, at least temporarily. We might be looking at the beginning of a healthy correction, or even something more meaningful, depending on follow-through in the next sessions.
📉 Where to next?
The first major support to watch is the 22,200 level.
I expect that zone to be tested soon — and honestly, considering how much the index has gone up, this shouldn’t surprise anyone. It’s nothing more than a minor pullback, all things considered.
🧠 Stay smart!
When markets go vertical, it pays to stay disciplined and realistic. Tops rarely announce themselves, but when signals like this appear, it’s wise to listen.
Disclosure: I am part of TradeNation's Influencer program and receive a monthly fee for using their TradingView charts in my analyses and educational articles.
NAS100 Bullish Setup: Clean Structure & Entry Zone Pending📊 NASDAQ 100 (NAS100) remains bullish, showing a clean, well-structured uptrend—higher highs and higher lows 🔼📈.
Price has now pulled back into my optimal entry zone 🎯. At this stage, I’m waiting for a bullish break in market structure before considering an entry 🟢🔓.
Patience is key—let the structure confirm first.
Not financial advice ❌💼

NASDAQ 100: AI Momentum and Resilient Earnings Drive New HighsThe NASDAQ 100 continues its strong uptrend 📈, recently breaking to new highs after a period of consolidation. The rally is broad-based but remains led by heavyweight tech names and AI-related stocks 🤖.
Key Fundamental Drivers:
AI & Tech Growth 🤖💡: The biggest catalyst is the ongoing boom in artificial intelligence and digital transformation. Companies in the index, especially the “Magnificent Seven” (like NVIDIA, Microsoft, Apple), are seeing robust earnings growth and strong investor demand for AI exposure. Global IT spending is projected to grow by over 9% in 2025, with AI spending up nearly 30% year-on-year.
Earnings Resilience 💪💰: Despite high interest rates and inflation, tech companies have adapted well, maintaining strong margins and growth. The sector is expected to remain a top performer through 2025.
Fed Policy & Rate Expectations 🏦🔮: Markets are increasingly pricing in a pause or even cuts in US interest rates later in 2025, which is bullish for growth stocks and tech-heavy indices like the NASDAQ 100.
Geopolitical & Macro Factors:
Reduced Uncertainty 🌏🕊️: The market has absorbed major geopolitical shocks (such as the Israel-Iran conflict and US-China trade tensions), and the resolution or de-escalation of these risks has reduced uncertainty, supporting risk assets.
US Election & Policy 🇺🇸🗳️: The outcome of the US election and expectations for stable or pro-business policies have also contributed to positive sentiment.
Global Supply Chains & Resilience 🌐🔗: While some risks remain (e.g., cyber threats, regulatory changes, and supply chain disruptions), the tech sector’s global reach and adaptability have helped it weather these challenges.
Why is it rallying now?
AI optimism and strong tech earnings are the main drivers 🤖💹.
Expectations of easier Fed policy and a resilient US economy are fueling risk appetite 🏦📈.
Geopolitical risks have eased or are being priced in, allowing investors to focus on growth 🌍🕊️.
Summary:
The NASDAQ 100’s rally is powered by AI-driven tech growth 🤖, resilient earnings 💪, and easing macro/geopolitical risks 🌏. The index remains a global leader as investors bet on the next wave of technology and digital innovation 🚀.
