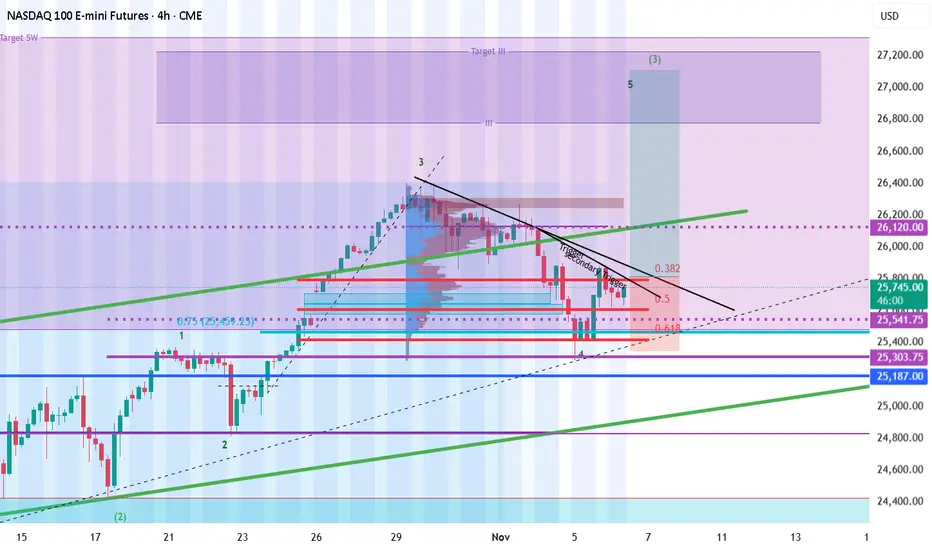
Nasdaq - potential trigger Break for a long targetNasdaq - potential trigger Break for a long target
We are at final point of rebound
We can have a potential 5 wave so, if price will break trigger zone we can have final long wave.
Nasdaq
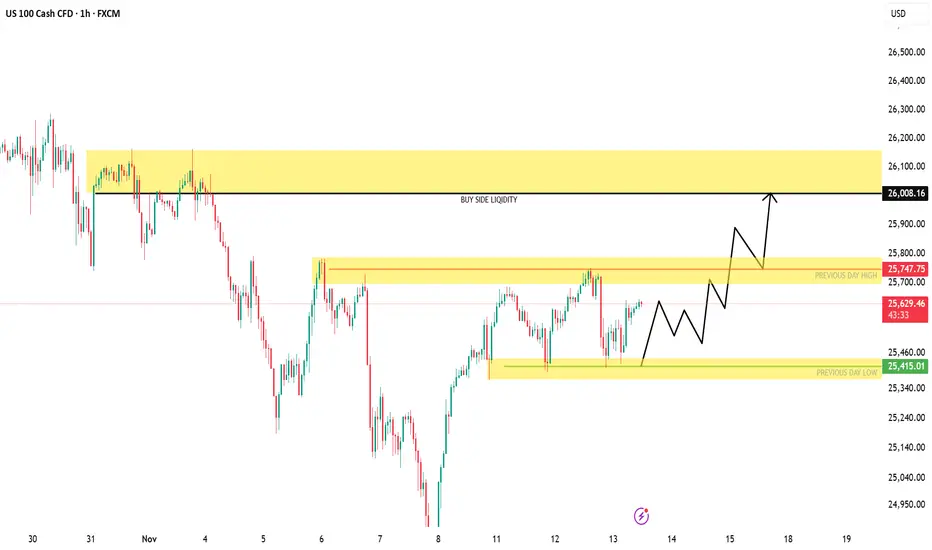
US100 | Building Liquidity for a Potential Push Toward 26,000NASDAQ (US100) is consolidating between 25,400–25,750, forming a potential accumulation zone below short-term liquidity. A clean break and retest above 25,750 could trigger a bullish expansion toward the 26,000–26,200 range, where major buy-side liquidity sits.
Market Structure:
Bias: Bullish (HTF structure shifting higher)
Key Demand Zone: 25,400 – 25,450
Breakout Zone: 25,750
Target Zone: 26,000 – 26,200
Invalidation: Below 25,400
Concepts: Liquidity Grab | Market Structure Shift | Demand Zone | Breaker Block | Smart Money Flow
LYFT 1W from losses to profit investors believe,but for how longLYFT broke out of its long accumulation range between $8 and $20 and is now consolidating above the breakout level. The “breakout + retest” structure remains intact, with $20–21 acting as key support. A golden cross on the weekly chart confirms a shift toward bullish momentum. As long as price holds above $20, targets stay at $33.33 and $48.48.
Fundamentally , Lyft is in its strongest position in years. In Q3 2025, the company reported its first net profit of about $46 million after years of losses. Revenue grew 11% YoY to $1.68 billion, gross bookings rose 16%, and adjusted EBITDA reached roughly $139 million (+29% YoY). Active riders climbed past 28 million, average revenue per user increased, and corporate and premium rides strengthened overall performance. Cash flow improved, debt levels declined, and operating margins continued to expand.
The main challenge lies in competition and pricing pressure from Uber, as well as in sustaining profitability beyond a single quarter. While optimism is reflected in the stock price, consistent financial performance is now critical for further upside.
Technically, holding above $20 keeps the bullish setup valid. Any pullback toward $21–20 may offer a buy-the-dip opportunity with targets at $33 and $48.
Lyft finally turned profitable - now the real test is proving that growth isn’t just a quarterly anomaly.

Moon Boys don't want you to see this Bitcoin/Gold chart !Hi Guys,
We have a massive head & shoulders on the Bitcoin / Gold chart that almost nobody talks about! With all the major players being openly bullish on Bitcoin and while everyone is waiting for the AI bubble to burst ..Bitcoin will be the first one to react considering how easy it can be sold and how volatile it usually is.
The charts don't lie and all markets are clearly at the top so protect you capital at all cost while you still can.
Let me know what do you guys think about this.

NASDAQ 100 (NQ1!): Time To Buy This Dip? Oh Yeah!Welcome back to the Weekly Forex Forecast for the week of Nov. 10-14th.
In this video, we will analyze the following FX market: NASDAQ (NQ1!) NAS100
The NASDAQ pulled back after rallying for weeks! We patiently waited for a dip buying opportunity to form. Well, Friday might have given us the indication of an end to the pullback... and the opportunity to buy the dip may be upon us!
Wait for the shift in the market structure from bearish to bullish to form... then look for your
valid long setups.
Enjoy!
May profits be upon you.
Leave any questions or comments in the comment section.
I appreciate any feedback from my viewers!
Like and/or subscribe if you want more accurate analysis.
Thank you so much!
Disclaimer:
I do not provide personal investment advice and I am not a qualified licensed investment advisor.
All information found here, including any ideas, opinions, views, predictions, forecasts, commentaries, suggestions, expressed or implied herein, are for informational, entertainment or educational purposes only and should not be construed as personal investment advice. While the information provided is believed to be accurate, it may include errors or inaccuracies.
I will not and cannot be held liable for any actions you take as a result of anything you read here.
Conduct your own due diligence, or consult a licensed financial advisor or broker before making any and all investment decisions. Any investments, trades, speculations, or decisions made on the basis of any information found on this channel, expressed or implied herein, are committed at your own risk, financial or otherwise.

TSLA Plunging? The Fake Rebound Before the Real Crash!Tesla (TSLA) is entering a challenging phase as a wave of negative news hits from both fundamental and technical sides. Sales in China — Tesla’s second-largest market — have dropped to their lowest level in three years , sparking fears that real demand for EVs is cooling. At the same time, Elon Musk’s massive $1 trillion compensation package has raised concerns among investors who believe Tesla’s current valuation far exceeds its actual profit potential.
On the daily chart, TSLA is showing clear signs of weakness after an extended uptrend. The price is now testing the medium-term ascending trendline around the $430 zone . If buying pressure fails to hold this level, there’s a strong chance the price will break the trendline and enter a deeper correction phase .
In the short term, Tesla could continue to drop toward the $400 area , where strong support and the Ichimoku cloud base converge. Any rebounds, especially near the $450 resistance zone, should be viewed as opportunities for sellers to re-enter rather than signs of recovery.

BTC BREAKING NEWS OR BREAKING CHARTS?📰 BREAKING NEWS OR BREAKING CHARTS?
TRUMP IMPOSES TARIFFS, CAUSING A BITCOIN BLOODBATH — $20,000 DRAWDOWN IN 2 HOURS!
Bitcoin was sitting comfortably at $121,000, before a sudden macro shock — triggered by newly imposed U.S. tariffs — sent prices spiraling down to $100,000 in a matter of hours.
Bulls were liquidated. Bears rejoiced.
Now, the market stands at a crossroads: will this become a major dump continuation, or the foundation for a secret pump?
Chart Overview & Structure
On the high timeframe, BTC continues to trade within a rising wedge formation, with price now showing a significant wick rejection from the upper boundary. This move suggests a potential shift in market structure — a moment that’s likely to shake inexperienced traders. The chart reveals a clear supply and demand structure:
Supply Zone: $123,452 – $130,000
D emand Zone: $98,826 – $101,400
These zones define the battlefield between bulls and bears. In addition, eight psychological levels dominate the chart — $100K, $105K, $110K, $115K, $120K, $125K, and $130K — each representing potential liquidity clusters and reaction points.
Adding to the complexity, we can see a golden pocket (0.618–0.65 retracement) forming around $106,000, perfectly aligning with prior swing lows and the midpoint of a large Fair Value Gap (FVG) overhead. This zone could serve as a reversal or continuation point depending on whether price can reclaim and hold above the major support trendline.
Technical Insights
The market has now tapped the rising wedge resistance three times, with the last tap forming a wick above $125K, triggering liquidity before the sharp collapse. This aligns with the classical exhaustion behavior of wedges. Moreover, a potential Head and Shoulders structure is beginning to emerge, with the right shoulder aligning near $115K — a confluence area that may attract strong bearish attention.
For now, price is testing the lower support trendline — a crucial pivot area for determining whether BTC continues to break down toward demand or consolidates for recovery. This structure creates a make-or-break zone that will define the next macro leg.
Bullish Scenario
Despite the panic, this could be a classic liquidity flush — a “flush candle” event designed to wipe out leveraged long positions before a larger move upward. If BTC can maintain structure above the major support line and close above $106K–$110K, it opens the door for a relief rally.
A reclaim of $115K would confirm buyer strength.
Sustained momentum could push BTC back into the $120K–$125K range to retest the broken supply zone.
Breaking through $125K would invalidate the bearish wedge, potentially igniting a run toward $130K+ and even new highs in “Pump-tober.”
In this scenario, the deep liquidation event becomes fuel for a massive short squeeze, driving momentum and reigniting bullish sentiment across crypto markets.
Bearish Scenario
On the flip side, if BTC fails to hold above $106K or decisively breaks below the demand zone at $98K, it would confirm a rising wedge breakdown.
Below $100K, momentum could accelerate toward $95K–$92K — the next liquidity pools and volume gaps.
The Head and Shoulders completion would confirm the bearish reversal structure, further strengthening the downside case.
Macro sentiment, fueled by geopolitical and policy fears, could add weight to the bearish outlook.
A rejection from $115K without sustained reclaim would also reinforce the bearish continuation pattern, with every psychological level above turning into resistance.
Summary
Bitcoin is at an inflection point — the $100K–$115K range will define the next macro move.
The recent wick and structure breakdown hint at weakness, but the flush candle and liquidity sweep also suggest that a bullish rebound could be on the horizon.
In short:
Above $115K → Bullish continuation possible.
Below $100K → Bearish expansion likely.
With volatility at its peak, traders should expect massive liquidity hunts, fakeouts, and emotional traps on both sides.
Whether this becomes the start of a macro correction or a secret accumulation phase before a major pump — the next few daily closes will tell the story.

DKNG Update | $10Video contains a update on DKNG price action
Looking to see a move to $10 in the long term view
First we need to see a pullback which we are going through currently
Before $10 we will look to hit $20 first. Any rejection under liquidity grab will validate the next move.
Watch video for more details.
Ps
TradingView needs to allow shorter descriptions again😕

Nasdaq Holds Firm After Support Rebound| Focus on 25820 BreakoutUSNAS100 | Overview
The price retested our support at 25430 and bounced perfectly, just as outlined in the previous analysis.
After reaching the resistance zone, the index is now consolidating between 25700 and 25820, awaiting a decisive breakout.
A 1H close above 25820 would confirm bullish continuation, targeting 25960 and 26170.
However, a 4H close below 25700 would indicate the start of a bearish correction, with downside potential toward 25570 and 25430.
Pivot Line: 25700
Resistance: 25820 · 25960 · 26170
Support: 25570 · 25430 · 25230
Outlook:
USNAS100 remains bullish while above 25700, with upside targets at 25960–26170.
A confirmed 4H close below 25700 would shift the short-term tone to a bearish correction toward 25570–25430.

MSP Recovery, Inc. (MSPR) Set to Report Earnings Nov 14, 2025The price of MSP Recovery, Inc. (NASDAQ: NASDAQ:MSPR ) stock saw a noteworthy uptick of 75% today as the company is set to announce earnings report on the Nov 14, 2025.
The asset spike almost 90% given increased momentum and investor interest. Albeit the spike in price NASDAQ:MSPR 's daily Relative Strength Index is at 41 showing more room for NASDAQ:MSPR to gain further resistance levels.
The 61.8% Fib level is integral for NASDAQ:MSPR to break above in order to seal the bullish continuation move.
Financial Performance
In 2024, MSP Recovery's revenue was $18.25 million, an increase of 574.64% compared to the previous year's $2.71 million. Losses were -$360.50 million, 539.8% more than in 2023.
About MSPR
MSP Recovery, Inc., doing business as LifeWallet, operates as a healthcare recovery and data analytics company in the United States and Puerto Rico. The company offers claims recovery services, including services to related parties or third parties to assist entities with pursuit of claims recovery rights. It also provides LifeWallet, a scalable and expandable data ecosystem where tokenized data is stored in a platform with multiple applications.

Good zones o work with, nasdaq 11-11-25Low volume nodes and gaps, usually are good zones to work with.

Nasdaq Potential for Further CorrectionThe NASDAQ index currently appears to be in a short-term correction, with the price likely to retest 25430 from 25570 before further movement.
- Above 25430–25575: Bullish continuation towards 25700 → 25820 → 25960.
- Below 25430: Bearish momentum is likely towards 25230 → 25010.
Wall Street Tech Rally Resumes | USNAS100 Holds Firm Above 25440USNAS100 – MARKET OUTLOOK | Bullish Bias Above 25440
The Nasdaq continues to trade with bullish momentum after stabilizing above 25440, supported by strength in tech stocks and improving market sentiment.
Above 25440: Bullish continuation toward 25700 → 25820 → 26170 (ATH).
Below 25430: Bearish correction possible toward 25230 → 25000 → 24760.
Pivot: 25440
Support: 25230 · 25000 · 24760
Resistance: 25570 · 25700 · 25820
USNAS100 remains bullish while above 25440, but a confirmed 1H close below 25430 could trigger a short-term bearish correction toward 25230–25000.

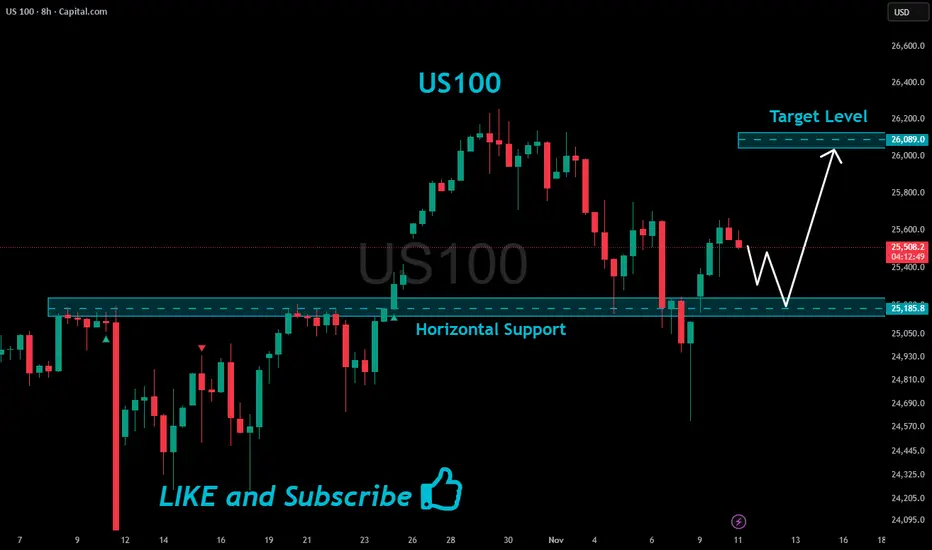
US100 Support Ahead!
HI,Traders !
#US100 is making a local
Bearish correction but
We are bullish biased mid-term
So after the pair hits the horizontal
Support of 25185.8 we will be
Expecting a local bullish rebound !
Comment and subscribe to help us grow !
Breaking: Pagaya Technologies Ltd. (PGY) Report Earnings ResultPagaya Technologies Ltd. (NASDAQ: NASDAQ:PGY ) spike 17% breaking out of a bullish symmetrical triangle. The asset is still capitalising on the triangle gearing for 85% surge amidst growing interest.
With the RSI at 59, NASDAQ:PGY is claiming the $50 resistant should market sentiment remain bullish.
In another event, Pagaya Reports Third Quarter and Nine Months Ended 2025 Results:
Raises full-year guidance for Total Revenue, Adjusted EBITDA, and GAAP Net Income
Record performance across all key metrics:
$23 million GAAP Net income; up $90 million YoY
$107 million Adjusted EBITDA; up 91% YoY
$350 million Total revenue and other income; up 36% YoY
$2.8 billion Network volume; up 19% YoY
About PGY
Pagaya Technologies Ltd., a product-focused technology company, deploys data science and proprietary artificial intelligence-powered technology for financial services and other service providers, their customers, and asset investors in the United States, Israel, and the Cayman Islands.

Joby Aviation Rally Ahead ? Be Mindful of this potential Trap
In this video I recap the original video before looking into what we can expect looking forward .
With the original idea still at play I see the potential for a push back into 18$ zone which would give a 30/40% rally .
I use some historical price action to demonstrate how this rally could lead to a trap or a reclaim of the 18$ level could be a sign of strength.

PROK on track to transform Kidney Disease. ProKidney Corp
(Nasdaq: PROK)
Is a clinical-stage biotech company pioneering a proprietary autologous cell therapy, rilparencel (REACT) for chronic kidney disease in diabetic patients.
Their phase 3 PROACT ! trial focuses on slowing kidney function decline using eGFR slop as the FDA accepted primary endpoint, with data expected in mid 2027.
With a market cap near $410M and growing trial enrolment, PROK aims to offer a transformative treatment restoring kidney function rather than only managing symptoms.
Watch for trial updates and potential breakout as data readouts arrive.

NASDAQ Excellent rebound on the 1D MA50. Bullish.Nasdaq (NDX) has been trading within a 6-month Channel Up and last Friday made another 1D MA50 (blue trend-line) test exactly at the bottom (Higher Lows trend-line) of the pattern, and rebounded.
This has market the last two bottoms of the Channel Up and kickstarted the Bullish Legs, which have both been at +9.59%. As you realize, this it technically the pattern's strongest Support and most optimal buy entry for the medium-term.
We expect at least another +9.59% rally on the emerging Bullish Leg, targeting 26950.
-------------------------------------------------------------------------------
** Please LIKE 👍, FOLLOW ✅, SHARE 🙌 and COMMENT ✍ if you enjoy this idea! Also share your ideas and charts in the comments section below! This is best way to keep it relevant, support us, keep the content here free and allow the idea to reach as many people as possible. **
-------------------------------------------------------------------------------
💸💸💸💸💸💸
👇 👇 👇 👇 👇 👇

NAS100 Intraday Technical AnalysisNAS100 Intraday Technical Analysis - 10 Nov 2025
Nasdaq 100 at 25,454 (2:05 PM UTC+4) — multi-chart confluences signal breakout setup.
📌 Market Context: Wyckoff Phase D re-accumulation; Dow Theory primary uptrend intact; Gann Square-of-9 vibration levels 25,520/25,320.
🗺️ Multi-Timeframe Breakdown:
1D: Broadening wedge; RSI 63 (mild bearish divergence); Ichimoku cloud support 25,180; bullish engulfing pattern intact.
4H: Rising wedge 25,280-25,520; Elliott Wave (3) mid-extension; anchored VWAP from Oct 29 = 25,180 (buy anchor).
1H: Cup-and-handle breakout base at 25,360; BB expanding; VWAP reclaimed post-morning dip.
30M: Symmetrical triangle; hidden bull divergence (RSI higher lows); volume contracting pre-breakout.
15M: Bull flag over 25,340; Tenkan>Kijun bullish; stochastic RSI reset—ready for push.
5M: Falling wedge retest 25,420; hammer candlestick confirms demand; watch bull trap on volume weakness.
🎯 PRIMARY LONG SETUP
Entry: 25,360-25,390 (VWAP + flag support) — wait for bullish 15M close above 25,380.
Stop Loss: 25,300 (below symmetrical triangle base).
Target 1: 25,480 (+26 pips).
Target 2: 25,540 (+86 pips).
Target 3: 25,620 (+166 pips — harmonic alt bat PRZ).
Confirmation: RSI >55, volume >20% of 20-day avg, VWAP slope upward.
⚡ MOMENTUM ADD-ON: Scale above 25,520 ONLY if RSI>65 & volume surge confirmed; trail stop to 25,460 once first target prints.
🔻 REVERSAL SHORT SETUP
Entry: 25,600-25,640 (supply zone) — trigger on bearish engulfing + RSI divergence.
Stop Loss: 25,700 (above rising wedge).
Targets: 25,500 → 25,420 → 25,320 (Gann support).
Confirmation: 5M/15M RSI bearish divergence; BB upper band rejection.
🚨 BREAKOUT & BREAKDOWN ALERTS:
BULL: 1H close >25,540 confirms Wave (3) extension; target 25,720; move stop to BE+20.
BEAR: 1H close <25,300 with volume expansion opens 25,180 cloud base test; watch VWAP support.
📊 INDICATOR SNAPSHOT: BB squeeze (30M) expanding; MACD histogram positive; VWAP slope UP; EMA21>EMA50>EMA200 (bullish stack).
⚠️ PATTERN ALERTS: Harmonic bat completes 25,620; rising wedge failure <25,320 = Wyckoff UTAD signal; H&S only valid if neckline 25,260 breaks.
📈 TIMING & RISK: Gann 90° window 15:30 UTC; ATR(14)=90 pts; CPI whispers & Fed speakers elevate volatility. Risk ≤1% per setup; lock partials; avoid sub-average volume chases.
Educational purposes only. Align with your plan, manage risk, adapt to real-time action.
NASDAQ is Nearing an Important Resistance Line.Hey traders, in tomorrow's trading session we are monitoring NAS100 for a selling opportunity around 25,500 zone, NASDAQ is trading in a downtrend and currently is in a correction phase in which it is approaching the trend at 25,500 support and resistance area.
Trade safe, Joe.

Mastering Trading Psychology; Why Mindset is the toughest skillWelcome all to another post.
In this article we will dive into the process of Mastering Trading Psychology.
1) What is Trading Psychology:
Trading Psychology, it is your mindset. It is what you think, how you feel, what you need to do, what you want to do. It is a mixture of thoughts, future actions, emotions and past, present or future behaviors that influences your present self in making good, or bad decisions in the market.
It can be considered a “strategy” but leans more to a “skill” It’s about what your thought process is when you are under pressure.
Everybody, investor, gambler, trader, swing trader, day trader, scalper and holders, bring their own personalities & habits into the trading space. Whether it’s impatience, or patience, fear or greed, confidence or impulsiveness, or discipline. These mental sets determine how frequently you can follow your edge and how well you can manage wins, losses and uncertainty.
Trading psychology is the framework of the mind. It works for you or goes against you. Both are under your control to choose from. A strong, stable, clear mind keeps you going. A weak, broken, cluttered mind keeps you falling.
Ultimately, to master trading in psychology, you need to master yourself.
2) Pros and Cons of Trading Psychology:
Pros:
The pros/benefits of Trading Psychology, once it is mastered, is simple.
You understand the game. You understand the process. You understand why you lose, why you win, why manipulation takes place and why you trade it.
It is a skill that is developed through patience and perseverance along with constant practice.
Like every other skill, it demands TIME, ENERGY, and constant Trial and Error of failures, wins, adjustments and so on. It isn’t something that can be taught or learned once, except for those who learn to recognize and leverage their mental strengths & weaknesses can truly master it over time.
Cons:
Trying to master Trading Psychology means you need to LOSE. You need to experience loss after loss after loss after loss. You need to fail many times. Every time you fail, you understand how to take control of your emotions, you learn where things went wrong, you learn how to build your edge.
But it’s not always about losses, it’s about gains (wins )too. You need to maintain a stable status of emotions whether you win or lose. You can’t show anger, you can’t show excitement. Because both will come back at you with another loss.
This means you cannot allow yourself to be ruled by any emotion, positive or negative. It can be a long uncomfortable process that can take years to master. Sometimes even decades.
What makes it more challenging is that trading psychology does not exist in isolation.
Psychology outside of trading must be mastered too. How you think, act, live, every single day.
- We will explore this topic further down the article.
3) Why it is important in the trading space:
Psychology is an essential topic that must be taught and considered. Because without it, you will not succeed. Without self-control, or a strong mind, trading will become nothing more than just gambling like a slot machine.
It's a skill that many overlook. With it, you are aware of what works and what fails. It allows you to step back and re-assess the next trade instead of forcing it.
The end goal is to make money, but to even do that you first have to protect your capital. Only take A++ Set ups (High confluence/probability set ups) and avoid any traps involving emotions like: Fear of Missing Out (FOMO) or the “I just need 1 good pump” (One Big Win) Mindset.
With it being in the trading space, it gives users the ability to pause, re-assess and question your decisions on the trade you are about to take.
It helps to mention, “Is this an A++ Setup?” “Does it align with my strat, my edge, my goals?” If it does not and you decide not to take it, you save yourself a loss of capital and have made a win of improved trading psychology.
It assists you in distinguishing the difference between good/bad trades. Not on the result but the process. It keeps you grounded.
4) How to Master Trading Psychology:
Just because it is difficult & challenging, does not mean it is impossible.
First step – building discipline through consistency and structure.
Ensure you have a clear trading plan set up. One that defines your edge or can be adjusted to find your edge. Commit to following it no matter what the market is doing. Pumping, Dumping or consolidating.
Consistency in action will build mental strength.
Secondly, you must work on emotional control. Understand and be focused on how you feel when you experience fear, greed, or overconfidence. These emotions push you off your plan if you let them take over.
Each time this happens, you must log it. That way you can accumulate data and self-awareness.
With that, everyone says this. BackTEST or at least forward test you strategies extensively.
Keep a detailed journal that has a good list of questions that you must answer after each trade. Be brutally honest with yourself. Don’t hide losses because you have already hit 10 in a row. Log them all down. This way you will then be able to recognize emotional triggers and recurring patterns appearing that are holding you back.
Being able to recognise them is the first step to controlling them. OBSERVE YOURSELF.
While this takes place, you must begin to build trust in your system (strategy) and in yourself. You will see how your actions and choices line up with your plan. That way your confidence will shift from emotions to process driven.
Last one is patience. The hardest yet most critical psychological skills. Take ONLY A++ set ups, for example a set up that has 4 confluences or 5 lining up. Doing this trains your mind into avoiding impulsive behavior or falling into FOMO based environments.
To see another deep dive into mastering trading psychology, review the post below to determine which mindset you currently have. Are you a trader? Or are you a gambler.
5) How Psychology in our daily lives affects our ability to trade:
Trading Psychology is an interesting concept, but so is psychology in general.
The human mind is weak and for it to be strengthened, it takes time & self-awareness.
A weak mind won’t get you anywhere.
Psychology is not a simple one sentence definition. It can mean many things, or many situations.
It is a critical role in our life, it shapes our emotions, reactions and choices. It can lead us to self-sabotage or it can lead us to success.
If you cannot control your psychology outside of trading, you won’t be able to control it inside of trading. By this I mean daily emotions.
For example:
Imagine an individual experiences a breakout, they are sad, they are angry, they are emotionally drained and hurt. Then they go off to trade. They will LOSE.
This is because when the mind is in an uncomfortable state, it seeks a dopamine hit, and when they associate a win in trading = dopamine hit, they naturally turn towards trading. They want to feel that dopamine hit, so they can feel good again. But then they are no longer following their edge.
This destroys discipline, objectivity and focus.
This is not just tied to relationship breakups, but everything in our day to day lives. If you experience a bad day at work, failed an exam, argued with family, or facing a stressful time. If you bring unresolved emotions, thoughts and feelings into the trading space, trading just becomes a big emotional outlet.
Psychology appears in every action we do, EVERY day. “I need to drink water” I will get water. I see soda, “I now want soda.”
The mind now as switched completely from the main objective “Water” to soda. If you cannot control your mind to stick to what is right, then you will not master trading psychology.
The better control you have over yourself, & your mind, the more consistent and rational your trading decisions will become.
KEY POINTS:
1) What is Trading Psychology:
- Trading psychology is the foundation of every mental action. You must master yourself before mastering the market.
2) Pros & Cons of Trading Psychology:
- Trading Psychology cannot be mastered without failure, each loss has a lesson, that lesson is based around strengthening your mind with emotional control.
3) Why it is important in the Trading Space:
- Without a strong mind, trading turns into gambling, you must become disciplined and maintain self-control. This splits pros from the gamblers.
4) How to Master Trading Psychology:
- Right to the point: Consistency & discipline, emotional awareness, journaling, and most importantly, being patient. These are core aspects of mastering your mindset and obtaining the right psychological discipline.
5) How daily psychology affects trading:
- The way you manage your everyday emotions outside of trading mirrors the way you will end up reacting to the markets.
Control your life, then control your trades.
Psychology is a great skill, but it’s only part of 3 keys that will lead you to success. Find out the 2 other keys below:
Thank you all so much for reading - I hope this post brings a lesson into everyone's trading journey.
I am aware that this is a big long article, however Trading psychology goes even deeper - I have summarized my knowledge and research that I have obtained over time and summarized it.
Please let me know if any of you would like an a post on a specific topic.
I'd love to provide more for the community!

Nasdaq Battle between correction & innovationNASDAQ 100 (NDX)
Nasdaq 100 Index (NDX) currently sits at a crucial inflection point, defined by the overwhelming dominance of the technology sector's structural growth against a backdrop of increasing macroeconomic and technical vulnerability. After a historic rally driven by Artificial Intelligence (AI) euphoria, the market is undergoing a necessary and sharp correction, testing key support levels established during the latest bullish surge.
The Durable Foundation: AI, Earnings, and Profitability
The core bullish case for the NDX remains robust, fundamentally driven by the "Magnificent Seven" and the pervasive, non-negotiable surge in AI infrastructure spending. Unlike the speculative rallies of previous cycles, today's leaders are characterized by deep profitability, substantial cash flow, and diverse revenue streams.
Recent corporate earnings reaffirm this strength, with the technology sector posting strong double digit growth. This profitability suggests that investment in AI is being funded through internal cash flow, making the rally more sustainable than the debt fuelled expansion seen two decades ago. The long term trajectory is further supported by an accommodative Federal Reserve pivot, which is now in rate cutting mode a supportive contrast to the tightening cycle that ended the 2000 rally. The secular trend of technological innovation is accelerating, transforming AI from a growth narrative into an essential business imperative.
Macroeconomic and Sentiment Headwinds
Despite underlying corporate strength, recent market action signals a decisive sentiment shift rooted in macro uncertainty and high valuations. The index has experienced its steepest weekly decline since March, indicating heavy profit taking and a collective "reality check" among traders.
Several factors are contributing to this sentiment reversal:
1. Concentration Risk: The sheer weight of the largest components now represents an extraordinary percentage of the overall market capitalization, making the NDX acutely sensitive to volatility in just a few key names.
2. Labor Market Cooling: Data showing a significant spike in job cuts (particularly in the tech and warehousing sectors) has unsettled investors, suggesting that economic cooling is accelerating faster than anticipated.
3. Consumer Confidence: A sharp drop in consumer sentiment reflects heightened anxiety related to economic uncertainty and political instability, which historically dampens forward looking market optimism.
4. Valuation Concerns: While not at 2000 extremes, valuations remain elevated, shifting the market’s focus entirely from multiple expansion to demanding flawless execution and continuous earnings growth.
Technical Outlook: The Critical 25,000 Support Test
From a technical perspective, the NDX has been in a clear, rising trend channel over the medium to long term, confirming a persistent buy the dip mentality. However, the recent sell off has introduced significant short term caution.
The index is currently testing a non negotiable support zone around 25,000. This level is psychologically important and corresponds to a previous major breakout point. A decisive breakdown below this support could trigger a cascading sell off as automated stop loss orders are activated, potentially paving the way toward the next major supports at 24,500 and, more critically, 23,980.
Key Technical Levels:
• Immediate Support: 25,000
• Secondary Supports: 24,500, then 23,980
• Immediate Resistance: 25,200, followed by 25,500 and 25,700
Conclusion: Navigating the Volatility
Nasdaq 100 remains an index of unparalleled innovation and long term potential, yet its short term path is fraught with risk. The outlook hinges on the NDX's ability to hold the critical 25,000 support level. A bounce from this zone would confirm the resilience of the dip buyers and maintain the medium term bullish structure. Failure to hold this level, however, would signal a deeper technical correction is underway, shifting the focus to the lower support zones as the market cleanses its excessive exuberance. Traders should remain nimble, respecting the clear shift in short term momentum while maintaining conviction in the long term, secular growth of the technology giants.

Opendoor Technologies Big Correction coming ?In this video I explore the recent explosion in the price of Opendoor Technologies .
Still along way off its All time highs but up some 2000% from the past few months alone
I analyse what could be a very key zone to build upon .
Tools used Fibs, VPR, VWAP, TPO Chart
