Us30 longU30 forms a spring on the 4hr.
The general market is bullish on the daily, so underlying conditions are on our side, I can't stress enough the value of that,
So far, setup looks A+
Nasdaq

BTC - Perfect Bullish SetupPrice Action Breakdown
After running the lows with a clear Sell Side Liquidity Sweep, BTC quickly reversed and printed a Market Structure Shift (MSS). This marked the first real sign that the market might be ready to transition from weakness into strength.
Retracement Zone
Price is now retracing into a very interesting area — the overlap of a Bullish Fair Value Gap, an IFVG, and the Golden Pocket. When multiple imbalances and Fibonacci levels line up like this, it often builds a high-probability zone where institutions look to re-accumulate positions before the next move higher.
Upside Target
If this area holds and buyers step in, the next logical draw on liquidity sits above Buy Side Liquidity. That pool of stops acts like a magnet, and with the prior lows already cleaned, the path of least resistance could be higher.
Invalidation
On the other hand, a failure to hold inside the Golden Pocket would weaken this bullish narrative. A clean break below the sweep low would suggest that this rebound was only temporary relief before further downside.
Final Thoughts
This setup is all about how price reacts inside the retracement zone. If we see strength here, the run toward Buy Side Liquidity is very much in play. If not, patience will pay, as deeper levels will likely come into focus.
What’s your take — do you see this zone holding, or are you expecting another flush?

Gold | 15min Head and Shoulders | GTradingMethodHello Traders.
Welcome to today's trade idea by GTradingMethod.
🧐 Market Overview:
There’s a potential head and shoulders pattern forming on the 15-minute chart. Gold broke to a new high yesterday, and a healthy breakout often comes with a retest before continuing higher.
This 15-minute head and shoulders could signal that retest — or potentially lead to a deeper correction.
One of the variables I will be looking for is lower volume on the right shoulder.
📊 Trade Plan:
Risk/reward = 3.3
Entry price = 3 536.3
Stop loss price = 3 543.5
Take profit level 1 (50%) = 3 516.8
Take profit level 2 (50%) = 3 506
💡 GTradingMethod Tip:
Patterns can provide an edge, but waiting for confirmation helps you avoid false signals and emotional decisions.
🙏 Thanks for checking out my post!
Make sure to follow me to catch the next idea and please share your thoughts - I would like to hear them.
📌 Please note:
This is not financial advice. This content is to track my trading journey and for educational purposes only.

Shenandoah Telecommunications Co — September 02, 2025Sergio Richi Premium ✅
NASDAQ:SHEN — Shenandoah Telecommunications Co (NASDAQ:SHEN) Insider Activity Report | Communication Services | Telecom Services |USA | NASDAQ | September 02, 2025.
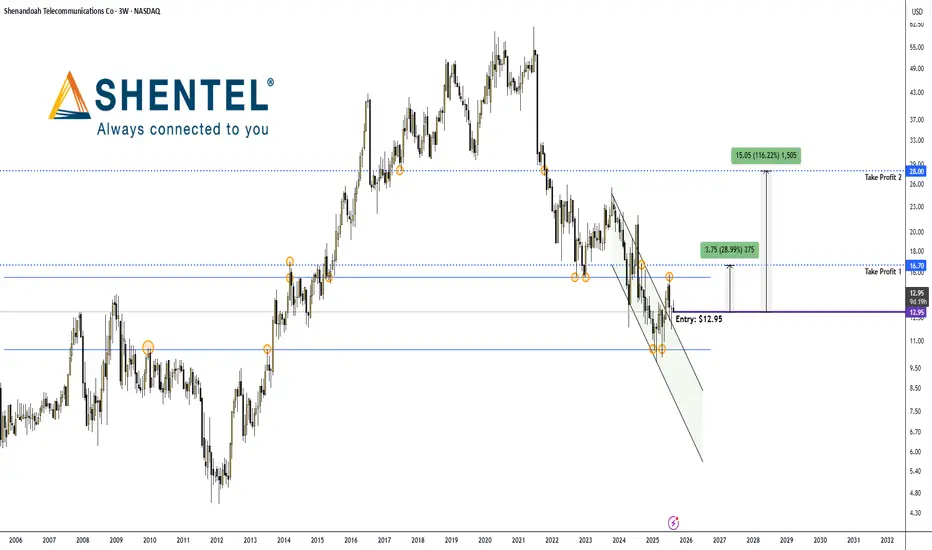
Price (Sept 2, 2025) : $12.95
Insider Activity
ECP ControlCo, a 10% owner tied to Energy Capital Partners, has been steadily loading up on SHEN since May. From late May through August 29, they picked up 864K+ shares worth over $11M, pushing their stake above 3.3M shares (~6.1% of the float). The buying wasn’t symbolic—this is real money, consistently deployed on a stock that’s been under pressure.
(SEC Form 4)
www.sec.gov
(SEC Form 4)
www.sec.gov
1. Company Overview
Shenandoah Telecommunications (Shentel) runs fiber broadband, video, and voice services across Virginia, West Virginia, Maryland, and Pennsylvania. Its flagship brand Glo Fiber is expanding fast, with 40%+ YoY revenue growth. Q2 2025 showed revenue at $88.6M (+3.2% YoY), with adjusted EBITDA up 21.9%. Despite a small net loss, the operating trend is improving.
Market cap sits just over $700M, with insiders holding ~11% and institutions ~65%.
2. Why It Matters
• Fiber-to-the-home growth is the story: Q2 Glo Fiber up 40.5%.
• Rural broadband subsidies add a tailwind.
• Institutional inflows are showing up: Southeastern Asset Mgmt (+151%), Longleaf (+151%), RBC (+184%), Two Sigma (+119%), Invesco (+104%).
• Short interest is modest (~4.4% float).
Charts:
• (3W)
Insider Trades:
SHEN seasonality:
SHEN Hedge Fund Flows:
SHEN Ownership:
3. The setup:
SHEN has been trading heavy but looks like it found a floor around $13. Insider conviction plus institutional inflows give me confidence this is a buy-the-weakness play.
Entry : $12.95–$13.35
🎯 Take Profit 1: $16.70 (+29%)
🎯 Take Profit 2: $28.00 (+116%)
My Take
Insiders are writing 8-figure checks into a depressed tape, institutions are scaling in, and fiber growth is compounding.
Atlassian Corporation — September 02, 2025Sergio Richi Premium ✅
NASDAQ:TEAM #AtlassianCorporation — Atlassian Corporation (NASDAQ:TEAM) Insider Activity Report | Technology | Software - Application | USA | NASDAQ | September 02, 2025.
Price (Sept 2, 2025) : $172.66
On August 28, Director Scott Belsky bought 1,455 shares at $173.00 (~$252K). This is his first disclosed purchase. Unlike CEO sales under pre-arranged 10b5-1 plans, this was an open-market buy—at levels that insiders view as undervalued following strong FY25 results.
(SEC Form 4)
www.sec.gov
1. Company Profile / Overview:
Atlassian Corporation (NASDAQ: TEAM) is a global leader in enterprise collaboration and productivity software. Its flagship products include Jira, Confluence, Trello, and Bitbucket, serving more than 300,000 organizations worldwide.
Atlassian’s strategy is anchored in:
• Cloud transition – shifting its massive install base from on-prem to recurring cloud revenues.
• AI integration – with over 2.3 million active AI users and a strategic partnership with Google Cloud to scale adoption.
• Enterprise expansion – record multi-million-dollar contracts, deeper penetration into Fortune 500.
• Financial strength – FY25 revenue hit $5.22B (+19.7% YoY), with cloud revenue up 26%. Free cash flow reached $1.4B, giving the company flexibility for reinvestment and M&A.
Insiders own ~37% of the stock, institutions ~53%—a rare alignment of interests between management and Wall Street.
2. Institutional Flows (Q2 2025):
• FMR (Fidelity): +74%
• D.E. Shaw: +321%
• Two Sigma: +285%
• Vanguard: +2.6% (largest holder at 17.4M shares)
Net effect: significant inflows despite a -30% YTD drawdown.
Charts:
• (2W)
TEAM seasonality:
TEAM Hedge Fund Flows:
TEAM Ownership:
3. The setup:
TEAM has defended the $170 support zone. Belsky’s buy at $173 validates this level as institutional demand. A breakout above $190 could accelerate momentum, with the next resistance in the $220–235 range.
Entry : $172–173
🎯 Take Profit 1: $235 (+36.1%)
🎯 Take Profit 2: $273 (+58.0%)
Insider conviction, institutional accumulation, and strong AI/Cloud fundamentals line up with a bullish long-term setup. Risk/reward skews heavily to the upside. I’m targeting +36–58% upside in the next 6–12 months as TEAM extends its global uptrend.

NASDAQ (NAS 100): Short Term Sells to the Weekly +FVG!Welcome back to the Weekly Forex Forecast for the week of Sept 1 - 5th.
In this video, we will analyze the following FX market: NASDAQ (NQ1!) NAS100
The NASDAQ failed to make a new ATH last week, indicating some weakness in the market. Frequently, Swing failures precede reversals, and this seems to be the case on the Daily TF.
Look for price to confirm bearish intent, as the sell side liquidity targets draw price down to the +FVG at 22.582.
A bullish BOS at current levels would invalidate this trade idea.
Enjoy!
May profits be upon you.
Leave any questions or comments in the comment section.
I appreciate any feedback from my viewers!
Like and/or subscribe if you want more accurate analysis.
Thank you so much!
Disclaimer:
I do not provide personal investment advice and I am not a qualified licensed investment advisor.
All information found here, including any ideas, opinions, views, predictions, forecasts, commentaries, suggestions, expressed or implied herein, are for informational, entertainment or educational purposes only and should not be construed as personal investment advice. While the information provided is believed to be accurate, it may include errors or inaccuracies.
I will not and cannot be held liable for any actions you take as a result of anything you read here.
Conduct your own due diligence, or consult a licensed financial advisor or broker before making any and all investment decisions. Any investments, trades, speculations, or decisions made on the basis of any information found on this channel, expressed or implied herein, are committed at your own risk, financial or otherwise.

Strategic Education Inc. — September 02, 2025Sergio Richi Premium ✅
NASDAQ:STRA #StrategicEducation — Strategic Education Inc. (NASDAQ:STRA) Insider Activity Report | Consumer Defensive | Education & Training Services | USA | NASDAQ | September 02, 2025.
Price (Sept 2, 2025) : $82.12
On August 29th, Daniel Jackson, EVP & CFO of Strategic Education, stepped in with a 1,900-share open-market buy at $81.50 (~$155K). His total stake now tops 104K shares. It’s not the size of the purchase that matters here — it’s the timing: the transaction followed a Q2 earnings beat (EPS $1.52 vs. $1.42 est.) and nearly 8% YoY revenue growth, driven primarily by their Education Technology Services.
(SEC Form 4)
www.sec.gov
Insiders rarely commit fresh capital unless they see value that the market is missing. What stands out: institutions have been quietly adding — Marshfield Associates increased by 12,500 shares, and American Century expanded their stake earlier in the quarter. Insider ownership sits near 3.3%, and inflows continue despite a flat YTD chart.
1. Company at a glance:
• Runs Strayer University, Capella University, Torrens (AU/NZ), plus Sophia Learning & Workforce Edge.
• Focused on affordable, flexible, employer-aligned higher ed.
• Q2 revenue ~$300M, cash position $133.6M, dividend $0.60/qtr (~3% yield).
Market cap around $2B.
2. Catalysts on the horizon:
• Dividend payable Sept 15.
• Next earnings Oct 29 — potential follow-through if enrollment momentum stabilizes.
• Expanding EdTech footprint — Sophia & Workforce Edge gaining traction in B2B partnerships.
• Protocol adoption in Australia/NZ could re-accelerate international enrollment.
Charts:
• (5D)
Insider Trades:
STRA seasonality:
STRA Hedge Fund Flows:
STRA Ownership:
3. The setup:
Entry: $81.50–$82.06 (aligned with insider buy).
🎯 Take Profit 1: $111.00 (+35.27%)
🎯 Take Profit 2: $119.00 (+45.02%)
Base case: 35–45% upside in 6–12 months.
Bull case: test $119 on stronger EdTech growth + enrollment recovery.

NAS100 LongThis is now oversold on all timeframes, showing sellers exhaustion
There is a deep crab pattern on H4 and H1 displaying a potential reversal zone
There is great support at this level as daily trend is also pointing up
Double bottom on M15 showing divergence
Stoploss of 150 pips

Gold | H1 Double Bottom | GTradingMethodHello Traders.
Welcome to today's trade idea by GTradingMethod.
🧐 Market Overview
Gold has been making higher highs while RSI has been making lower highs, which is known as negative RSI divergence. This is an indication of weakening buying strength. For further confluence, this potential double top is at the ATH level, which could provide further resistance.
📊 Trade Plan
Risk/reward = 2.9
Entry price = 3 497.6
Stop loss price = 3 515.5
Take profit level 1 (50%) = 3 456.4
Take profit level 2 (50%) = 3 431.9
💡 GTradingMethod Tip
Always predefine your risk for every trade and always accept this risk. If you accept the risk, there can be no emotional pain. If you do not get emotional, you will interpret the market's information objectively.
🙏 Thanks for checking out my post!
Make sure to follow me to catch the next idea and please share your thoughts - I would like to hear them.
📌 Please note:
This is not financial advice. This content is to track my trading journey and for educational purposes only.

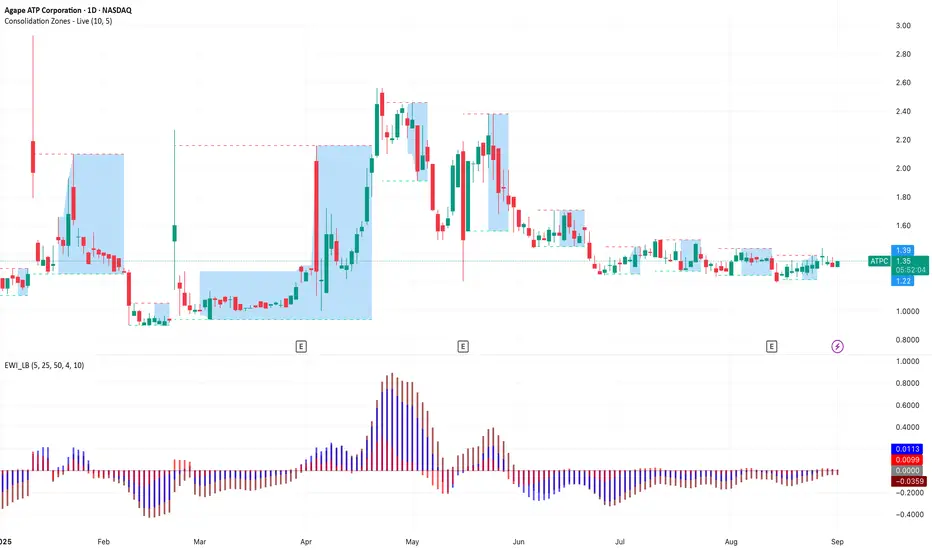
ATPC Poised for Breakout Amid Tight ConsolidationAgape ATP Corporation (NASDAQ: ATPC) is showing signs of strength as it trades within a tight consolidation range between USD 1.22 (support) and USD 1.39 (resistance). The recent +3.05% uptick to USD 1.35 signals renewed interest, with price stabilising after previous high-volume rallies.
Momentum, as reflected by the EWI_LB indicator, is gradually improving from a flat base, hinting at a potential bullish reversal. Should the stock break above the USD 1.39 resistance, it could trigger a momentum-driven rally, with upside targets toward USD 1.60 and beyond. Conversely, the USD 1.22 support remains a key level to watch for downside protection.
With consolidation narrowing and volatility compressing, ATPC appears primed for a directional breakout. Bulls may find an early entry opportunity ahead of a potential upside move.
XAU/USD | Breakout in Progress – Are You Ready for the Next ATH?By analyzing the gold chart on the 4-hour timeframe, we can see that, as expected from our analysis two days ago, the price began its bullish move from the $3383 zone and successfully hit all four targets at $3393, $3398, $3404, and $3409 — but it didn’t stop there! Gold continued its rally beyond those levels.
As anticipated in yesterday’s outlook, we closely watched the $3419–$3429 supply zone for a potential bearish reaction. When price reached $3424, it dropped to $3404, validating our second scenario as well. Although the drop could’ve extended further, the combined result of both scenarios delivered over 500 pips of total profit!
After hitting $3404, gold gained demand again — and with the release of the U.S. Core PCE data, this bullish trend strengthened, pushing price up toward its all-time high (ATH) near $3500. Gold is now trading around $3447, just 500 pips away from that historic level.
Given the increasing odds of a Fed rate cut in September, the bullish momentum is likely to continue. In my view, a new ATH for gold could be on the horizon in the coming weeks.
Hope this analysis helps you ride the wave — make the most of it! 💰📈
THE LATEST ANALYSIS 👇🏼
Will $3500 be the next stop for gold? 👀
👇 Drop your thoughts below & don’t miss the next update!

NASDAQ Eyes 23,565 Pivot as PCE Report LoomsNASDAQ – Update
The Nasdaq slipped on Friday as traders turned cautious ahead of the highly anticipated PCE inflation report, the Fed’s preferred gauge that could heavily influence the September rate decision. The release, expected before the bell, will likely set the near-term trend.
Technical Outlook:
The index reversed from resistance, showing signs of pressure ahead of the data.
A 1H close below 23,565 will confirm bearish continuation toward 23,435 → 23,295 → 23,170, especially if PCE comes in hotter than expected.
If the report is softer, bullish momentum may resume, targeting the ATH at 23,870, with extended resistance at 24,090.
Key Levels:
Support: 23,565, 23,435 – 23,295 – 23,170
Resistance: 23,690 – 23,870 – 24,090
📌 Bias: Neutral ahead of the PCE release. Expect high volatility and wait for confirmation at the pivot level before positioning.

Nasdaq “Tug of war”
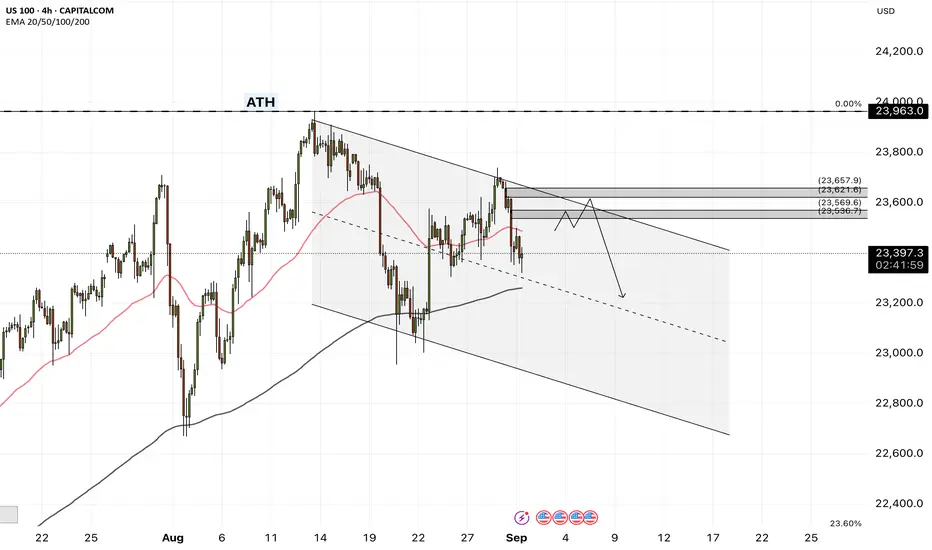
Nasdaq 100 has recently shown a significant shift in momentum on the 4hour chart, with bearish pressure taking hold. After a strong upward trend, the index has experienced a sharp decline, now consolidating within a critical range. The key to the next major move lies in the defence or failure of the defined support and resistance levels.
Current Market & Price Action
The price action clearly indicates a period of bearish dominance, marked by a substantial selloff from recent highs. The price is currently contained below a key resistance level at 23,515.6, which had previously acted as support. This consolidation phase is critical and suggests a tug of war between bulls and bears. The current price hovers around 23,406, leaving both a bullish reversal and a bearish continuation as plausible outcomes.
The Bearish Case : Reaching for 23,000
If the price continues to face rejection at the 23,515.6 level, the path of least resistance is to the downside. The next major target for sellers is the significant support zone between 23,000 and 22,900. This level is not only a major psychological number but also represents a strong structural support zone from previous price action.
A confirmed break below the current consolidation range, particularly the 23,331.4 level, would signal a continuation of the downtrend. A move to the 23,000-22,900 zone represents a potential drop of approximately 1.36%, as measured on the chart. Traders should watch for a decisive break of this support, which could trigger a much larger sell off.
The Bullish Case:
Reclaiming Momentum
For the bullish narrative to resume, the index must convincingly break and hold above the 23,515.6 resistance. A strong close above this level on the 4hour chart would invalidate the immediate bearish outlook and signal a potential reversal. If this occurs, the next logical target would be the higher resistance at 23,757.2, marking a potential recovery of the recent losses.
This bullish scenario would likely be fueled by a positive catalyst, such as favorable economic data or dovish comments from the Federal Reserve, which the market is currently anticipating. A successful break and retest of 23,515.6 would serve as a key entry signal for buyers aiming for higher levels.
Key Contextual Factors
Recent economic data and Federal Reserve policy expectations are likely to be major drivers for the Nasdaq's next move. As of early September, a rate cut by the Federal Reserve is heavily priced in, with some analysts predicting a move in the upcoming FOMC meeting. Any surprises to this expectation, either in a more hawkish or unexpectedly dovish direction, could trigger significant volatility. The tech heavy Nasdaq is particularly sensitive to interest rate policy, as it impacts company valuations and financing.
Summary and Outlook
Nasdaq 100 is at a pivotal point. The price is currently trapped between the 23,515 resistance and the 23,331 support.
* Bearish Trigger: A sustained break below 23,331.4 could lead to a test of the 23,000-22,900 support zone.
* Bullish Trigger: A decisive break above 23,515.6 could target the 23,757 resistance.
Given the recent price action and broader market uncertainty, the immediate risk appears to be to the downside. However, the market's direction will be confirmed by which of these critical levels is breached first.

NASDAQ holding the 4H MA200 can initiate the next rally.Nasdaq (NDX) has been trading within a Channel Up since mid May and currently is consolidating on its 4H MA200 (orange trend-line). Based on the 4H RSI we might be on a similar Higher Low as on May 30, having previously made a Channel Up bottom near the 1D MA50 (red trend-line).
The Bullish Leg that followed this Low was +6.80%, so we have our Target tailored on it at 24500.
-------------------------------------------------------------------------------
** Please LIKE 👍, FOLLOW ✅, SHARE 🙌 and COMMENT ✍ if you enjoy this idea! Also share your ideas and charts in the comments section below! This is best way to keep it relevant, support us, keep the content here free and allow the idea to reach as many people as possible. **
-------------------------------------------------------------------------------
💸💸💸💸💸💸
👇 👇 👇 👇 👇 👇

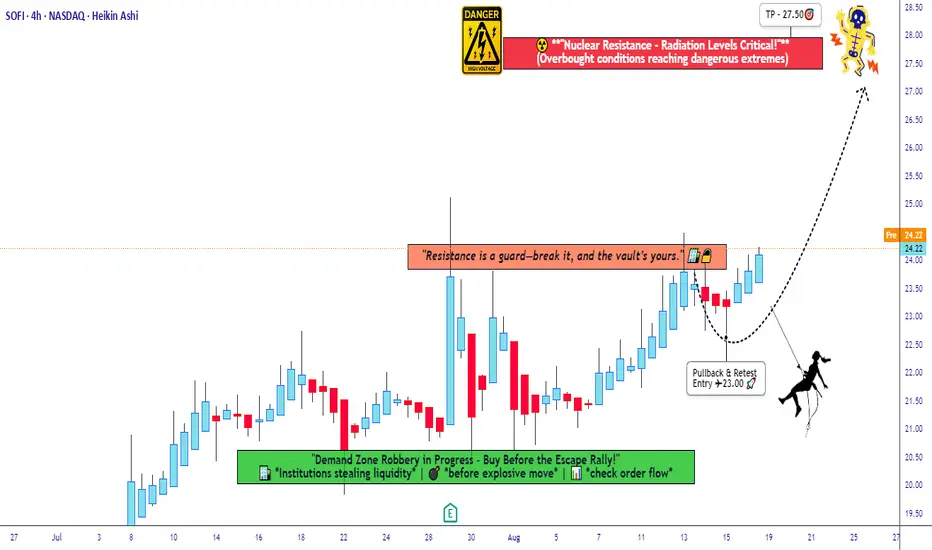
Breaking the Vault: SOFI Bullish Heist Plan Unlocked!🚨💼 SOFI Technologies Stock Heist Plan (Swing Trade) 💼🚨
Dear Robbers, Hustlers & Thief OG’s 🏴☠️💰
This time the target vault is none other than SoFi Technologies, Inc. (SOFI) 📈.
We’re planning a BULLISH STOCK HEIST with a layered entry strategy – the Thief’s signature move.
🕵️ Entry Plan
The heist doors open at ANY price level 🚪💥.
But remember… a real Thief never enters with one strike – we layer in with multiple limit orders (DCA style).
💎 Buy limit layers: 24.00 – 23.50 – 23.00 (you can increase your own layers if greedy 😈).
🛑 Thief Stop Loss (SL)
This is the escape hatch 🚨 – SL @ 22.00.
⚠️ Adjust your SL depending on your risk appetite, capital, and strategy.
(Every Thief OG has their own exit route 🏃💨).
🎯 Target – The Loot!
💥 Heavy resistance (electric fence ⚡) is spotted around 28.00.
So we aim to secure our stolen profits and escape clean at 27.50.
Don’t be greedy – once the vault is cracked, take the bag and RUN 🤑💼.
📢 Final Words from the Thief
Trading is a heist – not every move is safe, but every plan has an escape.
Stick to the layers, respect the SL, and collect the loot at target 🎯.
💖 Smash that BOOST if you’re part of the Thief gang 🔥💼
Let’s rob Wall Street together, one trade at a time 🚀🏴☠️
NAS100 - Trade Setup📊 NAS100USD – Multi-Timeframe Outlook
🔎 Monthly (1M)
Price moving inside a bullish wedge structure, with resistance tested near 25,200.
Support trendline holding firm, confirming strong macro bullish pressure.
Larger structure suggests Wave (5) still has room to expand toward 26,000+ if demand zones continue to hold.
🕰 Weekly (1W)
Elliott count clear: (1) → (2) → (3) extended, now correcting into (4).
Demand/FVG zones around 20,400 – 21,000 remain the critical swing support.
Next wave (5) projection aims at 25,000 – 26,000.
⏱ Daily (1D)
Structure consolidating within daily support, reacting from demand.
Breakout above 23,900 – 24,000 reactivates bullish impulse.
Invalidation lies below 22,950, where daily demand would fail.
⏳ 4H
Clear corrective retracement into daily demand (23,200 zone).
Long setup forming:
Entry: 23,222
Stop: 22,942
Target: 23,989
R:R ≈ 2.75
Short-term price action likely resolves higher into Wave (5) unless invalidation breaks.
🎯 Trade Plan
Bias: Bullish continuation into Wave (5)
Entry Zone: 23,200 – 23,300 (daily demand)
Targets: 23,989 (short-term), 25,200 – 26,000 (swing)
Invalidation: Daily close below 22,950

NASDAQ at Record Highs after US CPI report, but can it last?In today’s video, we break down the major market moves triggered by the July US CPI report. Headline CPI rose 0.2% month-over-month—right in line with expectations and a slowdown from the previous month. Year-over-year, headline inflation came in at 2.7%, just under the 2.8% forecast, while Core CPI rose 0.3% MoM (matching forecasts) but was a bit hotter at 3.1% YoY (vs. 3.0% expected).
These “not as bad as feared” inflation numbers kept hopes alive for a September Fed rate cut, pushing the odds of a cut to 96%. Markets responded strongly: the NASDAQ 100 closed at a record high, just shy of the 24K handle, with broad gains in tech and communication stocks, as traders bet on a more dovish Fed.
We also cover the technical setup for the NASDAQ 100 and key risk factors heading into the second part of August.
This content is not directed to residents of the EU or UK. Any opinions, news, research, analyses, prices or other information contained on this website is provided as general market commentary and does not constitute investment advice. ThinkMarkets will not accept liability for any loss or damage including, without limitation, to any loss of profit which may arise directly or indirectly from use of or reliance on such information.

NAS100 - Stock Market, in the Work Week!The index is below the EMA200 and EMA50 on the four-hour time frame and is in its short-term descending channel. If this channel is maintained and the specified range is reached, a close sale can be made with a suitable reward.
Economists anticipate that customs tariffs will push consumer prices higher while slowing economic growth in the coming months. Inflation is expected to accelerate, though not to the extreme levels of the 1970s when the term “stagflation” was coined to describe the combination of high inflation and economic stagnation. Unlike a recession—where the economy contracts and prices fall—stagflation features rising prices despite economic weakness. The U.S. economy could be heading toward a 1970s-style stagflationary environment, though analysts believe this time it will be far less severe.
Many experts argue that the U.S. is on the verge of a period of sluggish growth paired with accelerating inflation. The root cause lies in President Donald Trump’s tariffs, which simultaneously raise consumer costs and weigh on the labor market. However, economists expect this inflationary wave to be much milder than the double-digit annual increases that strained household budgets in the 1970s.
On the corporate front, Nvidia released its second-quarter earnings last week. Revenue reached $46.7 billion, exceeding analysts’ expectations of $46.23 billion. The company’s data center unit—the main growth driver—generated $41.1 billion, slightly below the $41.29 billion forecast. Adjusted earnings per share came in at $1.05, while the adjusted gross margin stood at 72.7%.
Looking ahead, Nvidia projected third-quarter revenue of around $54 billion, with a margin of error of plus or minus 2%. Its board also approved an additional $60 billion share repurchase program. Regarding China, the company reported zero sales of H20 chips to Chinese clients during Q2 and stated that no shipments are planned for that market in the near future.
In the earnings call, CEO Jensen Huang emphasized that the Chinese market could present a $50 billion opportunity for Nvidia this year. He estimated annual growth in China at nearly 50%, noting that the country is the world’s second-largest computing market and home to half of global AI researchers. Huang stressed that maintaining a presence in China is vital for the company’s long-term future, even amid ongoing political and trade tensions between Washington and Beijing.
On the monetary policy side, UBS warned that weakening the independence of the Federal Reserve—especially following Trump’s threat to remove Fed board member Lisa Cook—could have significant economic consequences. In its analysis of Jerome Powell’s speech at the Jackson Hole symposium, UBS described it as “classic Powell”: hinting at the possibility of a September rate cut to offset tariff effects but lacking a broader long-term framework for the evolving economy.
UBS emphasized that failure to strongly defend Fed independence could heighten political risks and destabilize markets.The bank warned that if the central bank comes under political influence, potential outcomes include the reemergence of inflationary instability, a one-percentage-point increase in real borrowing costs, and negative effects on fiscal policy, corporate investment, housing affordability, household savings, and speculative activity.
This week begins with one fewer trading day due to the Labor Day holiday, yet the economic calendar remains packed, with the labor market at the center of attention. On Tuesday, the ISM Manufacturing PMI for August will be released, followed by the JOLTS job openings report on Wednesday.
Thursday will be particularly important, bringing the August ADP private payrolls report, weekly jobless claims, and the ISM Services Index—all at once. These data points are especially significant given the recent large revisions to the Nonfarm Payrolls (NFP) report, which have renewed focus on the degree of convergence or divergence between ADP and NFP figures.
Historically, ADP and NFP reports have often diverged, leaving traders mispositioned when relying too heavily on ADP data. A recent example occurred in July, when ADP reported a decline of 33,000 jobs, while NFP the following day showed a gain of 147,000—well above expectations of 110,000. However, after NFP revisions, the actual trend proved more consistent with ADP’s numbers.
The most important event of the week will take place on Friday: the release of the August U.S. Nonfarm Payrolls report. Investors will be monitoring it closely, as any signs of labor market weakness could reinforce expectations for a Fed rate cut in mid-September.
Despite growing stagflation risks and heightened market volatility, Bank of America (BofA) suggested that autumn could be an attractive entry point for bullish investors. The bank cautioned that while volatility may exert short-term downward pressure, potential pullbacks could serve as buying opportunities.
The VIX volatility index fell to its lowest level of the year following Powell’s dovish remarks at Jackson Hole. Still, concerns about stretched stock valuations, a potential AI-driven bubble, and political risks tied to Fed independence suggest that this calm may not last.
NQ - Nasdaq Short Playbook for the next weeksIn the NQ, they took out the high and then hit it on the head day by day. It finally stopped below the 1/4 line. If you look closely, you see that this was the slanted zone of Support — just like the slanted Resistance.
"As above, so below."
...write me in the comments who said this already a couple hundred years ago §8-)
The small Modified Schiff Fork tells a story too.
Price reached the Center Line and got rejected. Now it's on its way down towards the small Fork's L-MLH. A break of it would indicate further selling ahead.
And the last bastion is the green support level, which stems from the second-to-last prior confirmed Swing Low.
Beyond this level, it's only a question of time before price hits the Center Line.
And — God forbid — below the Center Line, the Sh...t hits the fan. So you better run... behind price with a decent short trade and ride it down to the Abyss.
No worries, I'm with you §8-)
Happy Monday, folks!

Nasdaq Buy ZoneThe Nasdaq has remained strong, but I am not looking to initiate any longer term longs until we can pull back into our buy zone, highlighted in green. If we hold that zone our next push is to the Fibonacci extensions above.

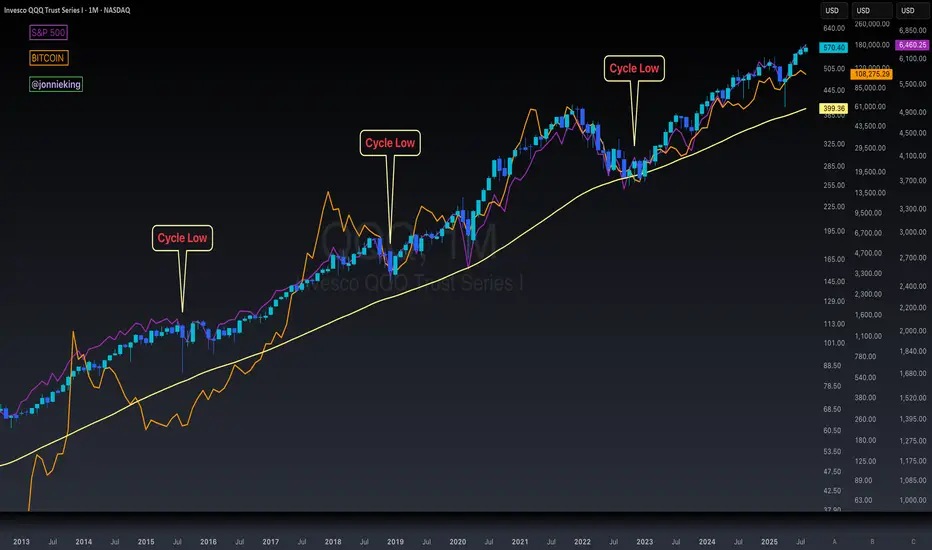
$BTC 4-Year Cycle Is NOT Dead According to $QQQ $SPXIt’s really weird cause everyone keeps telling me the ₿itcoin 4-year cycle is dead yet Nasdaq and S&P 500 follow nearly the exact same pattern with cycle lows 🤓
It’s almost as-if monetary and fiscal policy creates this boom and bust cycle every 4-years 🤔
Question for the “this time is different people”….
Will NASDAQ:QQQ and SP:SPX not have similar bear markets as we’ve seen in the past along with CRYPTOCAP:BTC ?
AFRM - NEW 52-WEEK HIGHAFRM - CURRENT PRICE :88.46
AFRM made a new 52-week high last Friday with burst in trading activity. The 52-week high resistance level near 82.00 - 83.00 is considered significant resistance level based on the share price history as it had been touched several times. One of the bullish signs for this stock is that the RSI is moving above 50 level steadily since 27 May 2025 - look at the red circle. Take note also that there is a rising support line - indicating demand is getting higher. There is possibility that the stock may trend higher in near term.
ENTRY PRICE : 83.00 - 89.00
TARGET : 97.00 and 104.00
SUPPORT : 78.00
Notes : For chart pattern lovers, look at the heliview chart (bigger picture). There is a CUP & HANDLE pattern !

NASDAQ Pullback Toward 23,160 as Index Holds UptrendHey Traders, in tomorrow's trading session we are monitoring NASDAQ for a buying opportunity around the 23,160 zone. NAS100 is trading in an uptrend, with price currently correcting toward this key support/resistance level.
Structure: The broader bias remains bullish, but price is pulling back after recent highs.
Key level in focus: 23,160 — a significant area where buyers may look to step in and resume the uptrend.
Fundamentals: Market sentiment remains supportive for equities, with U.S. data and Fed expectations keeping risk appetite intact. Any continuation of dovish Fed signals would add fuel to bullish NASDAQ momentum.
Trade safe,
Joe.
