NASDAQ 100: Bullish, But There Is a Headwind.....Welcome back to the Weekly Forex Forecast for the week of Aug 25 - 29th.
In this video, we will analyze the following FX market: NASDAQ (NQ1!) NAS100
The NASDAQ has a bearish FVG on the Daily TF. Should it fail, buy the pullback to it, as it will invert to a iFVG and support higher prices.
Should it fail, and we will know Monday/Tuesday, sells become valid, down to the Weekly bullish FVG.
Let the market unfold Monday, then look for valid entries.
Enjoy!
May profits be upon you.
Leave any questions or comments in the comment section.
I appreciate any feedback from my viewers!
Like and/or subscribe if you want more accurate analysis.
Thank you so much!
Disclaimer:
I do not provide personal investment advice and I am not a qualified licensed investment advisor.
All information found here, including any ideas, opinions, views, predictions, forecasts, commentaries, suggestions, expressed or implied herein, are for informational, entertainment or educational purposes only and should not be construed as personal investment advice. While the information provided is believed to be accurate, it may include errors or inaccuracies.
I will not and cannot be held liable for any actions you take as a result of anything you read here.
Conduct your own due diligence, or consult a licensed financial advisor or broker before making any and all investment decisions. Any investments, trades, speculations, or decisions made on the basis of any information found on this channel, expressed or implied herein, are committed at your own risk, financial or otherwise.
Nasdaq

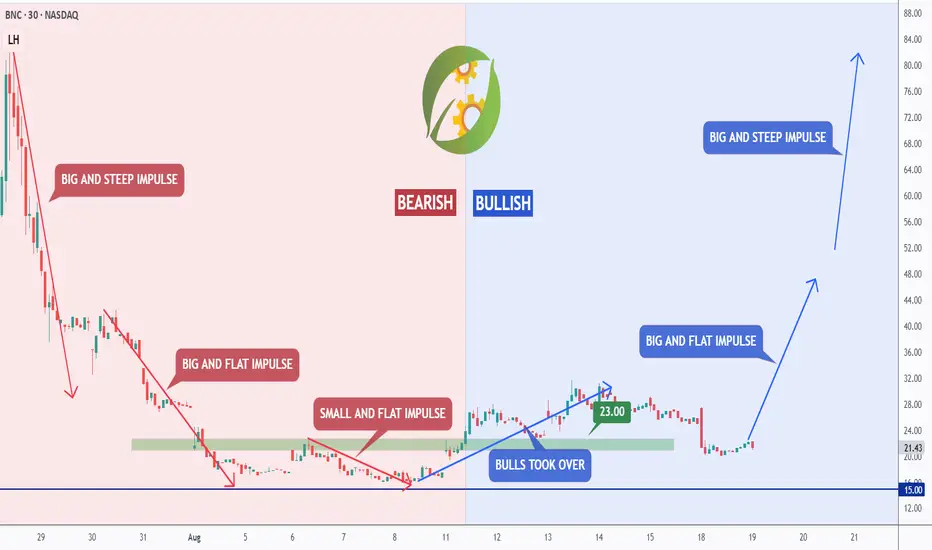
BNC - Shift in Momentum in Action!In our last update, we pointed out how BNC was holding its ground at the $12–$15 support zone. Now, we’re seeing that shift in momentum play out in real time; with the bears losing steam and the bulls taking over.
📊 Technical Update
The chart shows it clearly:
- In the bearish phase, every downward impulse got weaker — from big and steep to small and flat. Selling pressure was fading.
- Bulls stepped in at the $15 demand zone, flipping the structure bullish.
- Since then, we’ve seen a big and flat bullish impulse , hinting at healthy accumulation before the next leg.
🔎If momentum holds:
- First target: $50 => a structural resistance and psychological barrier.
- Second target: $82 => the top of the projected markup, filling a major price gap.
As long as $23 holds, and especially $15, the bullish case remains strong.
💡 Bigger Picture
This isn’t just a chart story — it’s backed by fundamentals. BNC is the first U.S.-listed company making BNB its core treasury asset , giving investors rare one-click exposure to a coin most can’t buy directly.
With over $500M already in BNB and a clear first-mover advantage, the mix of a strong macro narrative and a clear bullish shift makes this a setup worth watching closely.
📌 Previous BNC analysis is attached for context.
➡️ As always, speak with your financial advisor and do your own research before making any investment decisions.
📚 Always follow your trading plan => including entry, risk management, and trade execution.
Good luck!
All Strategies Are Good, If Managed Properly.
~ Richard Nasr
NAS100USD Analysis – POC Magnet, Demand Zone🔎 Context
Price action on NAS100USD is currently trading within a clearly defined range between the Value Area High (VAH) and Value Area Low (VAL) . Volume Profile highlights a key Point of Control (POC) around 23150 – the price level where the highest amount of trading volume has accumulated in this range.
In Smart Money terms, we also have a refined demand zone forming below, with the proximal line aligning closely above the POC. This overlap strengthens the case for the POC acting as a "magnet" and a potential support base.
⚡ Key Levels
Value Area High (VAH) : ~23880 – range resistance.
Value Area Low (VAL) : ~23010 – range support.
POC : ~23150 – high-volume node, magnetic level.
Proximal Line : Sitting just above POC, marking the edge of demand.
Refined Demand Zone : 22950 – 23050 region.
🏗 Structural Insights
A major structural failure occurred earlier near 23880, confirming supply above.
Price swept liquidity below 23050 before aggressively reclaiming the range.
Current trading sits just above POC and proximal, showing buyers defending.
A break and acceptance above 23510 (mid-range) opens the path back to VAH at 23880.
✅ Trade Scenarios
Bullish Case (Continuation to VAH)
If price sustains above 23516 and holds above the proximal/POC cluster, we can expect a continuation toward VAH (23880).
Targets: 23880 (VAH) → potential extension toward swing high.
Bearish Case (POC Magnet + Demand Retest)
Failure to hold above proximal/POC may drag price back into the POC magnet zone at 23150.
If momentum weakens further, a retest of the refined demand zone (22950 – 23050) is likely.
Below VAL (23010), imbalance could drive a deeper correction.
📌 Conclusion
The confluence of POC (fair value) and proximal demand (structural support) makes 23150 a pivotal level. Holding above it favors a continuation toward 23880 VAH , while a rejection would likely see price revert back to demand.
This setup showcases how Volume Profile levels (POC/VAH/VAL) can be combined with SMC concepts (demand zones & structural breaks) to create a high-probability framework.
💡 Trade safe, manage risk, and always wait for confirmations around these key levels before execution.

Classic tug-of-war NASDAQBias: Still broadly bullish on the daily—no true downside displacement, and price hasn’t closed below the last impulse up. But… we failed to close above recent 2-month highs and are sitting right at weekly equilibrium.
Where we are: Price is coiling around the 4H BISI low ≈ 23,790.50, which also aligns with ~50% of the weekly range. Nested inside is a 1H BISI with a bullish 1H OB just beneath. Classic tug-of-war spot.
Areas of Interest:
Above: 23,929 → PDH 23,962.75 → 24,000 BRN → 24,040–24,080 (upper imbalance).
Below: 23,713.50 (50% of 1H OB) → 23,596 → 23,501 → swing magnet 22,684.75 (D1 SIBI high).
Tell: The last “new low” on 1H needed two candles to actually close below and did so weakly. That shows sell-side lacks displacement unless we break structure decisively.
What flips the switch (clear invalidation logic)
Bullish reclaim: 15–60m close back above 23,790–23,804 (ETH close 23,796.5 / RTH close 23,804) and hold on a retest → long side favored.
Bearish break: Clean 1H close below 23,713 (and acceptance under it) → short side favored; you’re below the 1H OB and the nested BISI.
Two actionable trade plans
(Use your 5m/1m execution: wait for displacement through the trigger, then take the FVG or OB retrace inside the HTF level.)
A) Reclaim-and-go LONG (higher-probability if we hold above weekly EQ)
Trigger: 15–60m close above 23,790–23,804, then a controlled retest that holds (wick below, body close back above).
Entry zone: 23,790–23,804 (retest of 4H BISI low / prior close cluster).
Invalidation (stop): Below 23,713 (under the 1H OB mid) or tighter under the swing that forms your 5m/1m FVG entry (your call on risk).
Conservative SL: 23,690–23,705 (below the OB body).
Profit targets:
T1: 23,929 (first buy-side pools / inefficiency fill)
T2: 23,962.75 (PDH)
T3: 24,000 (round-number magnet)
T4 (runner): 24,040–24,080 (upper imbalance)
Trade management: Partial at T1, move stop to BE after M5 market structure shift in your favor or after T1 prints. Keep a runner if displacement expands.
B) Breakdown-and-acceptance SHORT
Trigger: Clean 1H close below 23,713 and a retest rejection (can use a 5m FVG inside 23,713–23,730).
Entry zone: 23,713–23,730 (failed reclaim of 1H OB mid / underside of the 1H BISI).
Invalidation (stop): Above 23,790–23,804 (back inside/above the 4H BISI low and prior closes).
Tighter intraday SL can sit above the 5m swing that breaks down.
Profit targets:
T1: 23,596
T2: 23,501
T3 (optional intraday): 23,440–23,460 (prior 1H demand base, if visible on your feed)
T4 (swing only): 22,684.75 (D1 SIBI high)
Trade management: Take partial at T1, trail above last M5 LHs. If New York lunch compresses, be quick to pay yourself.
Why these are the right spots
23,790–23,804 is a decision box: 4H BISI low + ETH/RTH prior close cluster + weekly EQ. Acceptance above = trend continuation likely; rejection = continuation of the rotation lower.
23,713.50 is the line in the sand intraday: it’s the 50% of your 1H OB and sits just beneath the 1H BISI. Lose it and you’ve removed the nearby bullish sponsor, opening the path to 23,596/23,501.
The lack of downside displacement on the last “new low” keeps a bullish continuation on the table—until we get that decisive 1H break/acceptance below 23,713.
Execution tips
Time-of-day: favor NY AM session for your displacement signal; Monday often ranges → reduce size until one side wins (as you noted).
Trigger discipline: do not anticipate the reclaim/break. Wait for the 15–60m close, then execute on 5m/1m FVG back into the level.
Risk: if trading the same idea across multiple accounts, stagger entries (one at level, one at 50% of the M5 FVG).
Quick reference (levels)
Bullish above: 23,804 → 23,929 → 23,962.75 → 24,000 → 24,040–24,080
Neutral box: 23,790.5 (4H BISI low / weekly EQ) ± a few ticks
Bearish below: 23,713.5 → 23,596 → 23,501 → 22,684.75

BNC - Where Cycles Meet Opportunity!In our last updates, we tracked how BNC NASDAQ:BNC shifted momentum and entered a bullish structure. Now, price is consolidating at a key support zone, a normal phase in bigger cycles, while the fundamentals continue to strengthen behind the scenes.
📊 Technical Analysis
- Cyclic rhythm: Price continues to respect cyclical lows (highlighted in green), suggesting we’re in a repeating accumulation/rebound structure.
- Support in play: The $20 - $21 level is being tested again, with the stronger $15 support zone still intact as a line in the sand for bulls.
- RSI confluence: Momentum indicators (RSI) are once again dipping into oversold territory, just as they did at the last local low, hinting at potential buyer re-entry.
- 200 MA: Price is sitting near the 200-period MA, adding another layer of dynamic support to watch.
If bulls hold the $20 area, we could see another cyclical rebound play out, targeting higher highs in the weeks ahead.
💡 Bigger Picture
What makes BNC stand out isn’t just its bold BNB strategy — it’s the timing . The crypto market is maturing, yet most U.S. investors are still locked out of direct BNB exposure. ETFs and sovereign funds are circling, but haven’t moved yet.
That means BNC is positioning itself ahead of the institutions - offering retail investors the rare chance to front-run Wall Street. It’s the kind of countercultural setup that often leads to the biggest asymmetrical gains: buy before the herd, hold before the headlines.
📌 Previous BNC analysis is attached for context.
➡ ️ Talk to your financial advisor and start your due diligence on CEA Industries (NASDAQ: BNC) before the institutions move in.
📚 Always follow your trading plan => including entry, risk management, and trade execution.
Good luck!
All Strategies Are Good, If Managed Properly.
~ Richard Nasr

GH 3D: breakout forming inside ascending channelThe price of GH continues consolidating within the top of an ascending channel, confirming bullish structure. The rectangular accumulation has lasted for over three months, with price staying above all major EMAs and MAs - a strong trend confirmation. On the last impulse, volume increased, and now the price is compressing again. A breakout with a retest would serve as a valid entry. First target lies near 61.38, second at 73.66, and third at 87.37 - aligned with the upper range of the medium-term Fibonacci extension. Fundamentally, GH remains a promising biotech pick amid sector rotation and potential Fed easing. EMAs and MAs sit below price, and D/A supports the breakout scenario. Waiting for confirmation before entering.

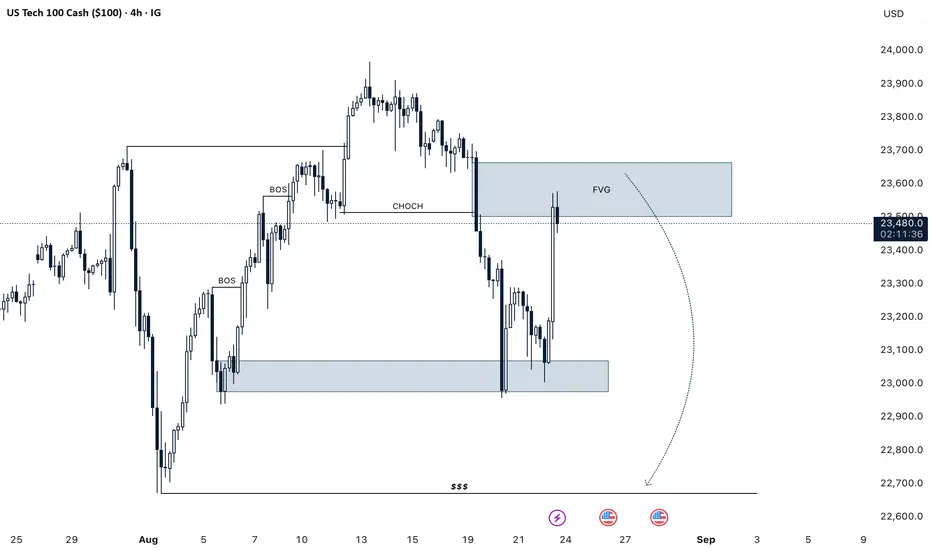
NASDAQ H4 We Are Selling Nasdaq Here Due To Market Structure Changed Bullish To Bearish NQ Gives Us Bearish Choch And Fair Value Gap Thats We Are Selling NQ Right Now Targeting Sell Sides Liquidity
Manage Your Trade According To Your Capital
And Follow Us For More Trades
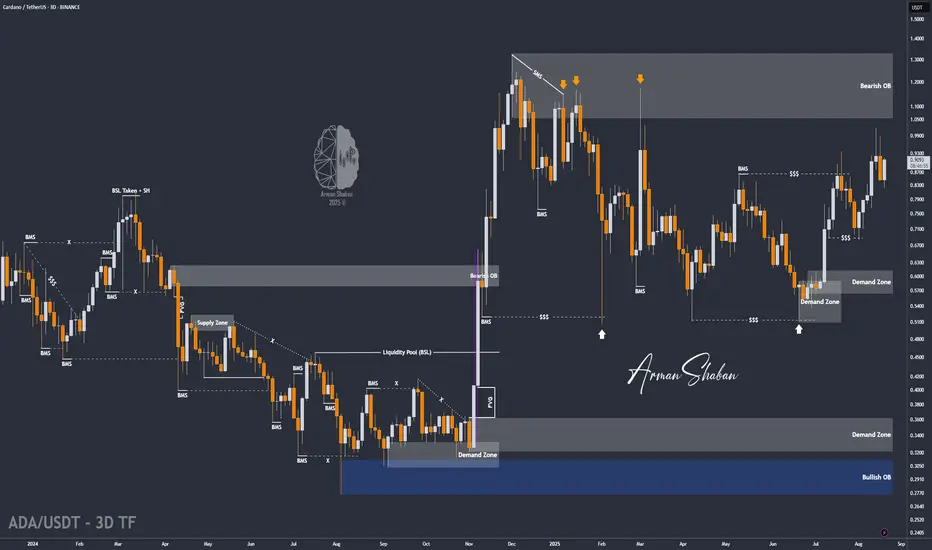
ADA/USDT | Cardano Breaks All Targets – Next Stop: Above $1?By analyzing the Cardano (ADA) chart on the 3-day timeframe, we can see that the price has surged exactly as expected, beautifully hitting all three targets at $0.85, $0.93, and $1! This move delivered an impressive 48% return. Following Jerome Powell’s remarks about the possibility of interest rate cuts in the coming months, Cardano saw renewed demand and has already risen from $0.82 to $0.91 so far. I expect this bullish momentum to continue, with a potential break and hold above the $1 level soon.
Hope you made the most out of this analysis!
Please support me with your likes and comments to motivate me to share more analysis with you and share your opinion about the possible trend of this chart with me !
Best Regards , Arman Shaban
Short idea nasdaq spotBased on -
- Correlation between eth and btc with equities shows potential short
- supply zone
- sector rotation (tech weak and small caps strong)
XAU/USD | Gold Hits Double Targets – Is Another Drop on the Way?Based on the 4-hour gold chart, we can see that the price was strongly rejected from the $3348 zone, exactly as anticipated, and dropped to $3321—successfully hitting both targets at $3334 and $3324, delivering over 250 pips of profit! Currently, gold is trading around $3328, and I expect another bearish wave to follow soon. The next downside targets are $3318, $3311, and $3301. This analysis will be updated shortly!
Please support me with your likes and comments to motivate me to share more analysis with you and share your opinion about the possible trend of this chart with me !
Best Regards , Arman Shaban

USNAS100 Update | Fed Pressure Keeps Market Under Bearish BiasUSNAS100 – Overview
Tech fright calms but Fed pressure grows
U.S. tech stocks appear to have stabilized after two sessions of sharp declines, but uncertainty persists as the Treasury market reacts to the latest Federal Reserve developments ahead of the central bank’s annual Jackson Hole symposium in Wyoming.
Technical Outlook
USNAS100 maintains a bearish setup while below 23,295.
A break and sustained close above this level would signal a potential bullish reversal.
📍 Key Levels
Pivot: 23,295
Support: 23,165 – 23,045 – 22,850
Resistance: 23,430 – 23,540 – 23,690
previous idea:

Advance Auto Parts, Inc. $AAP ~ Old DinoS RiSe ~ Bullish!Advance Auto Parts, Inc. engages in the supply and distribution of aftermarket automotive products for both professional installers and do-it-yourself customers. It operates through the following segments: Advance Auto Parts/Carquest U.S., Carquest Canada, Worldpac, and Independents. The company was founded by Arthur Taubman in 1929 and is headquartered in Raleigh, NC.

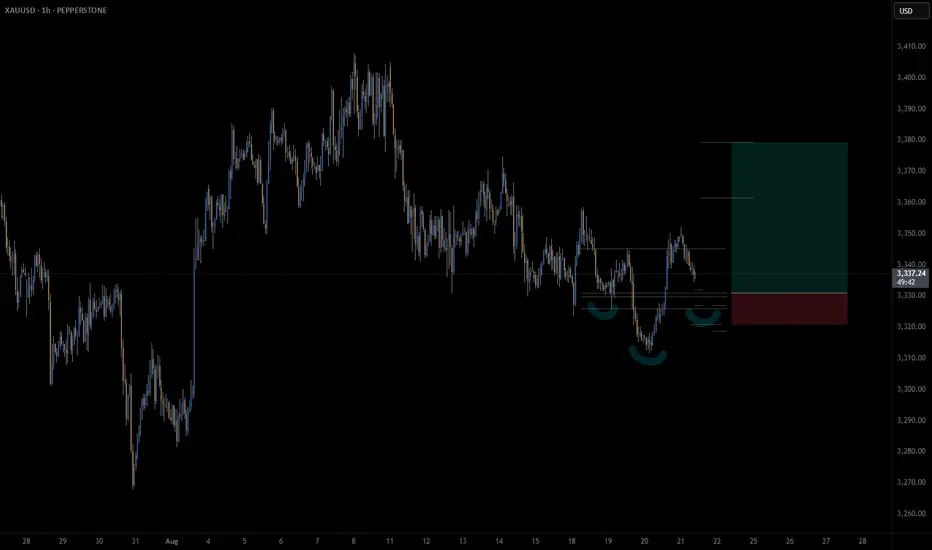
Gold - Inverse head and shoulders on hourly chartAn inverse head & shoulders is potentially forming on the hourly gold chart.
In this case, the IHS acts as a continuation pattern, as gold has been consolidating sideways for some time.
📊 Trade Plan:
Risk/Reward: 3.8
Entry: 3330.9
Stop Loss: 3320.8
Take Profit 1 (50%): 3361.5
Take Profit 2 (50%): 3379.3
💡 GTradingMethod Tip: Every moment in the market is unique. That’s why it’s crucial to predefine and accept your risk before entering a trade.
🙏 Thanks for checking out my post! Make sure to follow me to catch the next update. If you found this helpful, give it a like 👍 and share your thoughts 💬 — I’d love to hear what you think!
⚠️ Please note: This is not financial advice. This content is to track my trading journey and for educational purposes only.
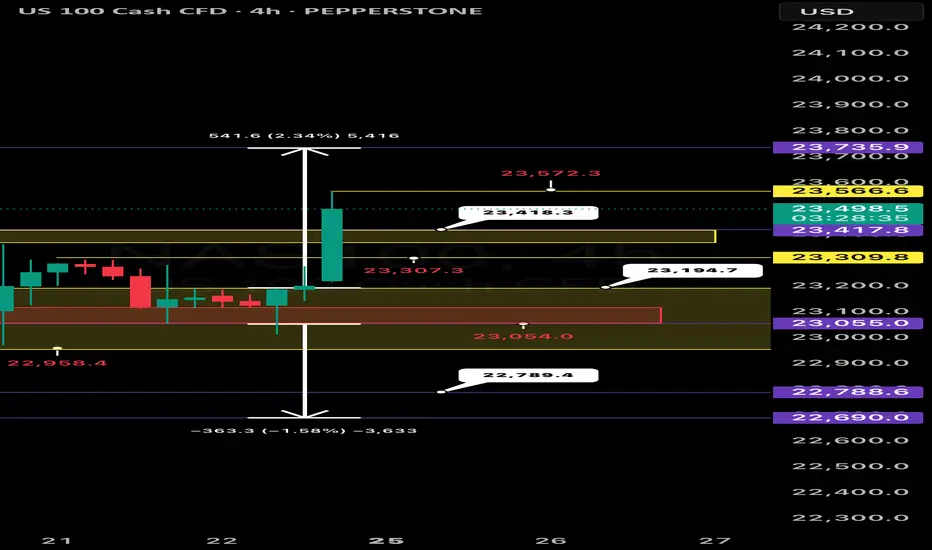
NASDAQ Technicals
NASDAQ (NAS100) Technical Analysis
Based on the 4 hour chart, NASDAQ (NAS100) is currently showing range bound price action, indicating a period of consolidation after a recent downtrend. This price behavior suggests a tug of war between bulls and bears, with neither side able to decisively break through key support or resistance levels.
Key Levels and Price Zones
The market is trading within a defined range. The key support zone is identified around 23,055 to 22,958. This is a critical area, as a clean break below it would signal a continuation of the previous bearish trend. The primary resistance zone is located between 23,309 and 23,418. This zone must be broken and held for a potential bullish reversal to be considered.
Bullish and Bearish Scenarios
* Bullish Scenario: For a bullish trend to resume, the price needs to break above the 23,418 resistance level. A confirmed breakout with a subsequent retest of this level as support could open the door for a move towards the higher resistance at 23,736. Traders should watch for a strong bullish candle closing above this zone and an increase in buying volume to confirm the breakout.
* Bearish Scenario: The bearish outlook remains intact as long as the price stays below the resistance zone. A break below the support zone around 22,958 would be a significant bearish signal. This could lead to a further drop toward the lower range's support at 22,690. A strong bearish candle closing below the support zone would provide confirmation.
Risk Management and Final Thoughts
Given the current consolidation, traders should be cautious about initiating new positions without clear confirmation. The most prudent approach is to wait for a definitive breakout above resistance or a breakdown below support. Trading within the range can be highly volatile and is generally considered higher risk. Placing stop loss orders outside of the key support and resistance zones is crucial to manage potential risks effectively. The current technical screenshot of NAS100 is one of indecision, and a significant move is likely on the horizon once one of the boundaries is breached.

NASDAQ (NQ1!): Started Retracing Last Week. Will It Continue?Welcome back to the Weekly Forex Forecast for the week of Aug 18 - 22nd.
In this video, we will analyze the following FX market: NASDAQ (NQ1!) NAS100
The NASDAQ reached ATHs Tuesday, and retraced for the rest of the week. Will there be some
follow through to open next week? Wait for the market to tip its hand and show you strength or weakness.
If the highlighted +OB fails, look for sells.
If the OB holds, buys until a bearish BOS takes place.
Enjoy!
May profits be upon you.
Leave any questions or comments in the comment section.
I appreciate any feedback from my viewers!
Like and/or subscribe if you want more accurate analysis.
Thank you so much!
Disclaimer:
I do not provide personal investment advice and I am not a qualified licensed investment advisor.
All information found here, including any ideas, opinions, views, predictions, forecasts, commentaries, suggestions, expressed or implied herein, are for informational, entertainment or educational purposes only and should not be construed as personal investment advice. While the information provided is believed to be accurate, it may include errors or inaccuracies.
I will not and cannot be held liable for any actions you take as a result of anything you read here.
Conduct your own due diligence, or consult a licensed financial advisor or broker before making any and all investment decisions. Any investments, trades, speculations, or decisions made on the basis of any information found on this channel, expressed or implied herein, are committed at your own risk, financial or otherwise.

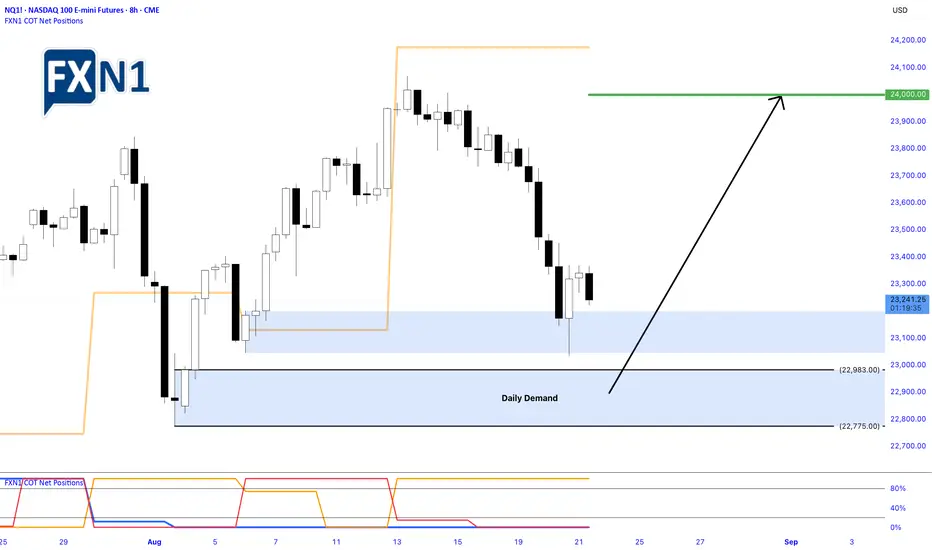
Nasdaq Bounces Off Demand Zone: Opportunities for a Bullish Rev.Yesterday, the Nasdaq experienced a notable rebound from the daily demand zone around 23,201, signaling buying interest at that level. However, as the EU trading session commenced, the index quickly shifted to a bearish impulse, reflecting ongoing market uncertainties and cautious sentiment among traders.
Key Levels and Opportunities
Despite the short-term pullback, the chart presents a compelling opportunity for traders to consider a "buy low" approach near the next demand zone at approximately 22,983. If the market finds support there, it could set the stage for a recovery, with the potential for the Nasdaq to rally back toward the 24,000 mark or even higher.
Market Outlook and Analyst Projections
Analysts remain optimistic about the index’s prospects, with many projecting a strong finish to the year. The Nasdaq, known for its volatility and lucrative trading opportunities, continues to attract traders seeking to capitalize on its upward momentum. As always, projections are optimistic, but the current technical setup suggests that there could be a favorable risk/reward ratio for those willing to position for a rally.
Final Thoughts
In a market characterized by rapid shifts and unpredictable moves, identifying key demand zones and monitoring reaction levels is crucial. The upcoming sessions could provide a prime entry point for those looking to buy dips, with the potential for the Nasdaq to forge ahead into the year’s final stretch with gains.
✅ Please share your thoughts about NQ1! in the comments section below and HIT LIKE if you appreciate my analysis. Don't forget to FOLLOW ME; you will help us a lot with this small contribution.
ATGL and 200% profitIf you bought this company between $15-18 and now have a profit of at least 100%, do not rush to sell it because there is still room to grow and reach $45-50 and you can easily make a profit of up to 200%.
Leave a comment and I will remind you to tell you the exact time to sell or buy signals of this type and profitable.
Stay with me and be profitable
Do you have any questions? Ask me in the comments
Don't forget to introduce me to your friends so that we can all profit together?
What do you have in mind that I should analyze for you? Comment for me.

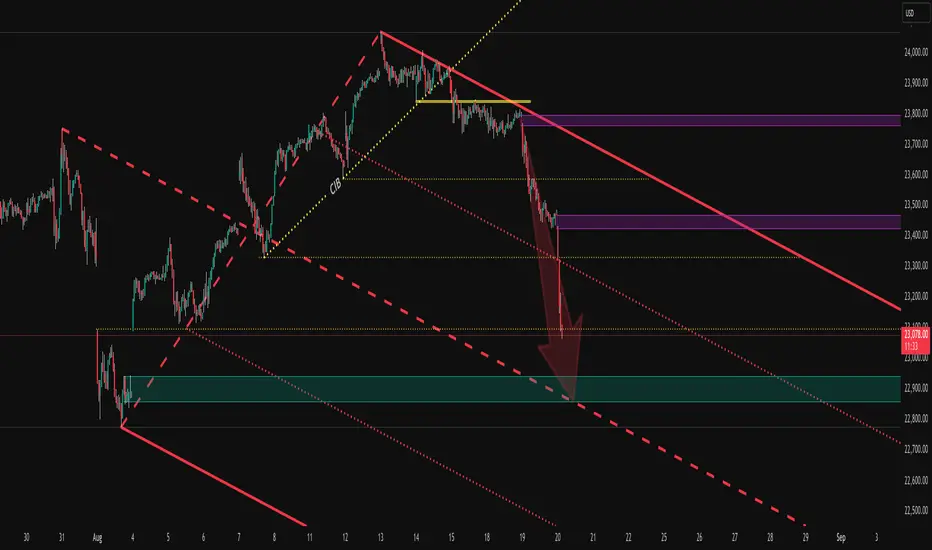
NAS100 Analysis – Bullish Channel Break & Retest in Progress📌 Key Highlights:
Bullish Channel Broken: Price failed to respect the upward trend channel. Although the candle bodies held above a support zone, price wicked through to test a lower level – indicating a weakening bullish structure.
Pressure Reversal Zone: Around 23,800, price ran out of momentum. Downward pressure entered the market, shifting the trajectory and breaking the previous bullish pattern.
Confirmed Zones via Retest: Each zone was respected by a clean retest, reinforcing their validity as support/resistance areas. This is textbook price action – confirming zones before continuation.
Current Candle Behaviour: The most recent green candle has no top wick, showing strong buyer conviction. However, the bottom wick is long, meaning bears are still present and applying pressure.
Decision Point: We’re at a critical moment. Will price break above this level to reclaim the channel — or reject and fill the imbalance left behind by the last bullish move?
📉 Scenario 1 – Rejection & Continuation Down
If price fails to break and close above this resistance, we could see a bearish continuation — potentially aiming for the next key support zone around 22,677.
📈 Scenario 2 – Bullish Recovery
If bulls maintain strength and close above this level with volume, we could see price climb back toward 23,500+ to retest the upper zone.
✅ Bearish Bias
Price broke below the bullish channel structure (a major technical shift).
Retests have confirmed lower zones — typical bearish continuation behaviour.
The current green candle has no upper wick (buyers trying to push), but a long lower wick shows bears are still active.
Downward pressure has already shifted momentum, and we’re now waiting to see if the zone holds.
🟡 However – Confirmation Needed
If price fails to break above this current resistance zone, then bearish continuation becomes confirmed.
If price closes strong above this level and reclaims the channel, the bias would shift neutral to bullish again.
📌 Final Bias Statement:
Bearish bias for now — unless price cleanly breaks back above the resistance zone. Current price action suggests a possible continuation down to fill the wick and test deeper support zones.
🧭 Watching for:
Candle body closures above or below key zones
Wick reactions showing liquidity grabs
Momentum shifts in volume
🔔 Stay sharp. Trade with confirmation, not emotion.
By AutoMarkets | Built. Not Begged.

Profit-taking hits NASDAQ100: Uptrend still intact? The NASDAQ100 extended its losing streak as investors keep taking profits in tech stocks
Advanced Micro Devices and Broadcom each lost around 1%. Intel slid over 7%. Apple , Amazon , Alphabet , and Tesla also posted losses. Market volume typically falls in late August, which can lead to wilder swings.
The index has now broken below 23,600 and is trading near 23,300, marking its steepest pullback since late June. The short-term trend that began in mid-July is still possibly intact, with higher highs and higher lows. However, volume on down days suggests sellers are active, which may reinforce near-term downside pressure.

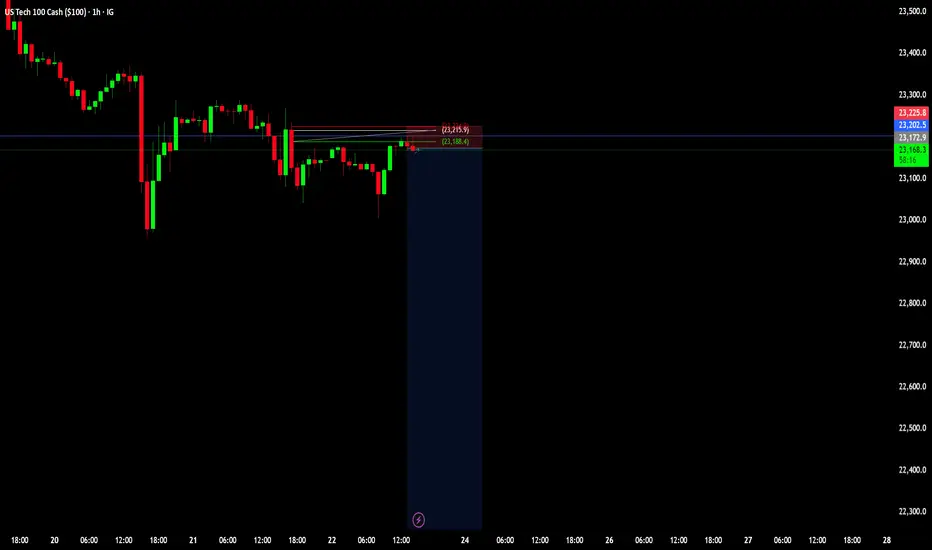
US100 Bearish Breakout!
HI,Traders !
#US100 made a bearish
Breakout of the key horizontal
Level around 23711.6 and the
Breakout is confirmed so we
Will be expecting a further
Bearish move down !
Comment and subscribe to help us grow !

NASDAQ (CASH100) – Buy the Dip or Trend ReversalThe Cash100 has been trending in an upward channel since May 2025.
Today, price has broken through diagonal support.
For confirmation that the upward channel is over, I will be looking for these signals:
✅ First signal: a 4H close below diagonal support.
✅ Second signal: a retest of the diagonal. If price fails to reclaim,
I’ll start looking for short setups if both signals above confirm.
What do you think — is the uptrend finally breaking, or will buyers step back in? 👀
Thanks for checking out my post! Make sure to follow me to catch the next update. If you found this helpful, give it a like 👍 and share your thoughts 💬 — I’d love to hear what you think!
Please note: This is not financial advice. This content is to track my trading journey and for educational purposes only.

NQ - If you're curious to where Nasdaq is going todayNot much to babble.
This is my intraday Chart.
TGT at the Centerline...where else? §8-)
Trade save. NO FOMO!!!