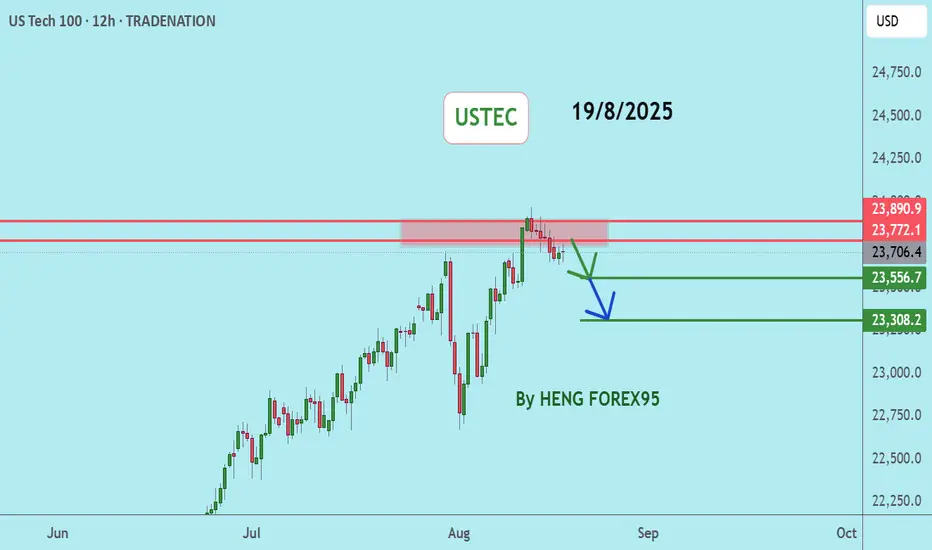
USTECUSTEC price is near the resistance zone 23772 - 238920. If the price cannot break through the 23920 level, it is expected that the price will likely go down in the short term. Consider selling in the red zone.
Nasdaq
NQ – Nasdaq follows the witch’s SPY prophecyNot only is the S&P 500 following the oracle in the SPY, but the Nasdaq has also given us a short signal. So, the scenario is the same as with SPY: short down to the Centerline.
For the indicator traders, I’ve also added the EMA(10) and EMA(20). Look at how well they’ve provided support so far. If the EMA(20) cracks, things will get hot. And if the CIB line (Change In Behavior) also breaks, then all hell breaks loose!
As already mentioned in the SPY post, it wouldn’t be a shame to take at least 50% of the profits you’ve accumulated so far. Because if it goes further up, e.g. above the U-MLH, you still have 50% left to benefit. If it goes down, we’ve already bagged 50%.
BTW: At the 1/4 line, we can usually expect support.
Exciting times, when maybe it’s better to sit still and keep your hands to yourself.
I’ll create the YT video with details tomorrow.
Happy profits to you all!

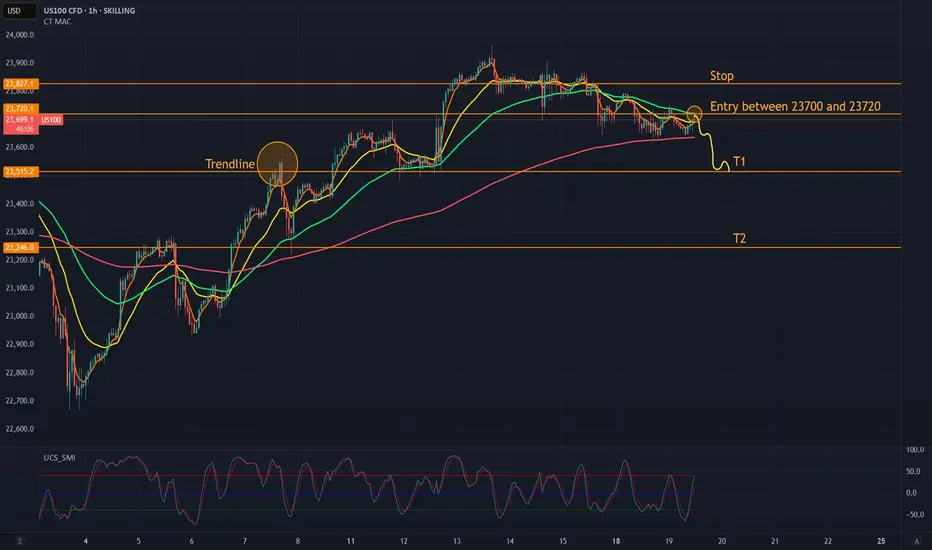
US100 – Short Setup Based on Visible WeaknessThe Nasdaq 100 (US100) is currently trading around 23,700 and has shown clear signs of weakness in the past few hours.
On the 1-hour chart, the price has tested the area between 23,700 and 23,720 multiple times but failed to break through. Moving averages (yellow, green, and red lines) are flat or turning downward, which signals that bullish momentum is fading.
Trade Setup
Entry Zone: 23,700 – 23,720
This area has acted as resistance several times, meaning the price keeps bouncing off it without breaking higher.
Stop Loss: Above 23,827
This is the most recent clear high on the chart. If price breaks above this level, the setup is invalid.
Target 1 (T1): 23,515
This level acted as support on August 13 and 15. Price bounced here twice, making it a realistic first target.
Target 2 (T2): 23,246
This level was support on August 8 and 9 and could be reached if T1 breaks.
Why Short?
Price is below the 21 EMA on 4h timeframe (yellow line): This is a sign of weakening trend strength.
Price rejected multiple times at the moving averages: Buyers failed to push higher.
No new highs: Even after several attempts, price could not break above 23,827.
What supports the short idea right now
Tech under pressure: Meta and Palantir are both trading lower after weak follow-ups on AI and earnings momentum. This drags on overall sector sentiment.
No new highs: The market failed again to break above the last swing high at 23,827, which strengthens the case for continued consolidation or downside.
Dollar strength creeping in : Ongoing geopolitical tension (Ukraine, Trump talks) is pushing the USD up slightly – this tends to weigh on tech stocks.
Jackson Hole caution : Markets are waiting for Powell’s comments later this week. Until then, many traders stay risk-off, which favors downside movement or at least weak buying.
Summary
📉 Short entry: 23,700 – 23,720
⛔ Stop: Above 23,827
🎯 T1: 23,515
🎯 T2: 23,246
No financial advice – just my personal trade idea based on what the chart shows and the current macro situation.
And don’t forget: the market has two moods – “not yet” and “too late.” :D
Could elevated valuations start weighing heavily on USTEC?
US equities fell sharply under pressure from stretched AI valuations. OpenAI CEO Altman cautioned that investors are overly excited about AI, warning that valuations have become “out of control.” Adding to the drag, Nvidia shares tumbled as China mandated domestic AI chips account for over 50% of local data center usage, raising concerns over export reliance. Markets now turn their focus to Fed Governor Waller’s speech and the FOMC minutes for clues on the rate-cut outlook.
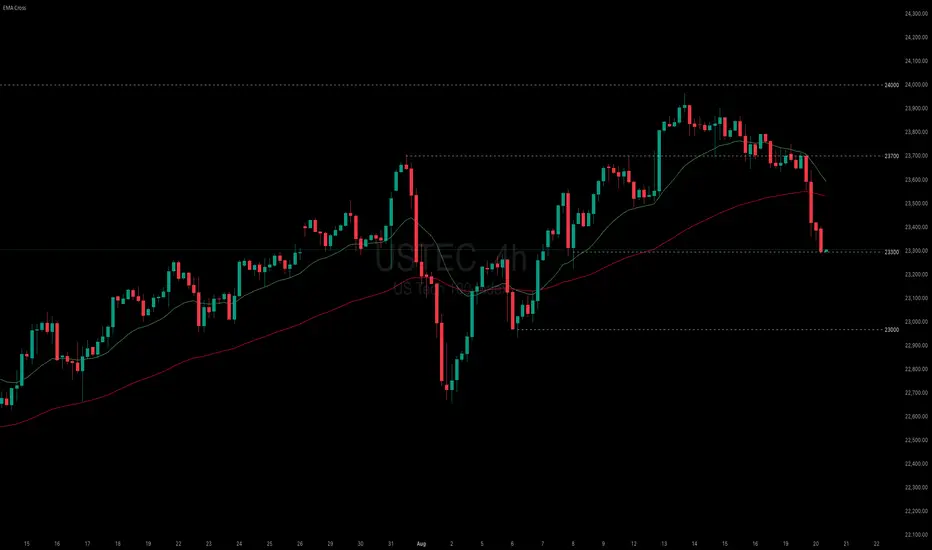
USTEC is sliding lower, approaching the support at 23300. The narrowing gap between EMA21 and EMA78 points to a possible shift toward bearish momentum. If USTEC breaks below 23300, the index could decline further toward the next support at 23000. Conversely, if USTEC climbs back above both EMAs, the index may gain upside traction toward the resistance at 23700.
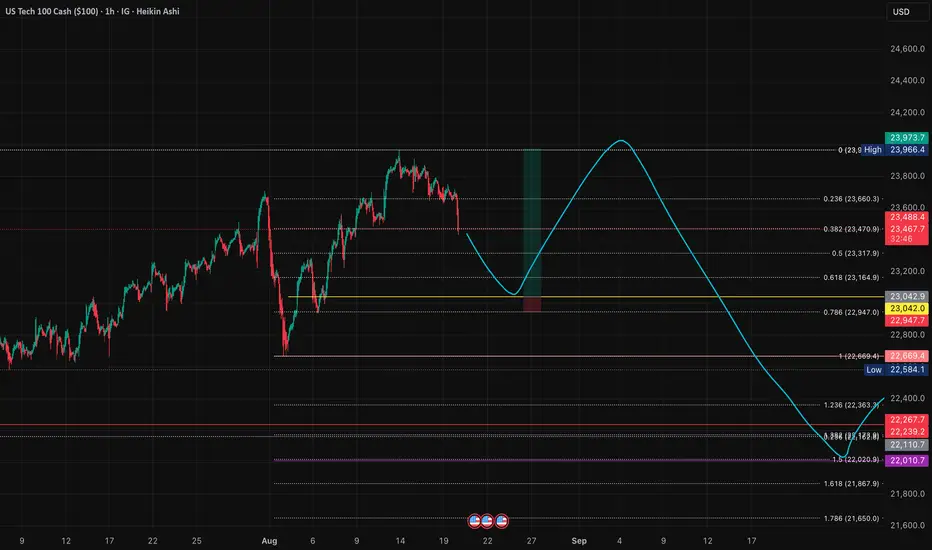
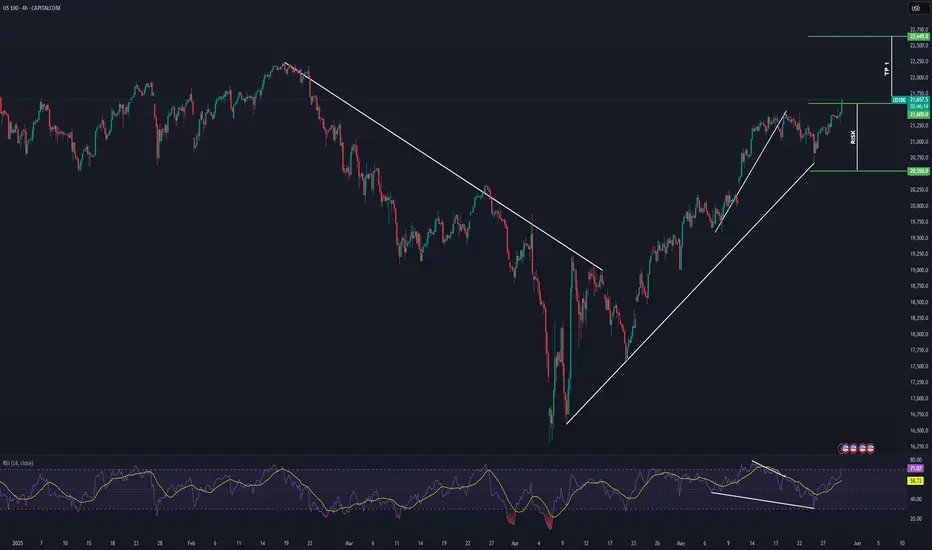
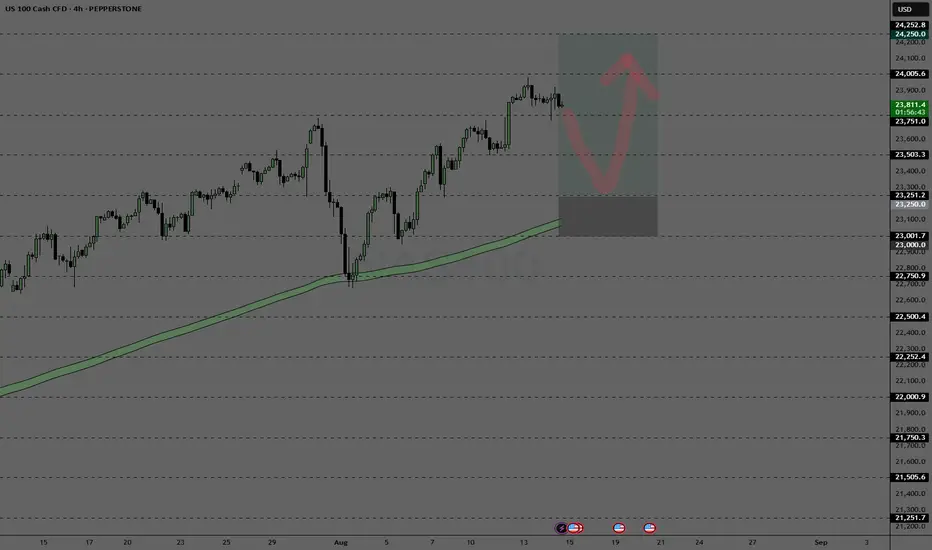
NASDAQ: 10:1 R/R Setup - One More High Before Major CorrectionSharing my current outlook on NASDAQ with a high-probability setup offering exceptional risk-reward. 📊
**🎯 The Setup:**
I'm expecting one more push to new all-time highs from the yellow line around 23,000. This would offer a **10:1 risk-to-reward ratio** with the stop loss just below the recent low. 🚀
**📍 Yellow Line Logic:**
This level represents my experience-based zone just shy of the 0.786 Fibonacci retracement. I've observed that when price reaches the 0.786 level, it tends to result in a complete reversal more often than not. This yellow line sits in that "sweet spot" where buyers typically step in. 🎯
**📈 Chart Structure Support:**
The overall chart pattern suggests a higher probability of making new highs rather than a complete reversal from current levels. The structure is bullish despite the recent pullback. ✅
**🔄 Bigger Picture Scenario:**
After the anticipated new high, I expect a significant retracement back toward the previous high (red line area). However, this would likely be just a healthy correction before the bull run resumes for the remainder of the year. 📉➡️📈
**🧠 Key Insight:**
Sometimes the best trades come when the market gives you that "one more push" setup. The risk is small relative to the potential reward, making this a compelling opportunity if the setup materializes. 💡
📈 **This trade setup offers a risk-to-reward ratio of 10:1.** Without including fees, the breakeven win rate for this trade would be approximately 9.09%. Knowing these figures in advance helps me avoid emotional trading. 🧠
💡 **Pro Tip**: If you often find yourself trading based on emotions, I recommend doing this type of pre-planning and quantifying your setups before execution — it can be a simple yet highly effective improvement. ✅
---
**Trading is simple.** You don't need multiple indicators or dozens of lines on your chart. A clean and simple chart often works best — it keeps your decisions consistent and reduces uncertainty. Sure, it might not look flashy, and my analysis may seem a bit "plain" compared to others… but that's how I like it. If you find this analysis useful, feel free to follow me for more updates.
---
*Disclaimer: This post is for general informational and educational purposes only. It does not constitute financial advice, investment recommendation, or a service targeting specific investors, and should not be considered illegal or restricted information in any jurisdiction.*
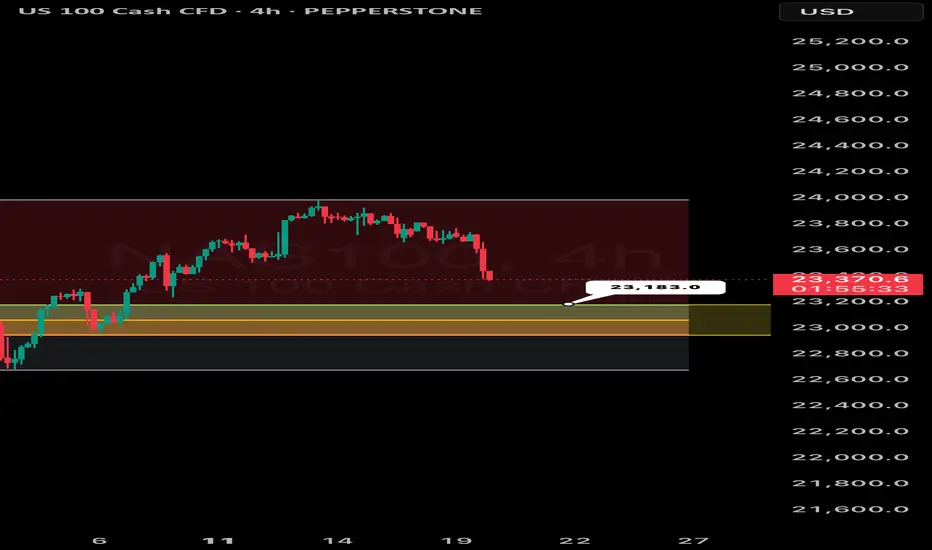
NASDAQ 100 (NAS100) potential reversal The NASDAQ 100 (NAS100 ) on the H4 timeframe it appears to be undergoing a period of consolidation within a defined range. As of approximately 20:46 (based on the timestamp), the index is trading around 23,383.6, having experienced a decline of -1.41% or 334.3 points.
Key Observations:
Recent Downtrend and Support Zone : The price action shows a clear downtrend leading into the current consolidation. The highlighted yellow zone around the 23,100 - 23,300 level seems to be acting as a support zone, preventing further immediate declines.
Resistance Zone : Conversely, an upper red zone around the 23,800 - 24,000 level is acting as resistance, capping the upside for the time being.
Range Bound Movement : The price is currently oscillating between these two defined zones, indicating a period of indecision in the market.
Potential Reversal Area : The fact that the support zone is holding after a significant down move suggests the possibility of a short-term reversal if buyers step in with conviction. However, this needs confirmation with a break above the resistance zone.
Breakout Scenarios :
Bullish Breakout: A sustained break above the 24,000 level could signal a continuation of an upward trajectory, potentially targeting previous highs.
Bearish Breakdown : Possibly, a break below the 23,100 level would likely confirm further downside pressure and could lead to testing lower support levels.
Technical Considerations :
Traders and investors should closely monitor price action within these zones. Look for confirmation signals such as strong candlestick patterns (e.g., bullish engulfing, bearish engulfing) or increasing volume on breakouts to gauge the strength and validity of potential moves.
Conclusion :
NASDAQ 100 is currently in a critical juncture. The consolidation within a potential reversal zone after a downtrend warrants careful observation. The direction of the next significant move will likely be determined by whether the support or resistance zone is broken decisively.
Why The Bubble Theory Makes No SenseIt seems like every other week with tech stocks making new all time highs, there is a constant chatter of claiming we're in a bubble. One of the classic signs of a bubble, is excessive leverage betting on ever higher returns.
This is a chart of securities margin loans provided by the Fed updated quarterly. As you can see since the 2008 financial crisis speculators have been very conservative with their use of leverage. It's almost like 2008 scared people so badly people more than a decade later are still behaving financially conservative.
Some of the rational for the talk of a bubble is historically high PE ratios, but this can be explained by massive reinvestments into AI infrastructure by the biggest tech companies. The more investments they make the higher the PE ratios look.
The key ingredient of a bubble is leverage and besides the small spike of it post-covid, there is no sign of excessive speculation.
Remember tech stocks are absolutely going to have a pullback likely next year or 2027, but the fear of a dot-com era bubble is just simply unfounded.

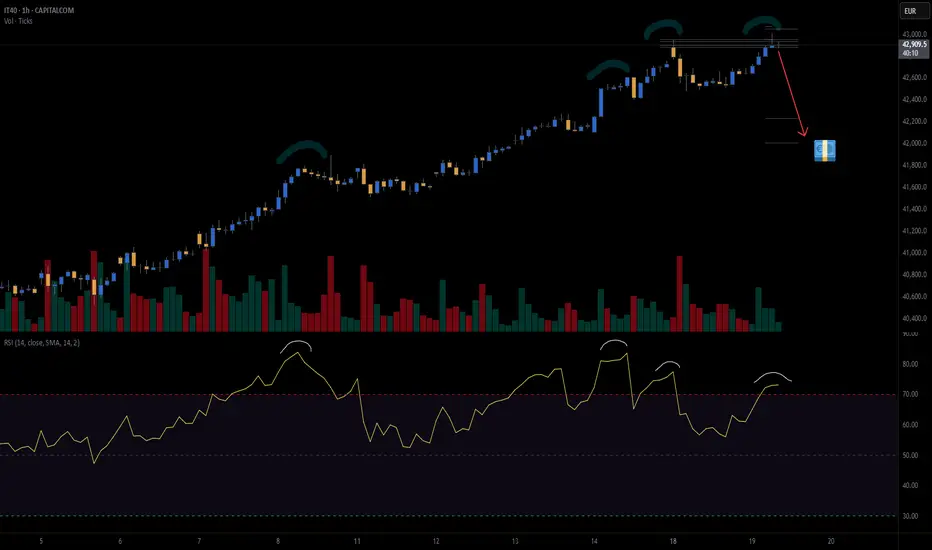
IT40index (IT40CASH) - potential double top on 1 hour chartAll my variables lined up for entry.
Before I enter any trade, I predefine and fully accept my risk. That way, if the trade is a loser, there’s no emotional pain—just probability playing out. Over the long run, my edge means more wins than losses.
Key Details
📊 Risk/Reward: 4.6
🎯 Entry: 42 910
🛑 Stop Loss: 43 072.4
💰 Take Profit 1 (50%): 42 230
💰 Take Profit 2 (50%): 42 012
Stop loss is set. Now it’s time to sit on my hands and let the market do its thing.
💡 #GTradingMethod Tip: The hardest part of trading is often doing nothing. Trust your process, not your emotions.
Thanks for checking out my post! Make sure to follow me to catch the next update. If you found this helpful, give it a like 👍 and share your thoughts 💬 — I’d love to hear what you think!
Please note: This is not financial advice. This content is to track my trading journey and for educational purposes only.
Resideo Technologies, Inc. ~ Bullish (Short-term)...Resideo Technologies, Inc. engages in the manufacture and development of technology-driven products and solutions that provide critical comfort, energy management, water management, and safety and security solutions to residential and commercial markets. It operates through the Products and Solutions, and ADI Global Distribution segments. The Products and Solutions segment offers temperature and humidity control, thermal water and air solutions, as well as security panels, sensors, peripherals, communications devices, video cameras, other home-related lifestyle convenience solutions, cloud infrastructure, installation, and maintenance tools, and related software. The ADI Global Distribution segment provides low-voltage security products including security and life safety, access control and video products and participates significantly in the broader related markets of smart home, power, audio, ProAV, networking, communications, wire and cable, and data communications. The company was founded on April 24, 2018 and is headquartered in Scottsdale, AZ.

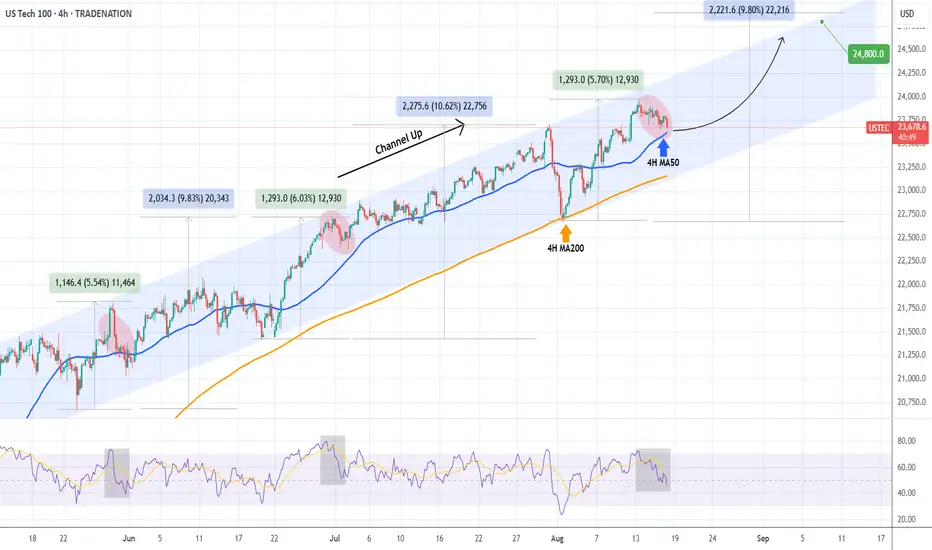
NASDAQ testing its 4H MA50. Will it offer Support?Nasdaq (NDX) has been trading within a Channel Up since May 11 and is approaching its 4H MA50 (blue trend-line) today following a Wednesday initiated pull-back.
Technically this is so far a normal correction for this pattern, which offers a short-term buy signal as the 3 times during those 4 months that it broke convincingly, it rebounded on or close to the 4H MA200 (orange trend-line).
As a result, if the 4H MA50 offers a rebound, we could see a +9.80% rebound from the 4H MA200, the minimum that this Channel Up has delivered upon a Bullish Leg. That gives a Target of 24800.
-------------------------------------------------------------------------------
** Please LIKE 👍, FOLLOW ✅, SHARE 🙌 and COMMENT ✍ if you enjoy this idea! Also share your ideas and charts in the comments section below! This is best way to keep it relevant, support us, keep the content here free and allow the idea to reach as many people as possible. **
-------------------------------------------------------------------------------
Disclosure: I am part of Trade Nation's Influencer program and receive a monthly fee for using their TradingView charts in my analysis.
💸💸💸💸💸💸
👇 👇 👇 👇 👇 👇
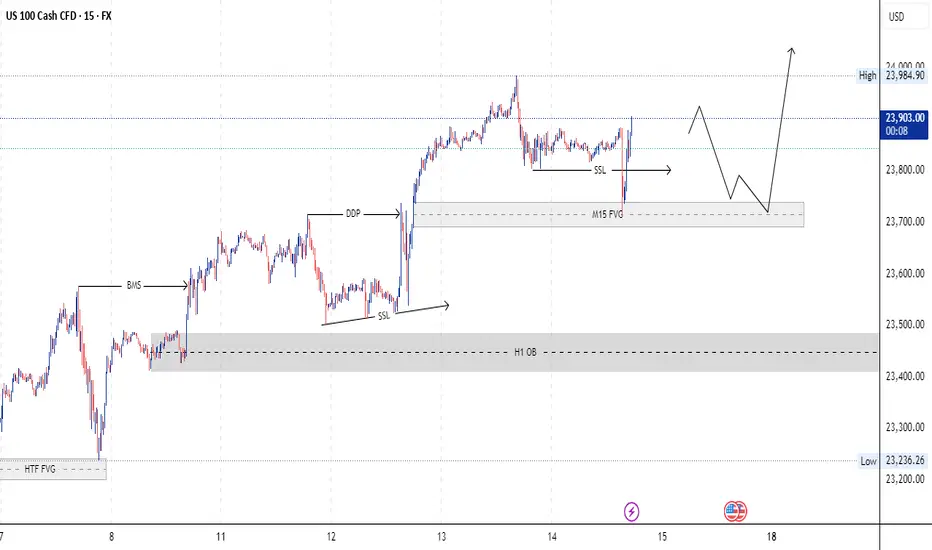
NAS100 3 Drive Pattern Correction Wait For BoS📊 The NAS100 has pulled back after a strong bullish run and is currently facing some pressure 📉. I’m watching a three-drive pattern that appears to have extended into a fourth drive, followed by a corrective phase 🔄. From a smart money perspective, liquidity is often targeted after a strong expansion in trend — patterns like the three-drive can frequently lead to a deeper retracement before the continuation resumes. With that in mind, I’m anticipating the possibility of a further pullback before positioning for a potential long setup on a bullish break of structure 🚀 (not financial advice).

NAS100 - Stock Market Waiting for Jackson Hole Leak!The index is above the EMA200 and EMA50 on the 4-hour timeframe and is trading in its ascending channel. If the index corrects downwards towards the specified demand zones, you can buy Nasdaq with appropriate reward and risk.
According to a recent report from JPMorgan, the new U.S. tariffs could have significant repercussions for the American economy. The bank projects that these tariffs may reduce U.S. GDP by as much as 1% while simultaneously pushing inflation higher by up to 1.5%.
This year’s tariff hikes represent the largest increase since World War II, with the effective tariff rate rising to nearly 18%. With the expiration of tariff exemptions on imports under $800, consumer goods prices are expected to climb further.
JPMorgan has warned that both consumers and businesses may struggle to absorb these additional costs, raising the risk of stagflation. Meanwhile, monthly inflation has remained within the 0.3% to 0.5% range, suggesting that the Fed’s preferred inflation gauge could rise toward 3% to 3.5%.
As U.S. tariffs have surged to their highest levels in decades, revenues from these duties hit a record $28 billion in July. According to estimates by the Tax Foundation, tariff revenues could total about $2.2 trillion by the end of this decade. However, this is also expected to trim GDP by around 0.9%.
Research conducted by Yale University indicates that tariff policies could reduce annual household income by approximately $2,400, since part of these tariff costs are passed on to consumers by companies.
At the same time, Berkshire Hathaway, led by Warren Buffett, has made notable adjustments to its investment portfolio:
• It purchased 6.6 million shares of steelmaker Nucor.
• It added 5 million shares of healthcare insurer UnitedHealth.
• It fully divested its holdings in T-Mobile US.
• It trimmed its stake in Apple by 6.7%, reducing its position to 280 million shares.
Meanwhile, Goldman Sachs reiterated its outlook that the Federal Reserve will cut interest rates three times before the end of 2025. The projected reductions include three 25-basis-point cuts in September, October, and December. Additionally, two further cuts are expected in 2026, bringing the terminal rate down to the 3%–3.25% range. Markets have already increased their bets on a September rate cut. Recent weakness in inflation and employment data has paved the way for such accommodative policy measures.
Federal Reserve Chair Jerome Powell is scheduled to deliver a speech at the Jackson Hole Symposium on August 22, 2025—an event that has become an unofficial policy-setting platform. Analysts at Morgan Stanley expect Powell will attempt to temper market expectations for a 50-basis-point cut in September. Given the political pressures and mixed economic signals, Powell may only endorse a 25-basis-point cut, or potentially push back against easing altogether.
Any of these outcomes could disappoint markets, especially if Powell fails to deliver clear guidance. His speech may therefore play a decisive role in shaping U.S. monetary policy for the remainder of the year and could drive heightened volatility across markets.
Although this week’s economic calendar features several important housing and manufacturing reports, the spotlight will remain firmly on the Fed. On Tuesday, July housing starts and building permits data will be released. Wednesday brings the FOMC’s July meeting minutes, speeches from key Fed officials Waller and Bostic, and the official kickoff of the annual Jackson Hole Symposium.
On Thursday, markets will digest a packed set of data, including the Philadelphia Fed manufacturing index, weekly jobless claims, the preliminary August S&P Global PMI, and July existing home sales.
The highlight of the week will be Friday, when all eyes turn to Jerome Powell. His annual Jackson Hole speech is expected to provide fresh clues about the Fed’s policy trajectory—guidance that could strongly influence market direction in the weeks ahead.

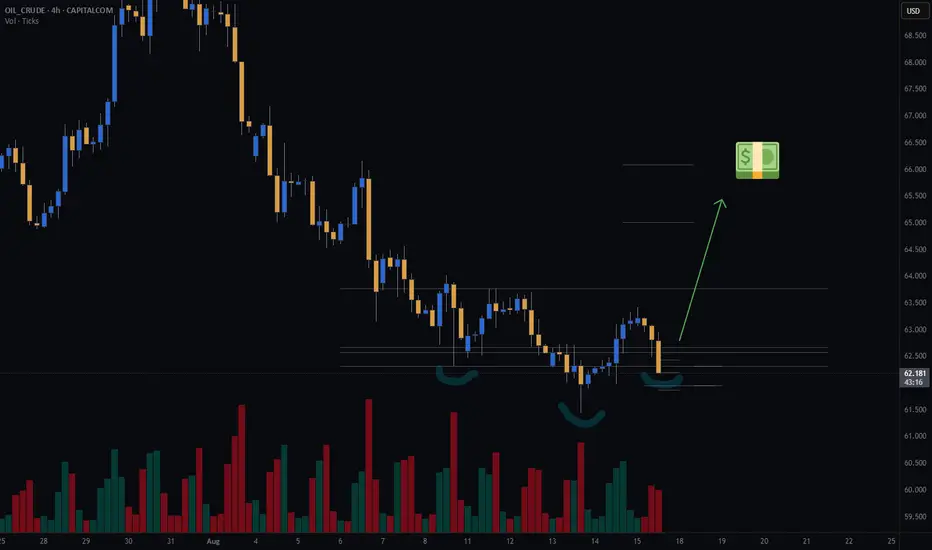
Oil - Potential long with inverse and shouldersWatching Oil for a potential long entry. There appears to be an inverse head and shoulders forming on the 4-hour chart.
If the 4-hour candle closes within the expected range and 3 of my other variables are met, I’ll consider entering a long position.
Trade Details:
📊 Risk/Reward: 3.8
🎯 Entry: 62.658
🛑 Stop Loss: 61.941
💰 Take Profit 1 (50%): 65
💰 Take Profit 2 (50%): 66.08
#GTradingMethod Tip: Predefine and accept your risk before entering a trade.
Thanks for checking out my post! Make sure to follow me to catch the next update. If you found this helpful, give it a like 👍 and share your thoughts 💬 — I’d love to hear what you think!
Please note: This is not financial advice. This content is to track my trading journey and for educational purposes only.
E-mini Nasdaq-100 Trading Setup for sellers ^)We have completed cup and handle pattern here...
So after the price is still high!
We may see some price gain additional, something like 13-18% .
So we have two option here for the sellers, wait and sell from marked point 1 or 2 .
P.S. This is very long time range position. ( Something like 200-800 day ).
Have a profit in your day!
Thanks.

#202533 - priceactiontds - weekly update - nasdaq e-miniGood Day and I hope you are well.
comment: Neutral. Bull flag but market is holding above the breakout price around 23800. Bears need a strong move below 23600 for more downside and if bulls stay above 23800, we can only assume sideways to up movement. I doubt we get another leg up but I have been wrong on that couple of times now. No longs for me above 23500. Only interested in a breakdown for 23400ish or 23000.
current market cycle: bull trend - peak bubble
key levels for next week: 22800 - 24100
bull case: Bulls remain in full control but a bigger pullback is expected. Until that happens, we can continue up since market is living on momentum and it’s still going strong. For a change bulls need to be trapped and that has not happened since April. Every dip buy was profitable but I do think it’s way beyond overdone and moronic to buy above 23000.
Invalidation is below 22700
bear case: Bears still do not have anything here. It doesn’t ever matter if we print 24000 or stay below 23848, until we see big bear bars closing on their lows again, this is likely going higher and bears can not hold short here where the strategy is hope. Nothing has changed last week. Bears need big red bars closing on their lows and trapping late bulls.
Invalidation is above 24100
short term: Neutral at best. Bears not doing enough and btfd is still going strong. Could easily do another test for 24100 before turning but I would not be surprised if we grind down to 23400ish and test the trend line again.
medium-long term - Update from 2024-08-10: Bear trend did not start last week. Sad but ok. I am still only interested in seeing this bubble popping.

NASDAQ After the Fireworks: Bearish Setup LoadedAfter the classic 4th of July rally, I stepped in on the short side of Nasdaq, targeting 22,000 and 21,400 zones. The market structure shows exhaustion, and with the cloud retest failing to hold new highs, I positioned accordingly.
Technical:
• Price stalled at prior expansion highs with tight compression near 23,000.
• Daily FibCloud offered resistance confirmation.
• Bearish risk-reward skew forms after extended rally and thin retraces.
• Volume divergence spotted.
Fundamentals:
Multiple overlapping uncertainties:
• Trump confirmed tariffs will take effect on August 1, threatening a 10% surcharge on BRICS-aligned nations.
• Treasury Secretary Bessent anticipates several trade deal announcements within 48h—but stresses quality over quantity.
• Bank of America maintains its base case of 0 rate cuts in 2025, citing strong economic data and sticky inflation risks.
The combination of tariff escalation, hawkish monetary expectations, and global trade friction creates a perfect backdrop for volatility and correction—especially in overextended tech indices like the Nasdaq.
Note: Please remember to adjust this trade idea according to your individual trading conditions, including position size, broker-specific price variations, and any relevant external factors. Every trader’s situation is unique, so it’s crucial to tailor your approach to your own risk tolerance and market environment.

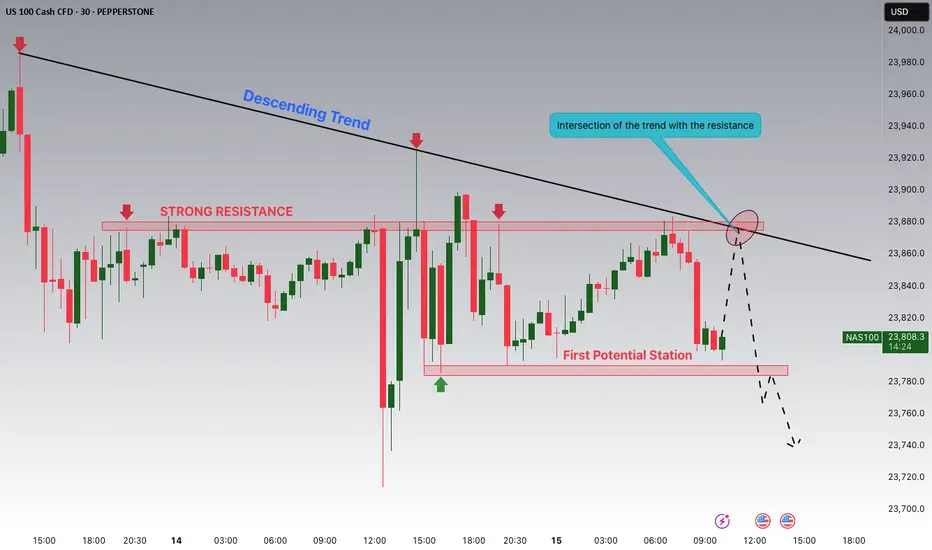
NASDAQ is Nearing the Intersection of The Trend with Resistance!Hey Traders, in today's trading session we are monitoring NAS100 for a selling opportunity around 23,875 zone, NASDAQ is trading in a downtrend and currently is in a correction phase in which it is approaching the trend at 23.875 support and resistance area.
Trade safe, Joe.
NASDAQ Potential Bullish ContinuationNASDAQ price action seems to exhibit signs of potential Bullish momentum as the price action may form a credible Higher High (after tarriff delays on the EU) with multiple confluences through key Fibonacci and Support levels which presents us with a potential long opportunity.
Trade Plan:
Entry : 21600
Stop Loss : 20550
TP 1: 22649
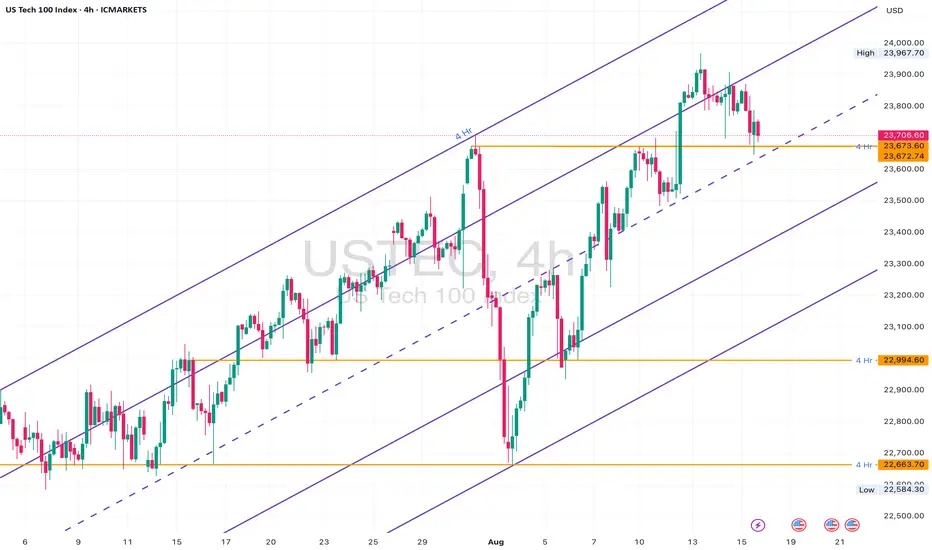
NAS100 4H Channel: Bounce or Breakdown?NASDAQ100 has been trending within a clean ascending channel on the 4H timeframe. We’re now sitting at a crucial decision point — the midline and horizontal support around 23,670.
This zone has historically acted as a strong S/R pivot. If price holds, we could see another bullish bounce toward 24,000+. But if it breaks and closes below, we may get a clean drop toward the bottom of the channel — with 23,200 and 22,663 as targets.
Plan:
• Wait for a 4H close above or below the 23,670 level
• Bullish scenario: Bounce toward upper channel (~24,300)
• Bearish scenario: Drop to lower channel boundary with incremental TP levels
Structure:
• 4H rising channel structure still intact
• Price testing midline zone
• Horizontal level at ~23,670 adds confluence
• No confirmed break of channel yet
Key Zones:
• Support: 23,670 (midline + structure support)
• Bullish flip zone: 23,967
• Bearish continuation zones:
‣ 23,200
‣ 22,994
‣ 22,663
US30 - potential head and shoulders on 30min chartWatching the US30Cash for a potential short setup.
A head and shoulders pattern may be forming on the 30-minute timeframe. I’m still waiting for confirmation on some key variables before entering the trade.
Trade Details:
📊 Risk/Reward: 2.7
🎯 Entry: 45 224
🛑 Stop Loss: 45 261
💰 Take Profit 1 (50%): 45 141
💰 Take Profit 2 (50%): 45 084
Thanks for checking out my post! Make sure to follow me to catch the next update. If you found this helpful, give it a like 👍 and share your thoughts 💬 — I’d love to hear what you think!
Please note: This is not financial advice. This content is to track my trading journey and for educational purposes only.

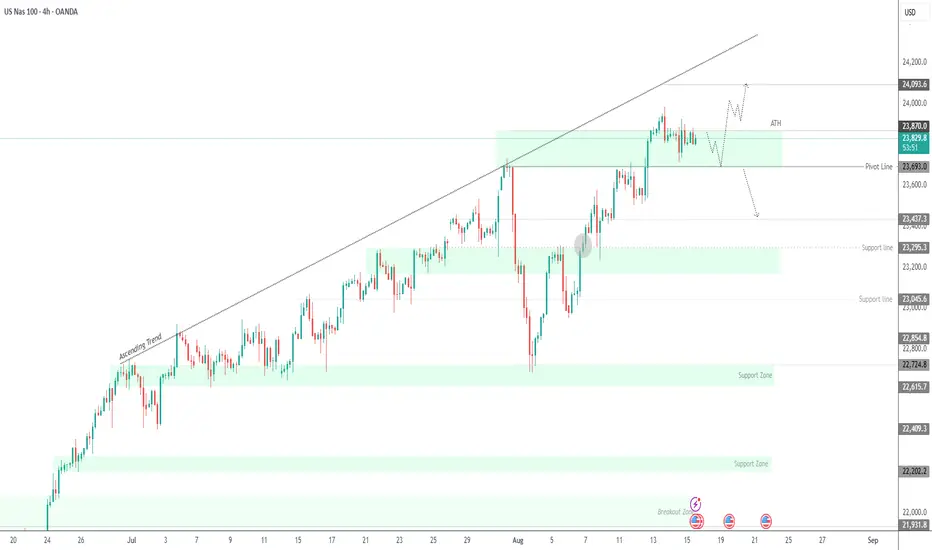
USNAS100 | Geopolitics in Play – Key Pivot at 23870USNAS100 Overview
Geopolitical developments currently influence the price.
Technical Outlook:
While below 23870, the price is expected to drop toward 23690. To confirm continuation of the bearish trend, it needs a 1H close below 23690.
A 4H close above 23870 would shift momentum bullish toward 24090.
Pivot: 23870
Support: 23690, 23540, 23440
Resistance: 23940, 24090
NAS100 Looking for a retrace and into a key levelLooking for a potential buy position and holding.
This is my markup and potential buy position.
I am not a financial advisor.
Update on the Nasdaq trade idea I shared last night.An update on the trade idea of NASDAQ last night where I was anticipating a buy from the marked zone with other possible Point Of Interested marked out aswell.
Price behaved exactly the way I was anticipating, even though it hasn't went really far as of yet.