Nasdaq 100 Advances Ahead of Tech Giants’ EarningsNasdaq 100 Advances Ahead of Tech Giants’ Earnings
As early as tomorrow, after the close of the main trading session, quarterly results will be released by Microsoft (MSFT), Meta Platforms (META) and Tesla (TSLA), with Apple (AAPL) scheduled to report on Thursday.
As the chart shows, the Nasdaq 100 index (US Tech 100 mini on FXOpen) climbed today to its highest level since early November, rising above 25,900. Since the start of the week, the index has gained around 1.8%. This appears to reflect a shift in market sentiment:
→ Geopolitical risks are fading. Market participants seem to have adapted to the news flow surrounding tariffs and Greenland. After the initial shock, current political rhetoric is increasingly viewed as a negotiating stance rather than a genuine threat to business.
→ Confidence in market leaders. Prices are factoring in expectations that tech giants will outline roadmaps showing how their record AI spending will begin to generate net profits as early as this year.
Technical Analysis of the Nasdaq 100 Chart
Price action in the Nasdaq 100 index points to demand-side dominance:
→ the downward trajectory seen between 16 and 21 January was broken by bulls on the 22nd, with a spike in volatility (visible on the ATR indicator) highlighting a sharp change in market behaviour;
→ recent fluctuations have formed an ascending channel (shown in blue);
→ the market has confidently recovered from the bearish gap seen at the start of the week;
→ the broad bullish candle on Monday, 26 January, signals a demand imbalance, with the rally zone showing signs of support (marked by a rectangle).
From the supply-side perspective:
→ the move above the 13 January high could turn out to be a false bullish breakout (another one, judging by Nasdaq 100 price action over recent months);
→ price is currently hovering near the upper boundary of the existing channel.
A modest technical pullback in the coming days cannot be ruled out, although the key driver is likely to be market reactions to upcoming corporate earnings.
This article represents the opinion of the Companies operating under the FXOpen brand only. It is not to be construed as an offer, solicitation, or recommendation with respect to products and services provided by the Companies operating under the FXOpen brand, nor is it to be considered financial advice.
Nasdaq100analysis

NASDAQ100 Breakout Watch — Is a New Upside Leg Starting Now?📈 NASDAQ100 Swing Trade Opportunity — Bullish Breakout Play
🟩 Asset: NASDAQ100 (Index CFD)
⚡ Trade Type: Swing Trade — Bullish Plan Confirmed
🧭 Trade Thesis
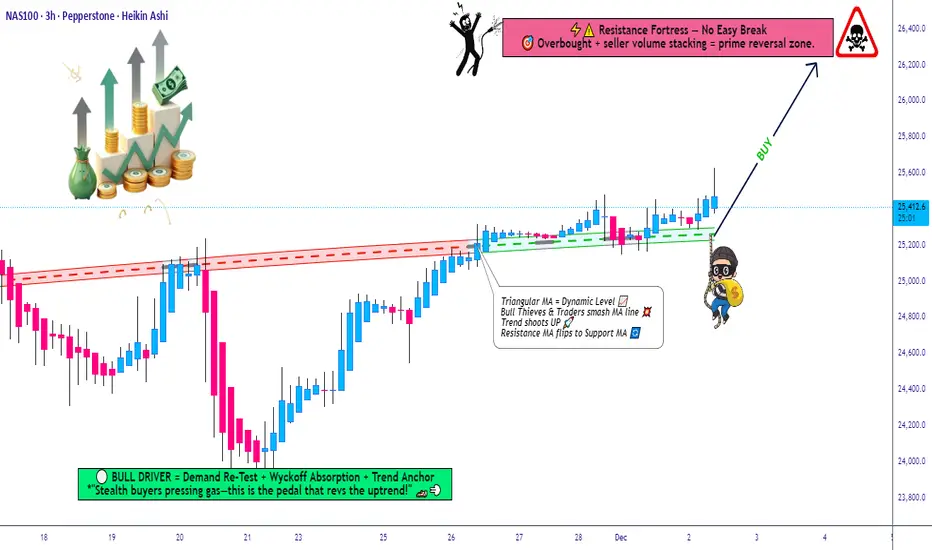
The index has confirmed a bullish setup following a Triangle + Moving Average breakout, strengthening upward momentum and favoring dip-buying behavior.
To reflect the Thief layering method, this plan uses multiple staggered limit orders to accumulate positions efficiently across volatility pockets.
📌 Entry Plan (Thief Layering Method)
💰 Entry Style: “Any price level allowed — Thief uses layers”
Buy Limit Layers:
24,900
25,000
25,100
25,200
(Feel free to increase or customize layers to fit your personal risk and liquidity preference.)
🛑 Stop-Loss (SL)
🔻 Thief SL: 24,500
Dear Ladies & Gentlemen (Thief OG’s), adjust SL based on your personal risk and strategy.
This is not a fixed recommendation, only a reference zone.
🎯 Target (TP)
⚡ The High-Voltage Electric Gate Zone around 26,200 acts as major resistance because of:
Overbought readings
High-liquidity trap behavior
Historical reversal probability
Exit with profits before heavy sellers activate.
Again — you decide your own TP based on your risk tolerance, not mine.
📊 Market Logic Behind the Move
Breakout structure confirmed
Trend continuation supported by triangle compression
Index ETF flows show short-covering + rotation back into tech
Momentum accelerates above 25,200 zones
Cleaner upside path until liquidity wall at 26,200
🔎 Related Pairs to Watch (Correlation Insight)
1️⃣ NASDAQ:NDX / NASDAQ:QQQ
Direct ETF mirror of NASDAQ100
Useful for checking volume, market depth, and real-time breakout confirmation
2️⃣ SP:SPX / NYSE:ES (S&P 500)
High correlation (approx. 0.85+)
A strong SPX supports tech continuation; weakness warns of index-wide pullback
3️⃣ TVC:VIX (Volatility Index)
Inverse correlation
If VIX stays below key volatility thresholds, bullish NASDAQ continuation is more reliable
4️⃣ FX:USDOLLAR / DXY
Tech usually performs better when the Dollar weakens
A rising Dollar can slow or cap NASDAQ bullish momentum
5️⃣ TVC:US10Y / Yields
NASDAQ moves inversely with yields
If yields drop, NASDAQ accelerates
If yields spike, prepare for turbulence or failed breakouts
📘 Summary
Bullish plan confirmed via Triangle + MA Breakout
Thief layering entries positioned smartly into volatility
SL/TP guidance flexible for trader customization
Strong correlation checks available across SP:SPX , TVC:VIX , TVC:DXY & yields
INTC Weakness Exposed — Are Sellers Still In Control?🔥 INTC Bearish Profit Play — Smart Money Thief Mode Activated?
📌 Asset
INTC — Intel Corporation
NASDAQ Exchange | Stock Market Profit Playbook
🕒 Swing Trade / Day Trade Setup
🧠 Market Bias
📉 Primary Bias: Bearish
Price structure shows weak momentum, failed bullish continuation, and distribution behavior near resistance. This setup favors controlled downside continuation rather than aggressive longs.
🎯 Trade Plan (Bearish Thief Setup)
🔑 Entry
📍 Flexible Entry Zone
➡️ Any favorable price level aligned with bearish confirmation
(Structure break, rejection, or weak bounce)
🛑 Stop Loss
⚠️ Thief-Style SL: 38.00
Dear Ladies & Gentlemen (Thief OGs),
This stop-loss level is NOT a recommendation.
Risk management is your own responsibility — trade at your own risk and adjust according to your strategy.
🎯 Take Profit Zones
Primary Target 🎯
✅ TP-1: 34.00
Extended Target (Escape With Profits) 💰
🚀 TP-2: 31.00
📌 Why TP-2 matters:
Strong historical support zone
Oversold conditions likely to appear
Potential trap & reaction bounce
Broader market correlation suggests profit-taking is wise here
Dear Ladies & Gentlemen (Thief OGs),
These targets are NOT mandatory.
Secure profits based on your own plan and risk tolerance.
🔍 Technical Breakdown (Clean & Professional)
📉 Lower-High Structure intact
❌ Failed bullish continuation
📊 Weak volume on pullbacks
🧠 Distribution near resistance
🔄 Correlation with tech sector weakness
This supports a sell-the-rally / continuation downside approach rather than bottom-fishing.
🔗 Related Pairs & Correlation Watchlist
Keep an eye on these correlated instruments 👇
NASDAQ:NDX (Nasdaq-100)
➝ Tech weakness usually accelerates downside in INTC
NASDAQ:SOXX (Semiconductor ETF)
➝ Sector confirmation strengthens bearish conviction
NASDAQ:NVDA / NASDAQ:AMD
➝ Relative strength comparison — INTC underperformance adds pressure
TVC:DXY (US Dollar Index)
➝ Strong USD often pressures equities, especially tech
📌 If these pairs remain weak, INTC downside probability increases.
🧠 Master Trader Notes
This is NOT financial advice
No prediction — only reaction
Capital preservation > hero trades
Take profits when market offers them
If anything here feels aggressive, scale down — the market will always give another setup.
✨ “If you find value in my analysis, a 👍 and 🚀 boost is much appreciated — it helps me share more setups with the community!”
⚠️ Disclaimer
This is a thief-style trading strategy just for fun.
Educational & entertainment purposes only.

ZM: buyers are back and momentum is buildingZoom Communications spent a long period outside investors’ focus after the post-pandemic correction, but the fundamental picture is gradually improving. The company remains profitable, holds a strong cash position, and carries no critical debt. Zoom continues to evolve from a single-product company into a broader enterprise communication platform, expanding Zoom Phone, Contact Center, and AI-driven business tools. As interest returns to stable SaaS models and the tech sector regains strength, ZM is starting to look undervalued again.
From a technical perspective, price is trading inside a rising channel. After an extended accumulation phase, buyers have confirmed their presence. Price holds above the 50 and 100 EMA, while the 200 EMA acts as long-term dynamic support. The recent impulse was supported by increasing volume, signaling institutional participation. Market structure remains bullish with higher lows intact.
The current area represents a confirmation and accumulation zone. As long as price holds above local support, adding to positions remains justified. The first target is the upper boundary of the channel and prior highs. If momentum accelerates, price may extend toward the next resistance zone, where partial profit-taking becomes reasonable. A breakdown below the confirmation zone would invalidate the bullish scenario.
Markets often move when they feel quiet. The key is being positioned before the move becomes obvious.

Nasdaq 100 Chart Analysis After the Fed DecisionNasdaq 100 Chart Analysis After the Fed Decision
The Nasdaq 100 index showed sharp volatility yesterday following the interest rate announcement. The market action can be interpreted as follows:
→ First, the FOMC decision was released: as expected, the Federal Funds Rate was cut from 4.00% to 3.75% (a bullish catalyst), which pushed the index up towards point A.
→ However, half an hour later Jerome Powell’s press conference began, and his tone was noticeably hawkish (a bearish catalyst). The Fed Chair signalled that the rate-cutting cycle has been paused because inflation remains elevated and additional labour-market data is needed. As a result, the index fell sharply from point A to the low at point B.
Meanwhile, Donald Trump criticised the Fed’s decision, arguing that rates should be cut far more aggressively. This adds to uncertainty, especially given expectations that Powell will leave his post in May 2026.
Bearish pressure on the tech index intensified further after Oracle’s earnings release — see yesterday’s post for details. The results disappointed investors, fuelling renewed talk of an AI bubble, and ORCL shares plunged around 11% in after-hours trading.
Technical Analysis of the Nasdaq 100 Chart
Looking at recent price action in the Nasdaq 100, the index appears to be forming a bearish Rounding Top pattern:
→ The peak at point A resembles a bull trap, as the price only slightly exceeded the December highs before reversing — in SMC terms, a sign of a bearish liquidity grab.
→ The price then broke support from several recent sessions around 25,570 after forming a large bearish candle (marked by the arrow). This indicates strong selling pressure (a market imbalance) and the area may now act as resistance.
It is possible that bulls will attempt to recover some of yesterday’s losses today. However, if any rebound stalls near this resistance zone, the Nasdaq 100 may continue to drift lower along a rounding downward trajectory.
This article represents the opinion of the Companies operating under the FXOpen brand only. It is not to be construed as an offer, solicitation, or recommendation with respect to products and services provided by the Companies operating under the FXOpen brand, nor is it to be considered financial advice.

Nasdaq 100 Ahead of the HolidaysNasdaq 100 Ahead of the Holidays
As the chart shows, the Nasdaq 100 has rebounded from its roughly 2.5-month low recorded on 21 November. At that point, bearish sentiment was driven by fears of an “AI bubble”, expectations of higher interest rates, and other news-related pressures.
The recovery from that level was strong — in less than a week the index gained around 5.3%, signalling robust demand. This not only offsets last week’s concerns but also injects optimism into the near-term outlook.
Technical Analysis of the Nasdaq 100 Chart
Examining recent price action in the Nasdaq 100, we can outline an ascending channel in which:
→ the median line acted as support until mid-November;
→ support at the lower boundary helped form the 21 November low.
From the perspective of buying pressure:
→ The November dip appears to be an intermediate correction within a broader emerging uptrend.
→ The brief move below the psychological 24k level (where the notable September and October lows lie) resembles a Liquidity Grab pattern, suggesting so-called Smart Money may have used sellers’ liquidity to build long positions — a sign of bullish intent.
From the perspective of selling pressure:
→ the market remains within a corrective structure (highlighted in red);
→ today, the Nasdaq 100 is trading near 25,265, a level that acted as resistance on 17–20 November.
It is possible that trading near the channel’s median line will encourage a balance between buying and selling forces — just as market participants head off to celebrate Thanksgiving.
This article represents the opinion of the Companies operating under the FXOpen brand only. It is not to be construed as an offer, solicitation, or recommendation with respect to products and services provided by the Companies operating under the FXOpen brand, nor is it to be considered financial advice.

Tech Stocks Rally After Nvidia’s Earnings ReportTech Stocks Rally After Nvidia’s Earnings Report
As the chart shows, the Nasdaq 100 index is displaying positive momentum today. A strong catalyst for growth arrived with the release of Nvidia’s quarterly report, which exceeded Wall Street’s optimistic expectations.
Nvidia reported quarterly revenue of $57bn (vs. the expected $54.9bn), and earnings per share of $1.30 (forecast: $1.26). Meanwhile, CEO Jensen Huang stated that demand for the new Blackwell chips is “off the charts”.
Nvidia’s strong report revived “risk appetite” in the tech sector and eased concerns about a potential AI bubble.
Technical Analysis of the Nasdaq 100 Chart
Analysing the hourly chart of the Nasdaq 100 two days earlier, we:
→ noted that the previously active upward channel had broadened downwards;
→ suggested a scenario in which the bulls might attempt to return the index to an upward trajectory if Nvidia’s quarterly results were strong.
Yesterday’s report from the equity market leader confirmed that demand for artificial intelligence infrastructure remains enormous, paving the way for the tech-sector rally to continue.
From the standpoint of supply pressure, resistance may come from:
→ the upper red line drawn through the lower November highs;
→ the 25,400 level, which had acted as local support but was decisively broken by a large bearish candle.
On the other hand:
→ the decline towards 24,400 once again activated buying interest;
→ the November drop may prove to be only an intermediate correction, after which the upward trend could resume.
Whether the bulls can maintain positive momentum in the Nasdaq 100 following Nvidia’s strong quarterly figures will depend largely on the outcome of the delayed September US employment report, postponed due to the shutdown.
This article represents the opinion of the Companies operating under the FXOpen brand only. It is not to be construed as an offer, solicitation, or recommendation with respect to products and services provided by the Companies operating under the FXOpen brand, nor is it to be considered financial advice.
Nasdaq 100 Under PressureNasdaq 100 Under Pressure
As the chart shows, the Nasdaq 100 index fell today (point 3) to its lowest level in a month, making it the weakest performer among the major US indices. The sell-off in the technology sector has been driven by a double blow:
→ A reassessment of expectations for the Federal Reserve’s next rate move. According to market observers, the probability of a Fed rate cut on 10 December continues to decline and now stands at 43%, compared with 62% a week earlier.
→ Growing scepticism about the valuations of companies linked to artificial intelligence. A Bank of America fund managers’ survey revealed heavy overcrowding in tech: 54% cited “long Magnificent 7” as the most crowded trade, while 45% viewed an AI bubble as the biggest tail risk.
Technical Analysis of the Nasdaq 100 Chart
When analysing the hourly chart of the Nasdaq 100 on 10 November, we identified an ascending channel. However, mounting selling pressure has resulted in:
→ the channel being extended downwards;
→ its former lower boundary (which acted as support) now acting as the median line and serving as resistance.
From the demand perspective:
→ The lower boundary of the expanded channel may prevent a deeper bearish move.
→ The chart shows a sequence of false bearish breakouts (1–2–3), where the price dips slightly below the previous low only to reverse sharply upward — signs of a Liquidity Grab pattern that may indicate buyer aggression.
From the supply perspective:
→ The 25220–25415 zone appears to be a confirmed FVG area, where a clear market imbalance emerged and sellers strongly dominated.
Bulls may attempt to push the Nasdaq 100 back into the ascending channel, but whether this scenario plays out will largely depend on Nvidia’s quarterly earnings report — a key event for the technology sector, scheduled for release tomorrow.
This article represents the opinion of the Companies operating under the FXOpen brand only. It is not to be construed as an offer, solicitation, or recommendation with respect to products and services provided by the Companies operating under the FXOpen brand, nor is it to be considered financial advice.

Nasdaq 100 Rebounds as Traders Anticipate End of the US ShutdownNasdaq 100 Rebounds as Traders Anticipate End of the US Shutdown
As the chart shows, the Nasdaq 100 index has started the week on a positive note amid growing expectations that the longest government shutdown in US history may soon come to an end.
According to Reuters, a bill has been introduced in the Senate proposing amendments to extend government funding until 30 January. The news acted as a bullish catalyst for equity markets. Still, the question remains – is the risk truly behind us?
Technical Analysis of the Nasdaq 100
Analysing the hourly chart of the Nasdaq 100 on 4 November, we:
→ Drew an ascending channel;
→ Noted signs of momentum exhaustion, as mentioned in our previous headline.
Since then, price action has evolved as follows:
→ The lower boundary of the channel provided support (1), prompting a brief rebound;
→ The 25,770 level acted as resistance (2) on two occasions, strengthening the bears’ confidence to push for a downside breakout — which ultimately succeeded.
The index’s subsequent movements have now more clearly outlined the formation of a descending channel (shown in red).
From the demand-side perspective:
→ After a false bearish breakout below 24,680 (showing characteristics of a Liquidity Grab pattern), the market staged an aggressive rally from point B;
→ Today’s session opened with a bullish gap, and the price has moved above the red median line.
From the supply-side perspective:
→ The 25,500 level, where sellers gained control during the previous channel breakout, may now act as resistance;
→ If the A→B move is viewed as an impulse, today’s rally appears to be a corrective rebound consistent with Fibonacci proportions — suggesting that downward momentum could resume within the red channel.
This article represents the opinion of the Companies operating under the FXOpen brand only. It is not to be construed as an offer, solicitation, or recommendation with respect to products and services provided by the Companies operating under the FXOpen brand, nor is it to be considered financial advice.

Nasdaq 100 Analysis: Early November Movements Raise ConcernsNasdaq 100 Analysis: Early November Movements Raise Concerns
As the chart shows, the Nasdaq 100 index gained around 6% in October, supported by several key factors:
→ The meeting between US President Donald Trump and Chinese leader Xi Jinping, which helped ease tensions in trade relations between the world’s two largest economies.
→ A 0.25% rate cut by the Federal Reserve.
→ Positive earnings from major tech companies, including a strong report from Alphabet (GOOGL).
However, the market’s behaviour in early November is cause for concern — on the morning of 4 November, the stock index fell to its lowest level in a week. Bearish sentiment is being fuelled by:
→ uncertainty over the timing of the end of the government shutdown;
→ a weaker-than-expected ISM Manufacturing PMI report, which may reflect the impact of Trump’s tariffs on US industry.
Technical Analysis of the Nasdaq 100 Chart
Analysing the hourly chart of the Nasdaq 100 on 30 October, we:
→ confirmed the relevance of the upward channel (shown in blue), noting that the upper boundary was showing signs of resistance;
→ drew a steeper trajectory consisting of three orange lines;
→ suggested a profit-taking scenario, in which bears would attempt to push the Nasdaq 100 index down towards the median line of the blue channel.
This scenario has since materialised, as:
→ the median line has repeatedly acted as support (highlighted in blue);
→ the breakout level of the orange lines at 26,120 has turned into a resistance zone.
At present, the Nasdaq 100 index is trading in the lower half of the channel, indicating that the bullish momentum from late October has faded. Bulls might find support near the gap area, reinforced by the lower boundary of the blue channel.
This article represents the opinion of the Companies operating under the FXOpen brand only. It is not to be construed as an offer, solicitation, or recommendation with respect to products and services provided by the Companies operating under the FXOpen brand, nor is it to be considered financial advice.

NASDAQ100 HIGH PROBABILITY SETUP SOON!!!🚨 NAS100 HIGH PROBABILITY SELL/BUY SETUP 🚨
* Here We Can See Clearly The Next Potential Moves For US100 Coming Hours/Days.
* Keep Your Eyes Close On Your Trading Positions.
* Happy PIP Hunting Traders.
FXKILLA.

News Whirlwind Propels Nasdaq 100 to a Fresh All-Time HighNews Whirlwind Propels Nasdaq 100 to a Fresh All-Time High
According to the chart, the Nasdaq 100 index has climbed above the 26,260 mark for the first time in history. Market sentiment is being driven by an extraordinary combination of powerful news factors:
→ Meeting between US President Donald Trump and China’s leader Xi Jinping in Busan, South Korea. The talks lasted around one hour and forty minutes. Xi emphasised the importance of “steering the giant ship” of bilateral relations, while Trump described the meeting as “tremendous” and “fantastic”. However, few concrete details about a potential trade deal were revealed.
→ Federal Reserve rate cut. As expected, the Fed cut interest rates by 0.25% yesterday. Jerome Powell struck a cautious tone, using the metaphor of “driving through fog” to describe the lack of key inflation and labour market data due to the government shutdown. He also highlighted divisions within the committee, suggesting that another rate cut – possibly in December – remains uncertain.
→ Tech giant earnings reports. After the US stock market closed yesterday, Microsoft (MSFT), Alphabet (GOOGL), and Meta Platforms (META) released their quarterly results. A key theme across all three was massive capital expenditure on artificial intelligence. Investors are now questioning whether these heavy investments are beginning to pay off.
Technical analysis of the Nasdaq 100 chart
At the start of the week, when analysing the hourly chart of the Nasdaq 100, we:
→ used the outlines of the 10 October sell-off to construct an upward channel (shown in blue);
→ drew a steeper trajectory using three orange trendlines;
→ suggested that the price target was the upper boundary of the blue channel.
That target has now been reached, and the upper boundary is showing signs of resistance — evidenced by the price slipping below the middle orange line and now being supported by the lower one.
Given the emerging RSI divergence, it is reasonable to assume that the upward momentum (+6% since the start of the month) may begin to slow. Note the recent bearish candlestick (marked by an arrow), notable for its strong move. Profit-taking could soon occur, with bears potentially attempting to push the Nasdaq 100 back down towards the median of the blue channel.
This article represents the opinion of the Companies operating under the FXOpen brand only. It is not to be construed as an offer, solicitation, or recommendation with respect to products and services provided by the Companies operating under the FXOpen brand, nor is it to be considered financial advice.

Nasdaq 100 Analysis: Index Reaches an All-Time HighNasdaq 100 Analysis: Index Reaches an All-Time High
As the chart shows, trading in the Nasdaq 100 opened with a bullish gap today, with the price rising above the 25,600 mark for the first time in history.
The upbeat sentiment is being driven by:
→ expectations of a potential interest rate cut, with the Federal Reserve’s decision due on Wednesday;
→ the upcoming meeting between Chinese and U.S. leaders, where the presidents may announce a new trade agreement;
→ anticipation of quarterly earnings reports from major tech firms – Amazon (AMZN), Apple (AAPL), Microsoft (MSFT), Alphabet (GOOGL) and Meta Platforms (META) are all set to release results this week.
Technical Analysis of the Nasdaq 100 Chart
A closer look at the hourly Nasdaq 100 chart, within the context of this month’s volatility, shows a steady recovery from the sharp drop on 10 October – the day President Trump suggested imposing 100% tariffs on Chinese goods.
The contours of that sell-off can now be used to outline an ascending channel, which neatly captures the market’s current price swings. Notably, today the index climbed into the upper half of that channel, overcoming resistance levels at:
→ the channel’s median line;
→ the 25,220 mark.
Since last Thursday’s low, the price has advanced by more than 3.5% – a strong rally – forming a steep upward trajectory (highlighted in orange). In this context:
→ the next potential target lies at the upper boundary of the blue channel, which would mark a new record high near 26,000 for the Nasdaq 100;
→ however, with RSI signalling overbought conditions, a short-term correction towards 25,500 would be a healthy development.
Should this week’s key events deliver the optimism investors are hoping for, the bulls may well succeed in reaching those ambitious targets.
This article represents the opinion of the Companies operating under the FXOpen brand only. It is not to be construed as an offer, solicitation, or recommendation with respect to products and services provided by the Companies operating under the FXOpen brand, nor is it to be considered financial advice.
Nasdaq100 Breakout Map – Bullish Targets Ahead?🕵️♂️ NDX/US100 “NASDAQ100” Market Wealth Strategy Map (Swing/Day Trade) 🚀
📊 Plan: Bullish Bias (Swing/Day Trade)
🎯 Entry Idea (Thief Layering Style):
Using a layering strategy (multiple limit orders). My preferred buy zones are:
🟢 24,300
🟢 24,400
🟢 24,500
🟢 24,600
(Feel free to adjust/add layers based on your own style — flexibility is key.)
🔒 Protective Stop (Thief SL):
❌ Around 24,000 (but note: this is just my map, you can manage risk as per your own plan).
💰 Target Area (Profit Zone):
🚧 25,500 = strong resistance barricade + overbought region + potential bull trap.
✅ My preferred exit: 25,400 (just before the “police barricade” 🚓).
⚠️ Note for Thief OG’s:
I’m not recommending to only follow my SL/TP. This is an educational trade map, not a fixed financial call. Adapt, adjust, and take profits your way.
🔑 Key Catalysts & Correlation Map:
Tech Sector Strength: US100 often mirrors mega-cap tech momentum ( NASDAQ:AAPL , NASDAQ:MSFT , NASDAQ:NVDA ).
Risk-On/Off Mood: Watch TVC:VIX — if fear spikes, layers may fill quicker.
Dollar Impact: TVC:DXY weakness often fuels NASDAQ:NDX upside.
Bond Yields: Higher yields = pressure on tech. Keep TVC:US10Y in your radar.
📌 Other Related Charts to Watch:
SP:SPX / CME_MINI:ES1! → Correlated US equity benchmark.
TVC:DXY → Inverse correlation (watch dollar moves).
TVC:VIX → Volatility indicator for risk sentiment.
BITSTAMP:BTCUSD → Risk sentiment cousin, moves with tech flows sometimes.
✨ “If you find value in my analysis, a 👍 and 🚀 boost is much appreciated — it helps me share more setups with the community!”
⚠️ Disclaimer:
This is a Thief Style Trading Strategy Map — created for fun, educational purposes, and market observation only. Not financial advice. Trade at your own risk, ladies & gentlemen. 🕵️♂️💸
#NASDAQ100 #NDX #US100 #SPX #Stocks #Indices #Trading #SwingTrade #DayTrade #LayeringStrategy #ThiefTrader

NAS100 Intraday & Swing Trade Setup🎯 NAS100 (NASDAQ-100) Technical Analysis: Oct 27-31, 2025 | Intraday & Swing Trade Setup
Closing Price: 25,373.7 | Date: Oct 25, 2025 12:54 AM UTC+4 | Timeframes: 5M, 15M, 30M, 1H, 4H, 1D
━━━━━━━━━━━━━━━━━━━━━━━━━━━━━━━━━━━━━━━━━━━━━━━━━━━━
📊 ELLIOTT WAVE & STRUCTURAL ANALYSIS 🌊
From the daily chart perspective, NAS100 shows completion of Wave 4 correction around 25,100-25,200 support zone. Current positioning at 25,373.7 suggests early Wave 5 development with bullish impulse structure emerging. The 4H timeframe confirms impulsive uptrend with higher highs and higher lows—classic Elliott Wave signature for institutional accumulation phase.
💡 KEY INSIGHT: If 25,900-26,050 resistance breaks decisively on 4H close with volume confirmation, we target Wave 5 extension toward 26,400-26,800 range through mid-week.
━━━━━━━━━━━━━━━━━━━━━━━━━━━━━━━━━━━━━━━━━━━━━━━━━━━━
🔄 DOW THEORY & TREND CONFIRMATION ⬆️
Primary Trend: Bullish | Higher highs established above 25,600 on 1H charts
Secondary Trend: Consolidation above 25,300-25,350 support validates buyer control
Confirmation Signal: Volume surge on breakouts above 25,900 confirms institutional participation
The daily VWAP sits at 25,420, acting as dynamic support. Price trading above VWAP with 1D EMA(20) > EMA(50) > EMA(200) alignment signals strong bullish conviction for the coming week.
━━━━━━━━━━━━━━━━━━━━━━━━━━━━━━━━━━━━━━━━━━━━━━━━━━━━
⚡ INTRADAY SETUPS: 5M TO 1H TIMEFRAMES
5M & 15M: Utilize Ichimoku Cloud crosses for quick scalp entries. Tenkan-sen/Kijun-sen crossover signals 3-5 minute momentum trades. Bollinger Bands (20,2) show tight squeeze—breakout imminent. RSI <30 on 5M = panic-sell exhaustion reversal opportunity.
30M: This is the swing trader's sweet spot . Harmonic patterns—particularly Butterfly and Bat patterns—should be monitored around 25,200-25,100 support confluence. Gann angles from Oct 22 low project resistance at 25,888, 26,150.
1H: Primary intraday timeframe for entry/exit. Support: 25,300 (VWAP), 25,100. Resistance: 25,900 (breakout trigger), 26,050. RSI overbought above 70 = profit-taking zone. EMA(9) above EMA(21) = trend strength confirmation.
━━━━━━━━━━━━━━━━━━━━━━━━━━━━━━━━━━━━━━━━━━━━━━━━━━━━
🎪 WYCKOFF METHOD & ACCUMULATION PHASE 📈
Current price action displays classic Wyckoff accumulation: Spring formation around 25,200 + subsequent recovery above neckline. Effort (volume) on upside breakouts now exceeds effort on downside—textbook Wyckoff buying climax setup. Watch for secondary test of 25,300—if holds above with lower volume, expect breakout run to 26,000+.
⚠️ WARNING: Climax volume spike above 26,000 may indicate exhaustion—take profits on target.
━━━━━━━━━━━━━━━━━━━━━━━━━━━━━━━━━━━━━━━━━━━━━━━━━━━━
🔷 HARMONIC PATTERNS & FIBONACCI LEVELS 📐
Gartley Pattern forming in 4H with D-point targeting 25,850-25,920 (78.6% Fib retracement). Potential risk/reward ratio of 1:3+ makes this ideal swing entry zone. Support cluster: 25,300-25,420 (multiple MA confluence + VWAP). Extended Fib target: 26,400 (161.8% extension from Oct 22 impulse base).
━━━━━━━━━━━━━━━━━━━━━━━━━━━━━━━━━━━━━━━━━━━━━━━━━━━━
📍 TRADING PLAN: MON-FRI (OCT 27-31) 🗓️
INTRADAY SCALPERS (5M-30M): Target 25,750-25,850 breakout on Monday. Stop: 25,250. Take profit 1: 25,650 (+300 pips). Repeat breakout patterns on every higher low formation.
SWING TRADERS (4H-1D): Accumulate longs 25,300-25,420 on dips. Primary target: 26,150-26,250 (Wave 5 target). Secondary: 26,400-26,800. Stop loss: 24,900 (break below daily cloud). Risk/reward: 1:2.5 minimum.
⏰ OPTIMAL TIMING: US market open (13:30 UTC) provides best 5M-1H breakout volatility.
━━━━━━━━━━━━━━━━━━━━━━━━━━━━━━━━━━━━━━━━━━━━━━━━━━━━
🚨 REVERSAL & BREAKOUT SIGNALS 🎯
Reversal Alert: If RSI divergence forms (lower high on price, lower high on RSI) at 26,000+ = sell-off imminent. Initial support: 25,650. Hard stop: 25,420.
Breakout Confirmation: Volume >200M shares on 4H close above 26,000 = institutional breakout, extend targets to 26,600+. Failure to hold 25,900 three times = bullish setup invalidation.
━━━━━━━━━━━━━━━━━━━━━━━━━━━━━━━━━━━━━━━━━━━━━━━━━━━━
📊 VOLATILITY & BOLLINGER BAND SQUEEZE 📉
Current Bollinger Band width suggests compression before expansion . Watch 1H BB (20,2) for band walk breakout into 26,000+ on closing above upper band. ATR expansion above 250-300 points validates trending move. Consolidation below upper band = power accumulation before next leg up.
━━━━━━━━━━━━━━━━━━━━━━━━━━━━━━━━━━━━━━━━━━━━━━━━━━━━
⚖️ RISK MANAGEMENT CHECKLIST ✅
Daily loss limit: 2% portfolio | Use 1:2 minimum risk/reward ratio
Position sizing: Reduce entries above 26,200 (resistance cluster)
Breakout confirmation: Require 5-minute close above resistance + volume spike
Support holds: If 25,300 closes below on daily, trend invalidates—exit swings
━━━━━━━━━━━━━━━━━━━━━━━━━━━━━━━━━━━━━━━━━━━━━━━━━━━━
🎓 Technical Theory Applied: Elliott Wave (Wave 5 setup) | Wyckoff (Accumulation completion) | Dow Theory (Higher highs confirmation) | Harmonic Patterns (Gartley D-point) | Gann (Angular resistance) | Japanese Candlesticks (Bullish engulfing on 4H)
🛠️ Indicators Aligned: Bollinger Bands (squeeze breakout), RSI (bullish divergence), Volume (accumulation), VWAP (dynamic support), MAs (uptrend slopes), Ichimoku Cloud (bullish crossover).
📈 Bias: BULLISH with caution above 26,200
━━━━━━━━━━━━━━━━━━━━━━━━━━━━━━━━━━━━━━━━━━━━━━━━━━━━
⚠️ Disclaimer: This post is educational content and does not constitute investment advice, financial advice, or trading recommendations. The views expressed here are based on technical analysis and are shared solely for informational purposes. The stock market is subject to risks, including capital loss, and readers should exercise due diligence before investing. We do not take responsibility for decisions made based on this content. Consult a certified financial advisor for personalized guidance.

NASDAQ100 HIGH PROBABILITY SETUP SOON!!!🚨 NAS100 HIGH PROBABILITY BUY SETUP 🚨
* Here We Can See Clearly The Next Potential Move For US100 Coming Hours/Days.
* Keep Your Eyes Close On Your Trading Positions.
* Happy PIP Hunting Traders.
FXKILLA.

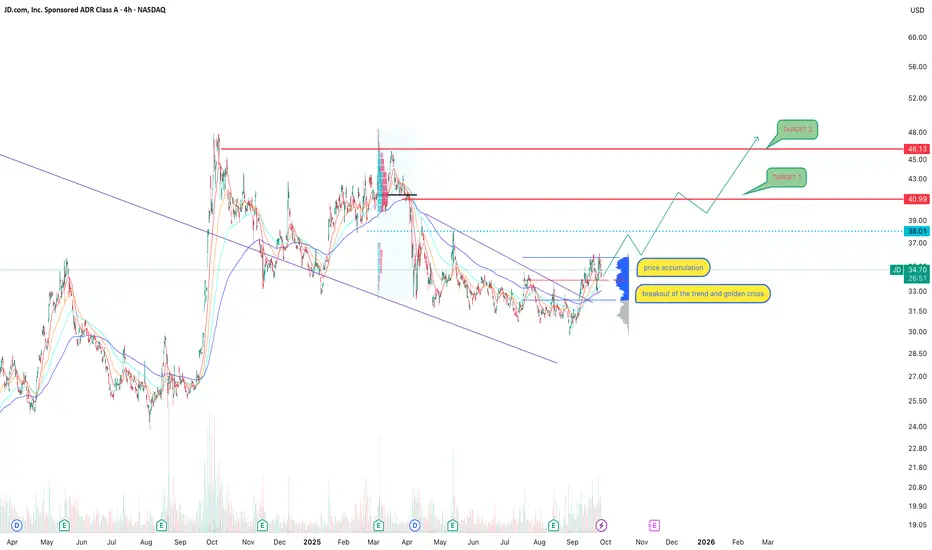
JD.com: accumulation, golden cross, and a chance to restart JD.com remains one of China’s largest e-commerce players, and despite macroeconomic headwinds, the company continues to hold its ground. Fundamentally, JD is focused on optimizing logistics, cutting costs, and expanding its cloud segment. Government policies aimed at boosting domestic demand also provide support. Risks remain tied to China’s economic slowdown and fierce competition from Alibaba and PDD, but at current levels the stock looks attractive for long-term investors.
Technically, the 4H chart shows a breakout of the descending trendline and the formation of a golden cross (50 EMA crossing above 200 EMA), confirming a medium-term trend shift. Price has consolidated above the accumulation zone and is now testing $34.50–35.00. If momentum holds, the next upside targets are $41.00 and $46.00, key resistance levels. A more conservative scenario involves a pullback toward $33.00–32.50, followed by another upward leg.
This is exactly the kind of market situation where investor expectations diverge from reality, and the longer it lasts the more it seems like a trend reversal is near. But as always, emotions must be set aside and clear signals awaited before committing.
NQ (Nasdaq Futures) – Tuesday Setup 09/09/2025
🧠 Market Context
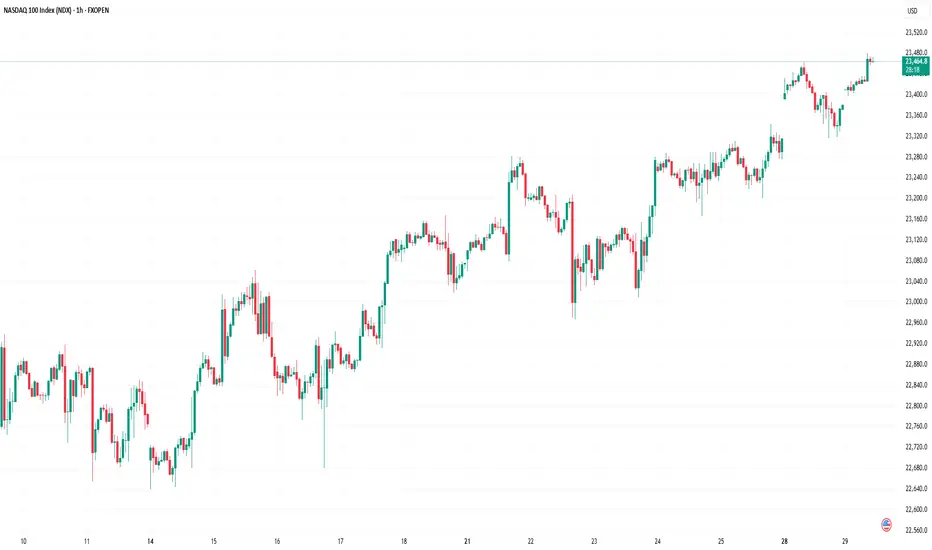
Weekly Bias: Buy-side liquidity above Friday’s and Monday’s highs remains intact → a natural draw for price.
Daily Bias: Price is consolidating near these highs, suggesting engineered liquidity.
Tuesday Profile (ICT concept): Often prints the high or low of the week. Expect a Judas Swing in the morning session before the real move develops.
🎯 Trading Idea
I expect New York Open (9:30–10:00 NY) to deliver a pump above Monday/Tuesday highs → running buy stops (BSL).
After this liquidity grab, look for rejection + Market Structure Shift (MSS) on 5m/15m charts.
That would confirm distribution and set up the short.
✅ Execution Plan
Wait for the Sweep:
Levels to watch: 23,890–23,910 (Friday & Monday highs).
Confirmation:
SMT divergence (ES fails to make new high while NQ takes it).
BOS/MSS on 5m → entry on FVG/OB retracement.
Targets:
TP1 → 23,800 (intra-day liquidity).
TP2 → 23,750 (Weekly Open level).
📌 Key Notes
If price continues bullish above 23,910 without rejection, invalidate the short idea → bias shifts to continuation higher (24,000+).
Otherwise, this is a textbook “Tuesday High of the Week” setup.
✍️ Summary:
I’m anticipating a Judas Swing to the upside at NY Open, taking buy-side liquidity, followed by a reversal into sell-side liquidity at 23,750.

Nasdaq 100 Analysis: Tech Stocks Face Sell-OffsNasdaq 100 Analysis: Tech Stocks Face Sell-Offs
As the chart shows, the Nasdaq 100 index fell by approximately 1.6% yesterday.
According to media reports, bearish sentiment has been fuelled by the approach of key events:
→ the release of the FOMC meeting minutes (today at 21:00 GMT+3);
→ Jerome Powell’s speech at the Jackson Hole symposium on Friday. Market participants are preparing for remarks from the Fed Chair on the trajectory of interest rates.
Notably, the S&P 500 declined less significantly, while the Dow Jones remained virtually unchanged. This suggests that:
→ tech stocks are heavily overvalued due to AI-driven hype;
→ capital shifted yesterday from risk assets (including cryptocurrencies) into so-called safe havens.
Could tech stocks continue to decline?
Technical Analysis of the Nasdaq 100
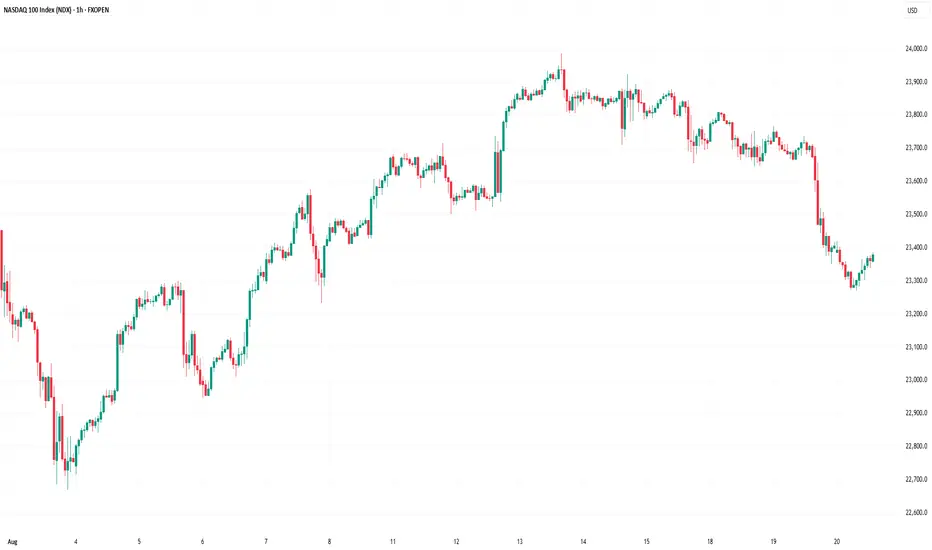
Analysing the Nasdaq 100 index chart on 5 August, we plotted the main upward channel (shown in blue). It remains valid, as since then the price has:
1→ reached the upper boundary, which (as often happens) acted as resistance;
2→ retreated to the median line, where volatility decreased (a sign of balance between supply and demand), but only briefly.
Yesterday’s low coincided with the lower boundary of the channel.
From a bullish perspective, buyers might rely on:
→ a resumption of the uptrend from the lower boundary (as was the case in early August);
→ support at the 50% retracement level after the A→B impulse (located around the current price area);
→ a rebound from the oversold zone indicated by the RSI;
→ support at the 7 August low of 23,250 (a false bearish breakout remains possible).
On the other hand: the price has confidently broken through the channel median and then accelerated downwards (a sign of imbalance in favour of sellers). This imbalance zone (which, under the Smart Money Concept methodology, is considered a bearish Fair Value Gap) could act as resistance going forward.
Given the pace of yesterday’s decline, we could assume that sellers currently hold the initiative. Should we see weak rebounds (in the style of a dead cat bounce) from the channel’s lower boundary, the likelihood of a bearish breakout could increase.
This article represents the opinion of the Companies operating under the FXOpen brand only. It is not to be construed as an offer, solicitation, or recommendation with respect to products and services provided by the Companies operating under the FXOpen brand, nor is it to be considered financial advice.
Nasdaq 100 Analysis: Index Rebounds After Friday’s DeclineNasdaq 100 Analysis: Index Rebounds After Friday’s Decline
The release of disappointing US labour market data on Friday unsettled both stock market participants and the President of the United States:
→ Donald Trump promptly dismissed Erica McEntarfer, Commissioner of the Bureau of Labor Statistics, accusing her of falsifying employment data.
→ Stock indices accelerated their decline, with the Nasdaq 100 Index falling below its 16 June low.
However, US stock indices staged a strong recovery on Monday. According to Reuters, yesterday marked the largest daily percentage gain since 27 May.
Why Did Stock Indices Rise?
Possible reasons include:
→ Buyers were attracted by the falling share prices of companies that, for the most part, had delivered strong quarterly earnings;
→ Market participants are betting on a potential rate cut by the Federal Reserve in September (a move strongly advocated by Trump), which could support both the economy and the stock market.
Technical Analysis of the Nasdaq 100 Chart
In our earlier analysis of the Nasdaq 100 Index, we:
→ Identified a primary ascending channel (marked in blue);
→ Highlighted that the price had risen above the upper boundary of the channel (a sign of excessive optimism);
→ Anticipated a potential correction towards the 23,020 level.
However, the correction turned out to be more substantial than initially expected.
As a result of the price movements on Friday and Monday:
→ The blue channel was widened twofold;
→ The price found support at its new lower boundary and reversed upwards;
→ As of today, the Nasdaq 100 index is trading near the median line.
This can be interpreted as the market aggressively digesting recent corporate earnings reports and the prospects of a rate cut in light of a deteriorating labour market. Demand and supply may reach a new equilibrium, potentially leading to a consolidation phase around the median of the widened channel.
It is also possible that the area marked in orange—where the price previously rallied strongly, indicating a buyer-driven imbalance—may now act as support. Resistance levels might include:
→ Former support at 23,320;
→ 23,440 – the level at which bears broke through the purple channel.
This article represents the opinion of the Companies operating under the FXOpen brand only. It is not to be construed as an offer, solicitation, or recommendation with respect to products and services provided by the Companies operating under the FXOpen brand, nor is it to be considered financial advice.

Nasdaq 100 Index Hits New Highs Ahead of Big Tech EarningsNasdaq 100 Index Hits New Highs Ahead of Big Tech Earnings
Earlier, we noted signs of optimism in the Nasdaq 100 index as the market anticipated earnings reports from major tech firms.
Now, companies such as Alphabet (GOOGL) and Tesla (TSLA) have already released their results (we previously covered their charts → here and here). Up next are the most highly anticipated earnings reports: this week, tech giants including Microsoft (MSFT), Amazon (AMZN), Meta Platforms (META), and Apple (AAPL) are set to publish their results. The combined market capitalisation of these four companies exceeds $11 trillion, and their reports could have a significant impact on a stock market that is already showing strong bullish sentiment:
→ The Nasdaq 100 index has climbed to an all-time high, surpassing the 23,400 mark.
→ The signing of trade agreements between the US and Europe (and earlier, Japan) has eased concerns about the negative impact of tariff barriers.
Technical Analysis of Nasdaq 100
The chart supports growing signs of optimism: earlier in July, the price remained within a rising channel (marked in blue). However, towards the end of the month, price action has begun to follow a steeper upward trajectory (marked in purple).
What could happen next? Much will depend on the earnings results and forward guidance from these tech giants.
On the one hand, continued enthusiasm around AI adoption could accelerate further growth. The stronger the optimism, the more fuel it may add to discussions around a potential bubble — with some analysts already drawing parallels to the dot-com era of the early 2000s.
On the other hand, earnings could temper market excitement and prompt a correction. For example, the index may retreat to the support level around 23,020, which is reinforced by the lower boundary of the blue trend channel.
This article represents the opinion of the Companies operating under the FXOpen brand only. It is not to be construed as an offer, solicitation, or recommendation with respect to products and services provided by the Companies operating under the FXOpen brand, nor is it to be considered financial advice.
"NASDAQ 100 Heist – Scalp, Swing, or Hold? (Full Plan)🔥 NASDAQ 100 HEIST PLAN – BULLISH LOOT AWAITS! 🔥
🚨 Attention Market Robbers & Money Makers! 🚨
(Swing/Day Trade Strategy – High-Risk, High-Reward Play)
🎯 Mission Objective: Loot the NDX100/US100 (NASDAQ 100) Like a Pro!
Based on Thief Trading’s ruthless technical & fundamental analysis, we’re executing a bullish heist—targeting the Red Zone (high-risk, high-reward area).
⚠️ WARNING: Overbought market, consolidation zone, potential bear traps—weak bears may get slaughtered! Strong hands only!
🔐 ENTRY: The Vault is OPEN!
"SWIPE THE BULLISH LOOT!" – Any price is a steal, but smart thieves use:
Buy Limit Orders (15m-30m TF) near recent swing lows/highs.
DCA/Layering Strategy – Multiple limit orders for max loot.
Breakout Confirmation – Don’t jump in early; wait for the real move!
🛑 STOP LOSS: Protect Your Stash!
Thief’s SL Rule: Nearest 4H swing low (22,600) – WICK LEVEL ONLY!
DO NOT place SL before breakout! (Patience = Profit.)
Adjust SL based on risk, lot size, and number of orders.
🎯 TARGETS: Escape Before the Cops Arrive!
Main Take-Profit: 24,400 (or exit early if momentum fades).
Scalpers: Longs ONLY! Use trailing SL to lock in profits.
Swing Traders: Ride the wave like a true market pirate!
📰 FUNDAMENTAL BACKUP: Why This Heist Will Work
Bullish momentum in NDX100 driven by:
Macro trends (Fed, inflation, tech earnings).
COT Report & Institutional positioning.
Geopolitical & Sentiment Shifts.
Intermarket correlations (USD, Bonds, Tech Sector).
(Stay updated—markets change FAST!)
⚠️ TRADING ALERT: News = Danger Zone!
Avoid new trades during high-impact news.
Trailing SL = Your best friend.
Lock profits early if volatility spikes!
💥 BOOST THIS HEIST! 💥
👉 Hit LIKE & FOLLOW to strengthen our robbery crew!
🚀 More heists coming soon—stay tuned, thieves! 🚀

NASDAQ 100 TECH HEIST: Bullish Loot Before the Bear Trap!🚨 E-MINI NASDAQ 100 HEIST: Tech Rally or Bear Trap? (Thief Trading Blueprint) 🚨
🌟 Hola! Oi! Bonjour! Hallo! Salam! 🌟
Attention all Market Bandits & Tech Raiders! 🏴☠️💻💰
🔥 Thief Trading Intel: We're targeting the E-MINI NASDAQ 100 for a bullish loot grab! Long entry only—high-risk Red Zone ahead: overbought, consolidating, and primed for a reversal. Don’t let the bears ambush your profits!
"Claim your tech treasure and run—you’ve earned this steal!" 💰🚀
🚪 ENTRY: The Tech Vault is Open!
📈 "Swipe bullish loot at any price—the heist is LIVE!"
Buy Limit orders at recent swing lows/highs (15-30 min TF).
📌 Pro Thief Move: SET ALERTS! Don’t miss the breakout.
🛑 STOP LOSS: Escape Plan
📍 Thief SL (Smart Crew): Recent swing low (20,700.00, 4H TF).
📍 Adjust based on your risk, lot size, and orders.
🎯 TARGET: Loot & Exit!
🎯 22,600.00 (or bail early if the market flips!)
⚡ SCALPERS’ QUICK HIT
👀 Long scalps ONLY!
Deep pockets? Raid now.
Light wallet? Join swing traders.
Trailing SL = Your Profit Shield! 🛡️
📢 WHY THIS HEIST? (NASDAQ Bullish Momentum)
Tech rally brewing! Key drivers:
Fundamentals (COT, Macro, Geopolitics)
Sentiment & Intermarket Trends
Index-Specific Analysis & Positioning
🔗 Full intel? Bio linkss checkk! 👉🏻👉🏻👉🏻
⚠️ WARNING: News = Danger Zone! 📡🚨
Tech news moves FAST! Protect your loot:
❌ Avoid new trades during news.
🔒 Trailing SL = Lock profits.
💖 SUPPORT THE TECH HEIST CREW!
💥 SMASH THAT BOOST BUTTON! 💥
More boosts = bigger future heists!
Stronger crew = more $$$ for all!
Profit daily with Thief Trading Style! 📈🏆
Next tech raid coming soon—stay tuned! 🖥️🤑
