Double Trap on USTEC: Sell Zones Locked In!Hey Guys,
I’ve prepared a NASDAQ 100 / USTEC 100 analysis for you. I’m planning to open sell positions from two key levels:
🔹 First entry: 23,290 or 23,164
🔹 Second entry: 23,397 – 23,450
🎯 Target levels:
TP1: 22,800
TP2: 22,666
Every single like from you is my biggest source of motivation to keep sharing these analyses. Huge thanks to everyone who supports with a like! 🙏
Nasdaq100cfd

Nasdaq 100 Analysis: Index Rebounds After Friday’s DeclineNasdaq 100 Analysis: Index Rebounds After Friday’s Decline
The release of disappointing US labour market data on Friday unsettled both stock market participants and the President of the United States:
→ Donald Trump promptly dismissed Erica McEntarfer, Commissioner of the Bureau of Labor Statistics, accusing her of falsifying employment data.
→ Stock indices accelerated their decline, with the Nasdaq 100 Index falling below its 16 June low.
However, US stock indices staged a strong recovery on Monday. According to Reuters, yesterday marked the largest daily percentage gain since 27 May.
Why Did Stock Indices Rise?
Possible reasons include:
→ Buyers were attracted by the falling share prices of companies that, for the most part, had delivered strong quarterly earnings;
→ Market participants are betting on a potential rate cut by the Federal Reserve in September (a move strongly advocated by Trump), which could support both the economy and the stock market.
Technical Analysis of the Nasdaq 100 Chart
In our earlier analysis of the Nasdaq 100 Index, we:
→ Identified a primary ascending channel (marked in blue);
→ Highlighted that the price had risen above the upper boundary of the channel (a sign of excessive optimism);
→ Anticipated a potential correction towards the 23,020 level.
However, the correction turned out to be more substantial than initially expected.
As a result of the price movements on Friday and Monday:
→ The blue channel was widened twofold;
→ The price found support at its new lower boundary and reversed upwards;
→ As of today, the Nasdaq 100 index is trading near the median line.
This can be interpreted as the market aggressively digesting recent corporate earnings reports and the prospects of a rate cut in light of a deteriorating labour market. Demand and supply may reach a new equilibrium, potentially leading to a consolidation phase around the median of the widened channel.
It is also possible that the area marked in orange—where the price previously rallied strongly, indicating a buyer-driven imbalance—may now act as support. Resistance levels might include:
→ Former support at 23,320;
→ 23,440 – the level at which bears broke through the purple channel.
This article represents the opinion of the Companies operating under the FXOpen brand only. It is not to be construed as an offer, solicitation, or recommendation with respect to products and services provided by the Companies operating under the FXOpen brand, nor is it to be considered financial advice.

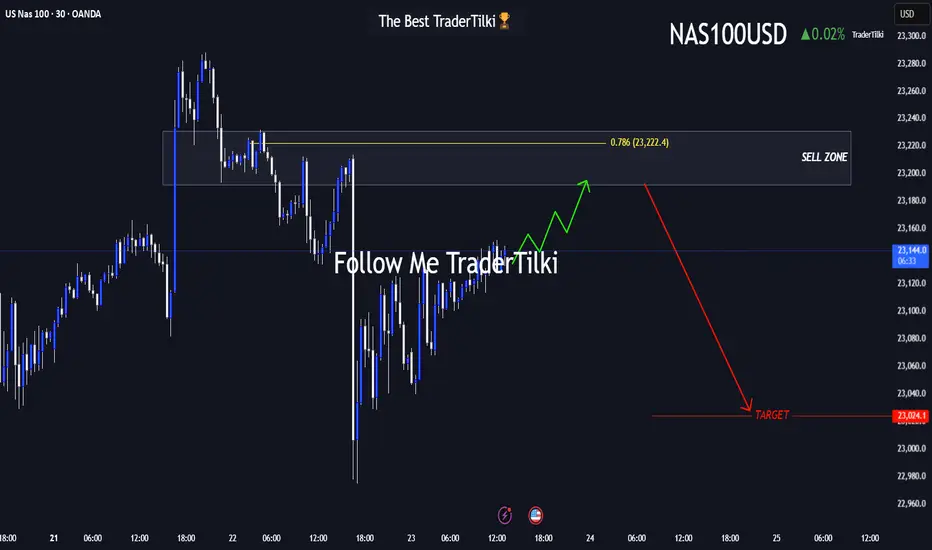
The US100-Nasdaq Playbook: Prime Sell Zone Approaching!Hey friends 👋
I’ve prepared a fresh US100-NASDAQ analysis for you all. Nothing makes me happier than seeing us grow and profit together.
📌 Once price reaches the 23,192 – 23,231 zone, I plan to enter a **Sell** trade from that area.
🔐 Feel free to set your stop-loss based on your personal margin and risk tolerance.
🎯 My target level is: **23,024**
Every single like from you means the world to me—it’s my biggest motivation to keep sharing high-quality analysis 🙏
Huge thanks to everyone who supports with their likes 💙
NAS100 Setup Locked In — Ride the Drop from the Order Block!Hey Guys,
I'm planning a sell trade on the NAS100 index from a designated order block. Once price reaches the sell zone, the position will be activated.
📍 Trade Details:
- 🟢 Entry Level: 22,869
- 🔴 Stop Loss: 22,930
- 🎯 TP1 – First Target: 22,839
- 🎯 TP2 – Second Target: 22,794
- 🎯 TP3 – Final Target: 22,671
📐 Risk-to-Reward Ratio: 3.24
Your likes and support are what keep me motivated to share these analyses consistently.
Huge thanks to everyone who shows love and appreciation! 🙏

Missiles in the Middle East, Headwinds on Nasdaq: NAS100 onHey There;
The trend line on the NAS100 has been broken to the downside. My target level after this breakout is 21,299.47. If the price moves towards this level, I think it will reach my target in line with fundamental analysis due to the broken trend line and Iran-Israel war tensions.
I meticulously prepare these analyses for you, and I sincerely appreciate your support through likes. Every like from you is my biggest motivation to continue sharing my analyses.
I’m truly grateful for each of you—love to all my followers💙💙💙

NAS100 | 1H | BUY ZONEHey There;
SIGNAL ALERT
BUY NAS100 / 17,682,18
🟢TP1: 18,000,00
🟢TP2: 18,500,00
🟢TP3: 19,726,64
🔴SL: 16,782,61
RR / 2,2
Please don't forget to like 🙏🏻
Thanks to everyone who supports my analysis with likes. 💙💙💙

DOGEUSDT | 1H | NOW IN SUPPORT ZONEHey traders
📉 Right now, Dogecoin is at a key support level. The 0.17514 zone is a critical support area, and we need to 👀 watch how it reacts from here.
📊 I believe this sharp drop happened due to the breakdown of the Head and Shoulders pattern.
⚠️ No need to panic—just wait for my analysis update!
⭐ Don’t forget to like 👍 so you don’t miss the next Dogecoin update! 🔔

US30 | 15M | SCALPING TIME | BUYHey There My Friend ; 🫡
SIGNAL ALERT
BUY US30 / 41,355,94 > 41,456,00
🟢TP1: 41,612,00
🟢TP2: 41,839,99
🟢TP3: 42,654,00
🔴SL: 41,029,00
RISK REWARD - 4,00
Thanks to everyone who supports my analysis with likes.💙💙💙

US100 | 1H | Pending Sell Order Hey there, if you want me to keep sharing analysis like this, please don’t forget to hit the like button 🚀
SIGNAL ALERT
SELL US100 | 21,289,5
🟢TP1: 21,228,0
🟢TP2: 21,151,0
🟢TP3: 20,935,0
🔴SL: 21,569,2

US100 - NAS100 | 4H | BULLHi everyone, if you want me to keep sharing analysis like this, please don’t forget to hit the like button 🚀
SIGNAL ALERT
BUY ( NAS100-US100 ) | 21,545,5
🟢TP1: 21,600,0
🟢TP2: 21,811,0
🟢TP3: 22,125,0
🔴SL: 21,072,0

US100 | 30M | SCALPING TIME Hi guys, I made CAPITALCOM:US100 analysis for you. For this kind of analysis, please value my analysis with your likes Thank you very much to everyone who supports me by liking
SIGNAL ALERT
SELL US100 21,726.5 - 21,730.1
🟢TP1: 21,700,9
🟢TP2: 21,670,1
🟢TP3: 21,600,1
🔴SL: 21,831,8
Stay with love guys.
